




When containers and container orchestration were introduced, they opened the possibility of helping companies utilize physical resources like CPU and memory more efficiently. But as more companies and bigger enterprises have adopted Kubernetes, FinOps professionals may wonder why their cloud bills haven’t gone down—or worse, why they have increased.
In theory, containers have the potential to help organizations use resources more efficiently, but in practice, they don’t always pave a direct path to cost savings. In 2020, as part of our annual container report, we found that nearly half of containers were using less than a third of their requested CPU and memory. Since requested resources correlate directly to the amount of CPU and memory Kubernetes nodes need, this indicates that many organizations pay for resources they don’t end up using.
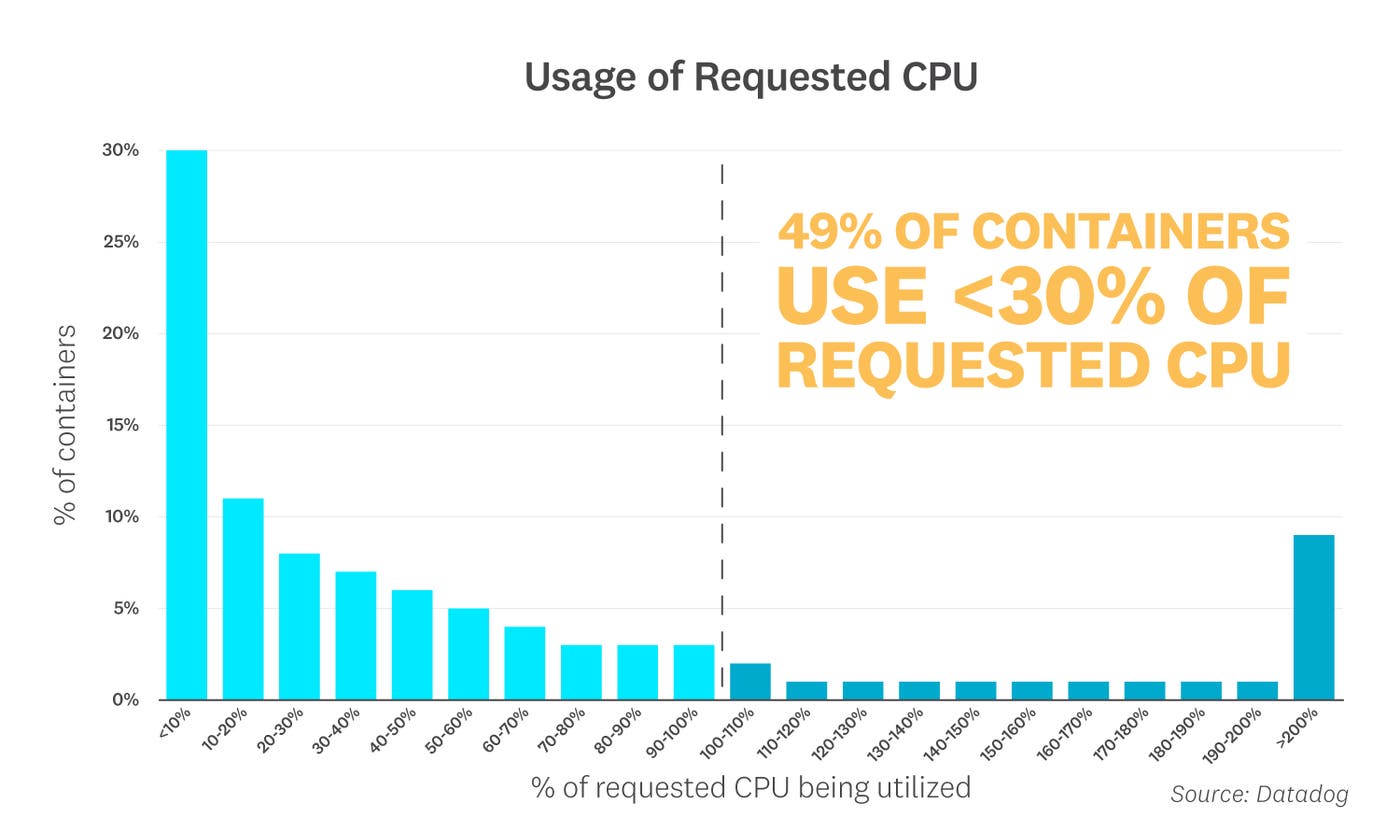
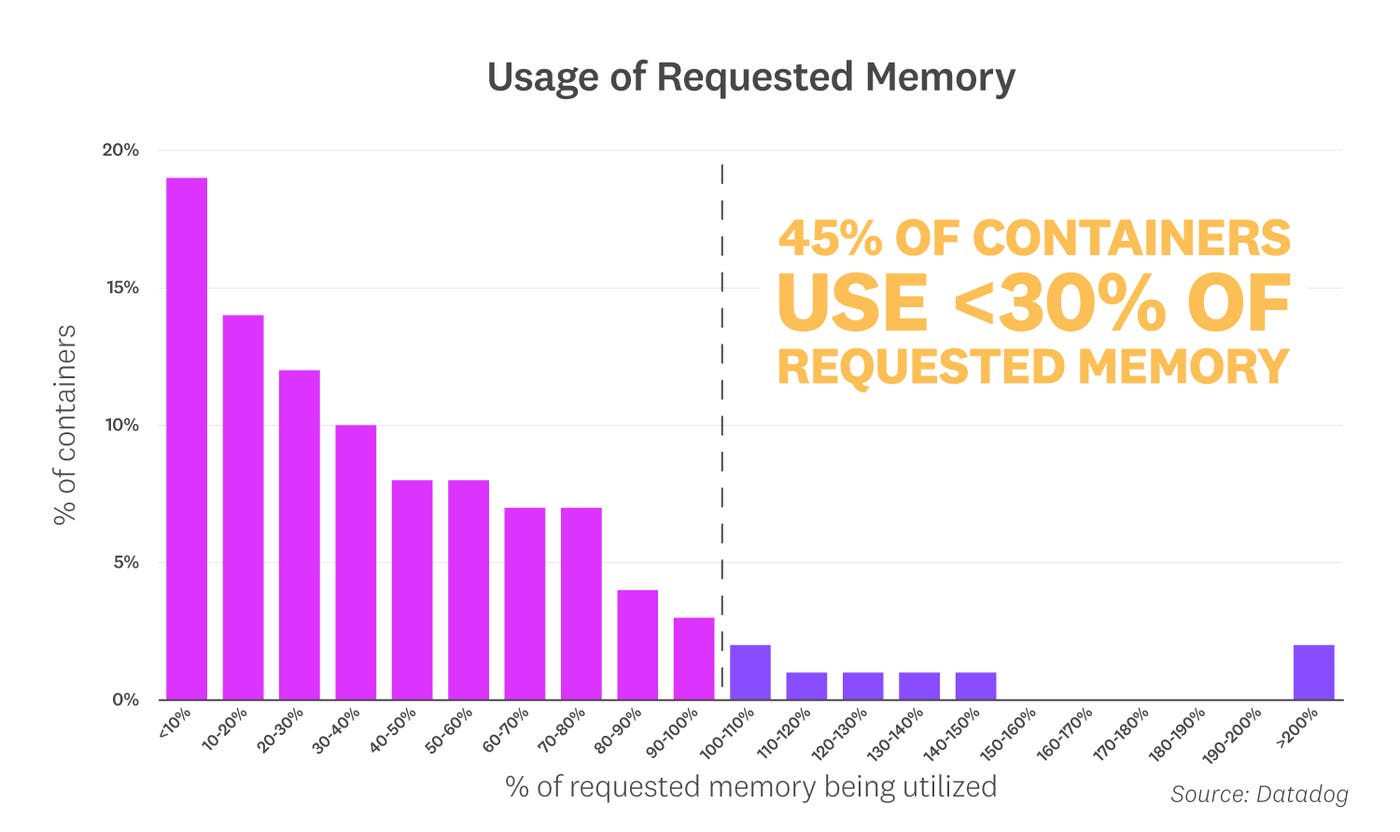
To get to the root of why this is happening—and understand how to mitigate the issue—we need to take a closer look at how resources are allocated in Kubernetes environments. In this post, we will explain how Kubernetes schedules pods on nodes and how that affects your resource usage. We will also share some practical tips to help you rightsize your Kubernetes workloads for cost efficiency and performance.
In Kubernetes, a container can request a set of resources as part of its pod specification. The scheduler takes these requests into account when deciding where to place pods in the cluster (e.g., it will not schedule a pod on a node that does not have enough memory to satisfy its containers’ requests). For the purpose of this post, we’ll focus on CPU and memory, but containers may also request other resources, such as huge pages and ephemeral storage. These requests affect how other pods are going to be scheduled on a node going forward.
To see this in action, let’s imagine a situation where a cluster has two worker nodes, each with 2 cores of CPU.

A new pod gets created with a container that is requesting 1,500 millicores (1.5 cores) of CPU:
kind: Pod
metadata:
name: pod1
spec:
containers:
- name: app1
image: images.my-company.example/app1:v4
resources:
requests:
cpu: "1500m"
The Kubernetes scheduler selects a node that has enough resources to fulfill the pod’s request, and it will reserve that amount of resources for the pod:

Now, let’s create a second pod with a container that is requesting 1,000 millicores (1 core) of CPU:
kind: Pod
metadata:
name: pod2
spec:
containers:
- name: app2
image: images.my-company.example/app2:v1
resources:
requests:
cpu: "1000m"
The scheduler won’t be able to place it on the first node, since that node only has 0.5 cores left, so it will schedule it on the second node:

Now, the first node has 0.5 cores that won’t be used until a pod requesting less than 0.5 cores is deployed to the cluster. That may not sound like a lot of waste, but keep in mind that in this example, we are assuming that the pods’ requests are appropriately sized (i.e., they accurately reflect their CPU usage).
But what would happen if the first pod actually only needed 250 millicores of CPU (but requested 1.5 cores), and the second pod only needed 0.5 cores (but requested 1 core)?
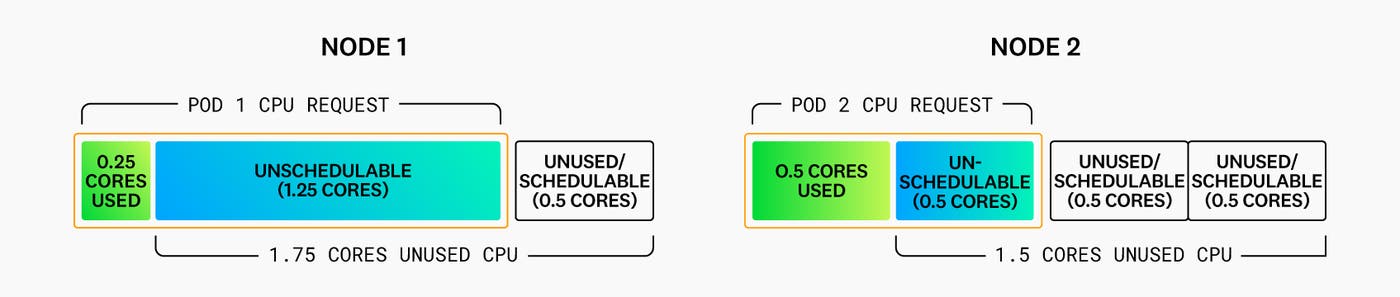
The problem becomes evident. Both nodes will have a fair amount of CPU resources that are both unused and unschedulable. This ultimately increases the need for more (or bigger) nodes—and the costs associated with them.
This is why it is critical for teams to request the right amount of CPU and memory requests for their containers (i.e., size their pods correctly).
If you’re looking for guidance on sizing pods for an existing service, skip ahead to the next section. But if you’re working on a new service that is going to be deployed to production for the first time, it can be difficult to know how much CPU and memory it will need in a real production scenario.
In these cases, the first step would be to make an estimate based on the application code and benchmark it on sample inputs. The best people to make this effort are the developers working on the service. Initially, they can benchmark components of the application separately, and then perform end-to-end benchmarks as development progresses. Establishing a ballpark expectation upfront may be useful to ensure business objectives are met—for instance, if performance is poor, the service may end up being too costly to run. However, this estimate should be checked with benchmarking as the project progresses, in order to avoid discovering major overruns when going into production and opening up your application to customers.
This first estimate needs to be conservative; we recommend that you request more than you think the service will need, at least initially. If you request less CPU than needed, performance issues may arise due to throttling. If you request less memory than the service regularly needs, then Kubernetes will evict the pods often. In the worst case, the kernel may kill container processes if they are using too much memory (OOMKilled).
Once you’ve made a first estimate, you can monitor your containers’ resource usage and make adjustments from there.
Making a best-effort guess about the resource requirements of your new service is a step in the right direction, but over the long run, you’ll want to use tools like the Kubernetes Vertical Pod Autoscaler and historical data to rightsize your workloads.
As a way to make it easier to rightsize pods, the Kubernetes project launched a project called the Vertical Pod Autoscaler (VPA). The VPA collects CPU and memory usage telemetry over time and uses that data to recommend appropriate values for your containers’ CPU and memory requests and limits. The VPA can also be configured so that those recommendations are applied, meaning that your pods will automatically be rescheduled with the new set of requests and limits.
This looks like a good starting point. But in order to decide if the VPA is the right solution for your workloads, it is important to understand how it works, how it makes its recommendations, and some of its current limitations.
The VPA currently uses the Kubernetes Metrics Server, a daemon that collects resource metrics from kubelets and exposes them in the Kubernetes API server. This means that in order to use the VPA, you would need to deploy and operate the metrics-server Deployment in your Kubernetes clusters.
Another factor to take into account is that, by default, the VPA makes recommendations of your containers’ future resource usage based on historical data observed over a rolling window. This may work well for workloads with stable usage of CPU or memory, but it wouldn’t work as well for workloads with different usage patterns, like those with periodic spikes and dips in CPU usage. To mitigate this, VPA 0.10 shipped with support for alternative recommenders, but this still introduces the overhead of having to implement custom recommenders for different workloads’ resource usage patterns.
As long as you’re aware of these limitations, the VPA can be a good way to start getting recommendations based on production data.
Analyzing historical data can be an effective way to rightsize your pods. With Datadog, you can track metrics coming directly from Kubernetes, like kubernetes.cpu.usage.total. These metrics are very suitable for tracking aggregations like avg, sum, max, but they are not easy to translate into a single value for your resource requests in Kubernetes.
Fortunately, the Datadog process agent collects Live Process data that can be used to generate percentile aggregations for both CPU usage and memory usage. You can use those metrics to analyze your containers’ resource requirements. To generate these percentile distribution metrics (which have a 15-month retention period), follow our documentation. We recommend generating the following metrics:
proc.<NAME_OF_PROCESS>.memory.rss: Bytes of memory used by the process.
proc.<NAME_OF_PROCESS>.cpu.total_pct: Total percentage of CPU used by the process per CPU core (e.g., a value of 200 would indicate that, on average, the process is fully occupying two of the host’s CPU cores).
Note: take into account that these are custom metrics and will be billed as such.
For containers that are running third-party software that is a Datadog integration (e.g., MySQL), these metrics (along with their corresponding percentile aggregations) are generated automatically as part of the integration, and are not considered custom metrics. These autogenerated metrics are called:
datadog.process.per_command.memory.rss
datadog.process.per_command.cpu.total_pct
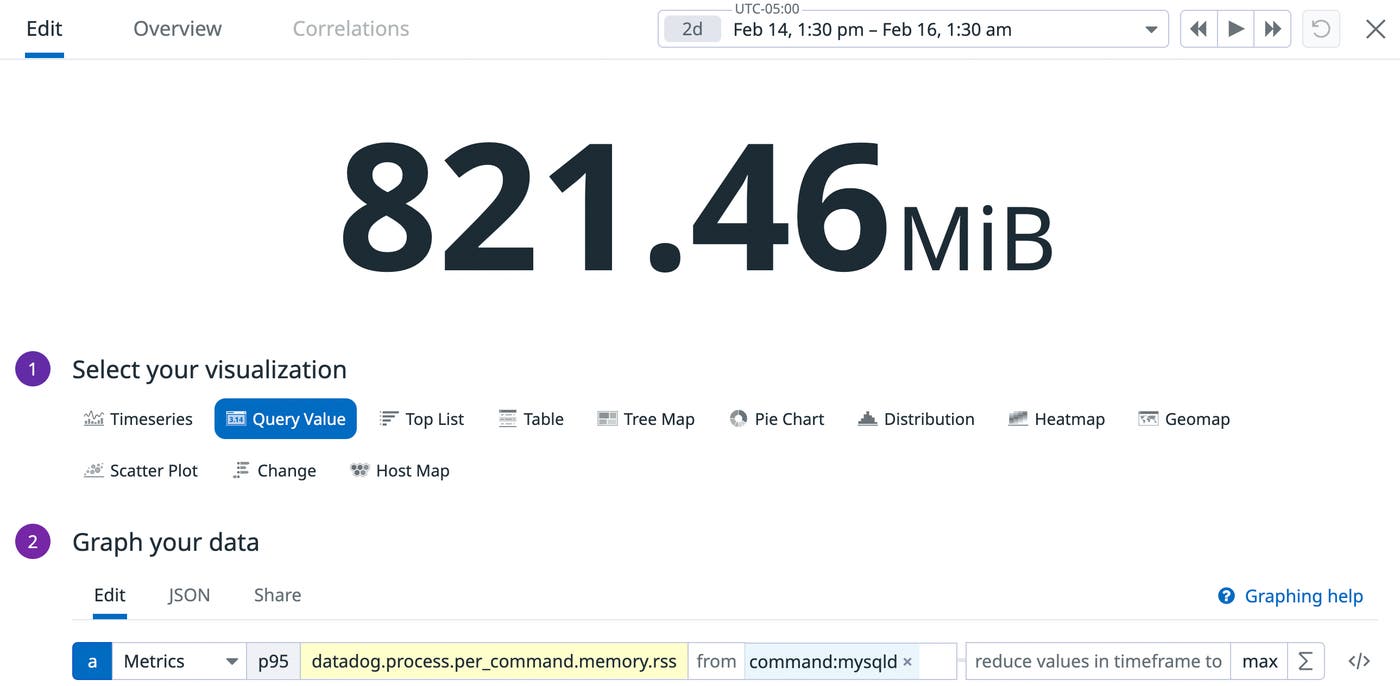
Let’s take a look at an example of a mysql Deployment that we want to resize correctly. We graph the p95 memory usage of all mysqld processes over a period of 36 hours against the memory requested for those containers (750 mebibytes):
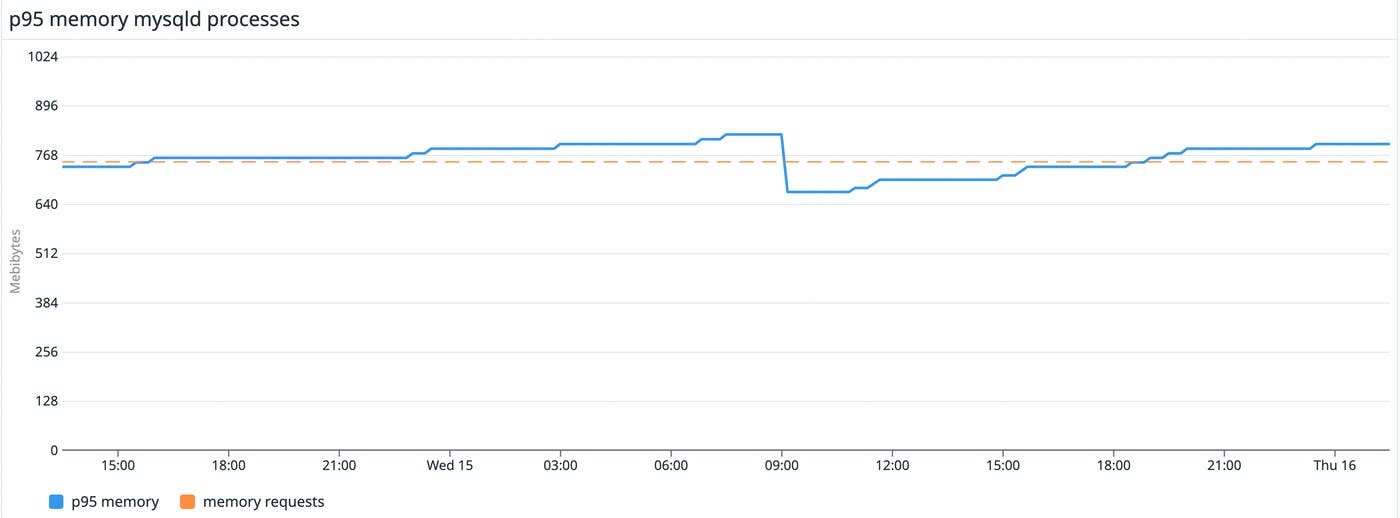
Based on our historical data, we are requesting less than we need, which may cause resource starvation on the node. In this case, we should increase the memory request to the maximum value of that p95 usage: 821 mebibytes.
When defining resources for a container in Kubernetes, there are two values that can be specified: requests and limits. In this post, we have been focusing on requests, but it is also important to discuss limits and how they can affect your pod. In this case, setting limits for CPU has very different implications than setting them for memory, so we are going to discuss those separately. However, both types of limits must always be equal to or greater than the requests.
Note: This section assumes that the kubelet uses CFS quota to enforce CPU limits (default). In a follow-up post, we will cover other CPU Manager policies.
CPU is a compressible resource. This means that its usage can be throttled, which leads to increased application latency but does not cause pod evictions.
The CPU limit defines a hard ceiling on how much CPU time a container can use. During each scheduling interval (time slice), the Linux kernel checks to see if this limit is exceeded; if so, the kernel waits before allowing that cgroup to resume execution.
As explained earlier, the sum of the CPU requests for all containers scheduled on a node will never exceed the capacity of the node. Once they are scheduled, they may get additional CPU time, depending on other containers’ CPU usage on the same node. On average, they’ll always get their requested amount, no matter how busy the node gets.
Let’s walk through two scenarios to see how CPU limits affect scheduling. In the first example, we have a single node with 2 cores of CPU and one pod with one container requesting 1 core. The scheduler will place it on the node, leaving us with only 1 schedulable core:

We now want to deploy a second pod with one container, requesting 0.5 CPU cores. The scheduler is able to place it on the node:

During the next time slice, pod 1 needs to use 0.5 cores and pod 2 another 0.5 cores:
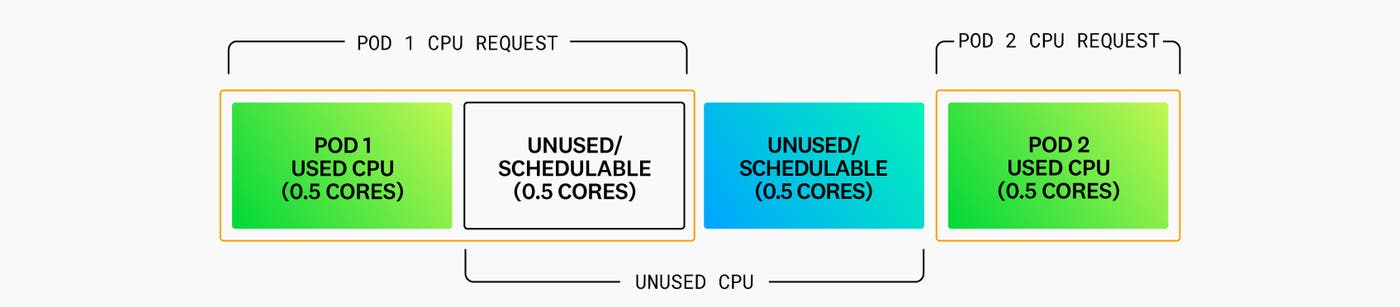
As both pods are using less CPU than they requested, they will both be able to use the CPU they need, regardless of what limits they have set for their containers.
Now, let’s imagine that in the next time slice, the container in pod 1 still only needs 0.5 cores, but the container in pod 2 needs to use 1.5 cores (more than it requested). This is where limits come into play.
Let’s imagine that pod 2 has set 1 core as the limit for its container. It will be able to use more than it requested as long as there are enough CPU cycles available, but only up to its limit:
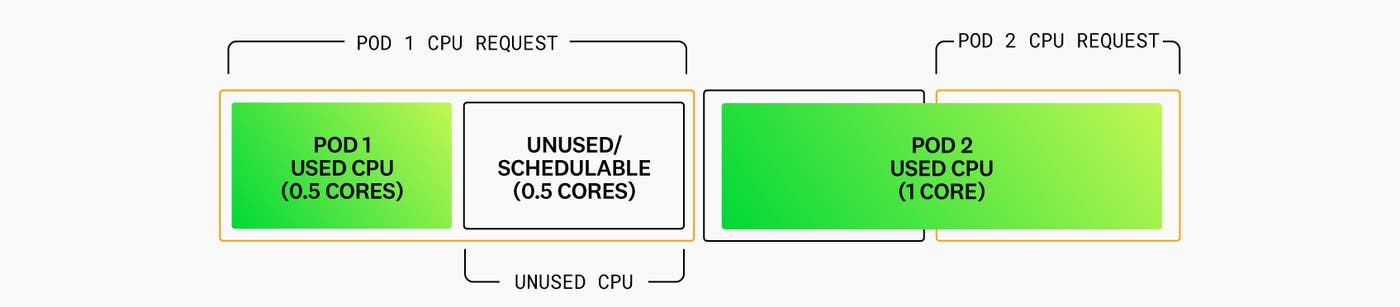
During that slice, pod 2 could have used 1.5 cores, but it will only be able to use 1 core, even though 0.5 cores were sitting idle on the node. This is less than ideal, as it negatively impacts container performance. If it hadn’t set any limits, it would have been able to use all the CPU available on the node (the 1.5 cores it needed).
But if pod 2 hadn’t set any limits, would it have affected pod 1? The answer is that, in most cases, it wouldn’t. Once the containers are running, their CPU requests define weighting, which means that on a contended system, workloads with larger CPU requests are allocated more CPU time than workloads with smaller requests.
So, let’s imagine how the scenario changes if pod 2 has not defined a CPU limit. Because pod 1 is only using 0.5 cores during the first slice, pod 2 is able to use 1.5 cores:
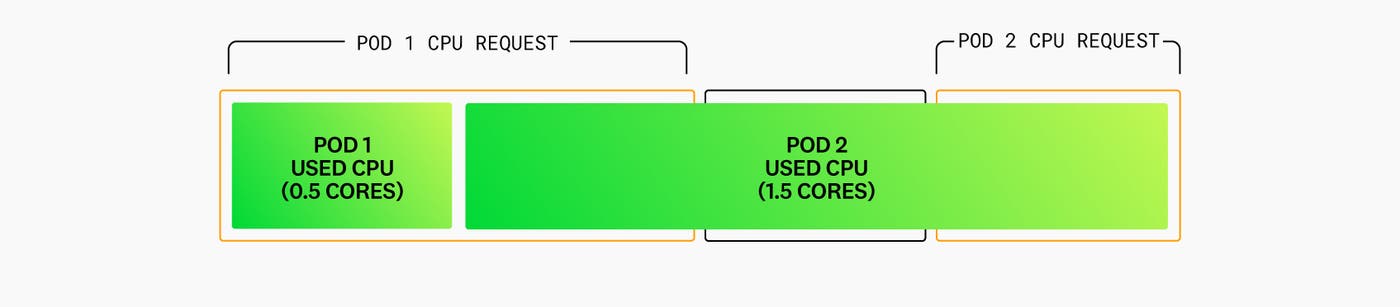
Over the next slice, if pod 1 needs 1 core and pod 2 still needs 1.5 cores, they will need more than the CPU capacity of the node (2 cores). This is where weighting comes into play. As pod 1 requested 1 core and pod 2 only 0.5 cores, pod 2 will be throttled:

In this particular example, pod 2 didn’t have its requests properly set (it needed to use 3x more than it requested). This allowed it to be scheduled on the same node as pod 1, which ultimately meant that pod 2 was heavily throttled.
But if all pods placed on the same node are properly sized and follow the same strategy, and the goal is to maximize CPU usage, it is a good strategy to avoid setting CPU limits. This can help avoid wasting CPU cycles that could be used to improve a container’s performance.
Unlike CPU, memory is an incompressible resource. If a container requests insufficient memory, then its processes will be killed by the kernel when it is unable to satisfy an allocation request or if the container’s limit is exceeded.
Setting limits in addition to requests provides better predictability—especially if limits are equal to requests, thereby avoiding the need to rely on potentially overcommitted resources. However, to avoid out-of-memory conditions and ensure service availability, it is also important to ensure that your limits are high enough.
In this blog post, we have covered how the Kubernetes scheduler works and how it can affect the amount of cloud resources you need to provision. We also shared practical recommendations on how to rightsize your Kubernetes workloads.
These recommendations try to strike a balance between cloud costs and performance, but it is important to note that they only offer general guidance. You will need to take into account the nature of your workloads as well as your business needs when setting resource requests and limits. If your only requirement is lowering costs, you may need to set your requests to a lower percentile (e.g., p75) of CPU and memory usage. In the same vein, if you want to prioritize maximizing performance, you can use a higher percentile (i.e., p99).
In subsequent posts we will cover in greater depth how CPU and memory are managed in Kubernetes and how it can affect your workloads. To get recommendations for specifying CPU requests and limits, see our companion blog post.
Check out our documentation to learn more about monitoring your containers’ resource utilization. If you’re not yet using Datadog, you can start a free trial.
此内容由惯性聚合(RSS阅读器)自动聚合整理,仅供阅读参考。 原文来自 — 版权归原作者所有。