


Bowen Chen
.NET is a framework built by Microsoft that simplifies the complexities of developing cross-platform applications. Using .NET, developers can create powerful applications with rapid response times and more. We’re excited to announce that the Datadog Continuous Profiler now provides general support for .NET applications, including .NET Framework, .NET Core, and .NET 5+. Using Continuous Profiler, you can compare the code performance of your .NET application across different versions, time frames, and environments directly in production, enabling you to identify resource bottlenecks and improve user experience.
In this post, we’ll cover how you can use Continuous Profiler’s flame graph to optimize expensive methods and leverage method-level tracing and profile comparison features to troubleshoot high CPU consumption and latency.
Profiling tools often come with significant latency or CPU overhead since they aim to gather large volumes of information in a short time period and may also initialize with expensive settings. However, for .NET, Datadog’s Continuous Profiler has been fine-tuned to continuously collect application data in frequent sampling intervals without changing the .NET runtime behavior. This drastically reduces operational overhead and ensures that you get full visibility into application code performance even in high-scale production environments. When a production issue occurs, you’ll be able to investigate directly; that means you won’t need a separate environment to reproduce and troubleshoot the problem. Additionally, several factors such as the load, data format, security, and configuration of your production environment may be difficult to reproduce in testing.
If you already collect .NET traces with Datadog APM, no installation is required—just enable profiling for your organization. Otherwise, start by installing Datadog tracing for either .NET Core, .NET 5+, or .NET Framework on your machines or directly in your applications. You can then navigate to Profiles in APM to begin analyzing profiled services.
If you notice your .NET application performance indicators begin to lag after deploying changes, profiles can be the next step in diagnosing the underlying issue. For example, our application buggybitsservice exhibits prolonged CPU time following a recent deployment (shown below). Using the Continuous Profiler’s “Compare” tab, we can compare the current lagging service code (profile B) with the profile prior to the period of impact (profile A). The table view automatically lists methods with the greatest magnitude of change at the forefront, enabling you to quickly identify potential sources of error.
The Continous Profiler’s compare function isn’t limited to just time periods—you can also compare your .NET profiles using any combination of tags. This enables you to compare against different versions, environments (such as production and staging), data centers, Kubernetes pods, and more. Datadog will automatically discover and import available labels and environment variables as tags, but you can also assign custom tags to increase the dimensions of your service data.
Going back to our example, we can see that profile A is spending nearly 10 times as long (3.77 seconds) executing method DataLayer.ApplyDiscount compared to profile B and is also spending significant time in the Number.ThrowOverflowFormatException method.
Using these context clues, we can pivot our investigation to our profiles’ “Thrown Exceptions” and query for our specific service. We can see below that buggybitsservice is throwing over 1000 exceptions, almost all from the method DataLayer.ApplyDiscount. Looking at the exception messages on the right-side panel shown below, we can gain insight into why the exception was raised. In this case, it’s possible that our application misses some edge cases when parsing input strings related to prices. However, what’s most important to solving the performance issue is not necessarily the type or the message of exceptions but understanding why the exceptions were raised and how to remediate them.
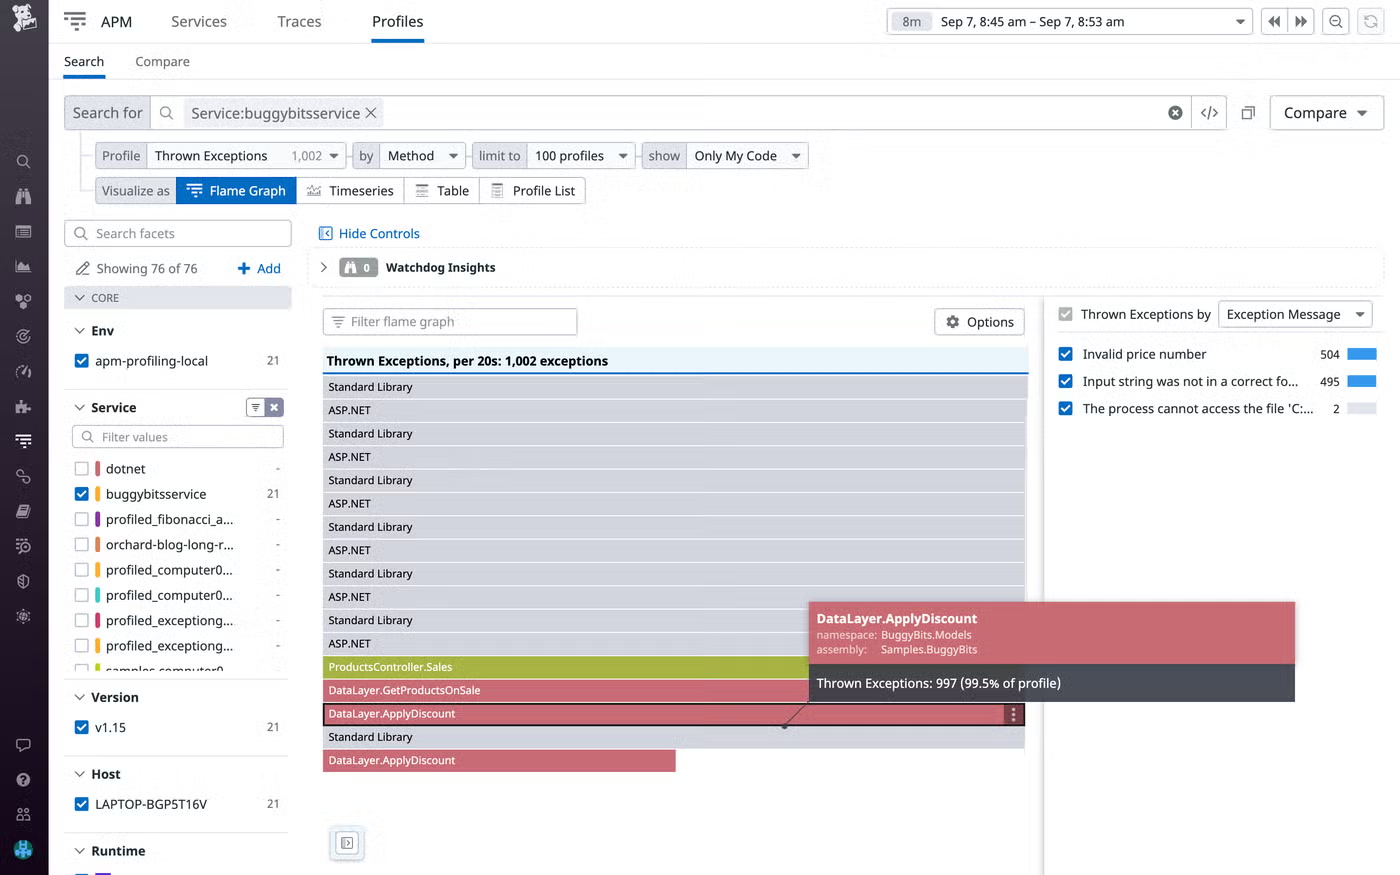
Now that we’ve narrowed our issue down to a specific method, we can dive into the application code. Below is the code for our current (lagging) profile:
public void ApplyDiscount(Product product)
{
try {
var price = double.Parse(product.Price, System.Globalization.NumberStyles.AllowDecimalPoint, System.Globalization.CultureInfo.InvariantCulture);
if (price < 200) {
product.Price = (price * 0.75).ToString();
}
}
catch (System.FormatException) {
throw new PriceException(product.Price, "Invalid price number");
}
}
public List <Product> GetProductsOnSale()
{
var allProducts = new List<Product>(10000);
for (int i = 0; i < 10000; i++) {
var product = GetProduct(i);
try {
ApplyDiscount(product);
allProducts.Add(product);
}
catch (PriceException) { continue; }
}
return allProducts;
}
To compute the variable price value, our code calls the double.Parse method, which will throw a FormatException if the input string has an incorrect number format (e.g., using ‘,’ instead of ‘.’ as a decimal separator). Our code then catches these exceptions and throws a new custom PriceException.
Since we want to drastically reduce the amount of time buggybitsservice spends in this method, we need to find a way to handle these errors without throwing exceptions.
Looking at our new implementation of our ApplyDiscount method shown below, we return a boolean flag instead of throwing an exception. Our new method invokes TryParse instead of Parse—TryParse does not throw an exception when a parsing error is detected.
public bool TryApplyDiscount(Product product)
{
double price;
if (double.TryParse(product.Price, System.Globalization.NumberStyles.AllowDecimalPoint, System.Globalization.CultureInfo.InvariantCulture, out price)) {
if (price < 200) {
product.Price = (price * 0.75).ToString();
}
return true;
}
return false;
}
public List<Product> GetProductsOnSaleEx()
{
var allProducts = new List<Product>(10000);
for (int i = 0; i < 10000; i++) {
var product = GetProduct(i);
if (TryApplyDiscount(product)) {
allProducts.Add(product);
}
}
return allProducts;
}
With our new application code in place, we can return to the Continuous Profiler “Compare” page to test its performance. Our CPU time (profile B) has returned to normal levels (1.84 seconds), and the new TryApplyDiscount method runs in 248 ms as opposed to the prior lagging ApplyDiscount method that ran in 3.77 seconds.
During testing, our exception-based code performed well under unit tests, end-to-end tests, and within a staging environment; however, once it was deployed to production, the high volume of exceptions raised by user requests flooded our application and heavily impacted its CPU utilization. Using the Continuous Profiler, we were able to quickly find and resolve the production issue, saving valuable resources while enhancing the performance of our application.
When attempting to identify the source of an issue, different warning cues can often point to the same source. For example, we might have first been notified of an ongoing impact to buggybitsservice when observing spikes in its latency.
To troubleshoot high latency, we can begin by analyzing buggybitsservice traces in APM. By inspecting a slow trace, you can break it down into individual method-level calls. With distributed tracing and profiling enabled, Datadog will automatically identify slow traces in the “Code Hotspots” tab and highlight the methods within your span and their corresponding durations. You can then select an expensive method to follow its reverse stack trace to identify the source of a bottleneck.
Using Code Hotspots, you can quickly troubleshoot lagging methods to ensure fast turnaround times and quick incident resolution. In the example below, the code hotspot in our trace highlights that the ApplyDiscount method takes 1.34 seconds out of the total 1.50 second duration. This leads to the exceptions issue that we previously troubleshot.
Datadog’s Continuous Profiler enables you to compare .NET application performance results between different time frames and versions and pinpoint specific lines of code degrading performance. To begin identifying bottlenecks and improving your .NET application’s user experience, you can install Datadog’s tracing libraries and enable profiling for your application today. Our profiler supports all languages targeting the .NET runtime, such as C#, F#, and Visual Basic, to give you deep visibility for all infrastructures. If you aren’t already a Datadog customer, get started with a free 14-day trial.
此内容由惯性聚合(RSS阅读器)自动聚合整理,仅供阅读参考。 原文来自 — 版权归原作者所有。