












This post is part 2 of a 3-part series on monitoring the health and performance of the Windows operating system. Part 1 details key Windows performance counters, events, and services to monitor; this post covers data collection with native tools; and Part 3 explains how to monitor Windows with Datadog. For an in-depth webinar and Q&A session based on this series, check out this slide deck and video.
Windows offers a number of native tools to collect all of the metrics and events mentioned in part 1 of this series. In many cases, Windows offers more than one tool for the task. In this post, we will cover a few ways to access Windows metrics and performance data, using the tools that come bundled with Windows Server 2012.
Though there are many tools built into Windows Server 2012 for monitoring system health and performance, we will focus on a limited subset in this article.
Non-GUI tools:
GUI tools:
Powershell is one of the most dynamic and powerful ways to get information about a Windows system (and, with Powershell available on other platforms, other systems as well).
Powershell commands are referred to as cmdlets, and follow a strict Verb-Noun naming convention. For example, Remove-Item is functionally similar to rm on Unix-like systems. A Powershell tutorial is beyond the scope of this article, but Microsoft has tutorials for the uninitiated.
All of the metrics and events listed in part one of this series can be collected with Powershell:
Part of the, er, power of collecting metrics with Powershell is that you can choose between real-time performance data for spot-checking, or sampling metric values over time for historical trending (by using the -MaxSamples and -SampleInterval command line arguments).
Collecting performance metrics with Powershell using the Get-Counter cmdlet follows a straightforward syntax:
Get-Counter -Counter <Counter Class>\<Property Name>
If you’re unsure of a property name, you can retrieve a list of all properties by class with the following:
(Get-Counter -ListSet <Counter Class> ).Paths
For example, this command will display all of the properties of the Memory class:
(Get-Counter -ListSet Memory).Paths
| Property Name | Command |
|---|---|
| PercentProcessorTime | Get-Counter -Counter “\Processor(*)% Processor Time” |
| ContextSwitchesPersec | Get-Counter -Counter “\Thread(_Total)\Context Switches/sec” |
| ProcessorQueueLength | Get-Counter -Counter “\System\Processor Queue Length” |
| DPCsQueuedPersec | Get-Counter -Counter “\Processor(*)\DPCs Queued/sec” |
| PercentPrivilegedTime | Get-Counter -Counter “\Processor(*)% Privileged Time” |
| PercentDPCTime | Get-Counter -Counter “\Processor(*)% DPC Time” |
| PercentInterruptTime | Get-Counter -Counter “\Processor(*)% Interrupt Time” |
| Property Name | Command |
|---|---|
| AvailableMBytes | Get-Counter -Counter “\Memory\Available MBytes” |
| CommittedBytes | Get-Counter -Counter “\Memory\Committed Bytes” |
| PoolNonpagedBytes | Get-Counter -Counter “\Memory\Pool Nonpaged Bytes” |
| PageFaultsPersec | Get-Counter -Counter “\Memory\Page Faults/sec” |
| PageReadsPersec | Get-Counter -Counter “\Memory\Page Reads/sec” |
| PagesInputPersec | Get-Counter -Counter “\Memory\Pages Input/sec” |
| PercentUsage | Get-Counter -Counter “\Paging File(*)% Usage” |
| Property Name | Command |
|---|---|
| PercentFreeSpace | Get-Counter -Counter “\LogicalDisk(*)% Free Space” |
| PercentIdleTime | Get-Counter -Counter “\LogicalDisk(*)% Idle Time” |
| AvgDisksecPerRead | Get-Counter -Counter “\LogicalDisk(*)\Avg. Disk sec/Read” |
| AvgDisksecPerWrite | Get-Counter -Counter “\LogicalDisk(*)\Avg. Disk sec/Write” |
| AvgDiskQueueLength | Get-Counter -Counter “\LogicalDisk(*)\Avg. Disk Queue Length” |
| DiskTransfersPersec | Get-Counter -Counter “\LogicalDisk(*)\Disk Transfers/sec” |
| CacheBytes | Get-Counter -Counter “\Memory\Cache Bytes” |
| Property Name | Command |
|---|---|
| BytesSentPersec | Get-Counter -Counter “\Network Interface(*)\Bytes Sent/sec” |
| BytesReceivedPersec | Get-Counter -Counter “\Network Interface(*)\Bytes Received/sec” |
| SegmentsRetransmittedPersec | Get-Counter -Counter “\TCPv4\Segments Retransmitted/sec” |
You can also query the event log with Powershell. The query follows this format:
Get-EventLog -LogName <Name of log> `
-EntryType <Information|Warning|Error|SuccessAudit|FailureAudit> `
-After <MM/DD/YYYY> | Where-Object {$_.EventID -eq <EventID>} `
| Format-List
This query invokes the Get-EventLog cmdlet, with the log name, entry type, and start date as parameters. The output of that cmdlet is piped to Where-Object, a cmdlet that filters the piped value ($_) for objects whose EventIDs (.EventID) are equal to (-eq) the EventID we are searching for. The output is finally piped to Format-List which prints the output in a human-readable format.
For example, this query will show all security audit failure events with EventID 4625 (failed logon) from the Security log which occurred after 10/18/2016:
Get-EventLog -LogName Security -EntryType FailureAudit -After 10/18/2016 | Where-Object {$_.EventID -eq 4625} | Format-List
Category : (12544)
CategoryNumber : 12544
ReplacementStrings : {S-1-0-0, -, -, 0x0...}
Source : Microsoft-Windows-Security-Auditing
TimeGenerated : 10/19/2016 3:21:32 PM
TimeWritten : 10/19/2016 3:21:32 PM
UserName :
Index : 1305543
EntryType : FailureAudit
InstanceId : 4625
Message : An account failed to log on.
Subject:
Security ID: S-1-0-0
Account Name: -
Account Domain: -
Logon ID: 0x0
Logon Type: 3
Account For Which Logon Failed:
Security ID: S-1-0-0
Account Name: MATT
Account Domain:
Failure Information:
Failure Reason: %%2313
Status: 0xc000006d
Sub Status: 0xc0000064
All of the services listed in part one of this series can be collected via Powershell. The query follows this format:
Get-Service | where {$_.DisplayName -eq "Windows Update"}
The above command displays the status of the Windows Update service:
Status Name DisplayName
------ ---- -----------
Stopped wuauserv Windows Update
Windows Management Instrumentation (WMI) is a set of extensions that provide a standardized interface through which instrumented components can be queried for information. WMI was introduced to make management of Windows computers easier, by providing a consistent interface across OS versions, while working alongside other popular management interfaces like SNMP or Desktop Management Interface (DMI).
The introduction of Powershell (and the Get-WmiObject cmdlet specifically) has made WMI much easier to use. Before, accessing system information via WMI required some boilerplate in VBScript or another scripting language. But with Powershell, WMI can be queried in one line.
If you’re just getting started with Windows monitoring, Powershell is generally a simpler way to access performance metrics. But since WMI is still in widespread use, we’ve included the equivalent WMI commands here for completeness. You can get started with iterating through all of the available WMI Classes by opening up a Powershell window and running the following:
$name = "Win32_perfformatteddata"
$WMIClasses = Get-WmiObject -List | Where-Object {$_.name -Match $name}
foreach($class in $WMIClasses)
{
$class.Name
}
Executing the above commands will result in substantial output, truncated and reproduced below:
[...]
Win32_PerfFormattedData_PerfDisk_LogicalDisk
Win32_PerfFormattedData_PerfDisk_PhysicalDisk
Win32_PerfFormattedData_PerfNet_ServerWorkQueues
Win32_PerfFormattedData_PerfOS_Cache
Win32_PerfFormattedData_PerfOS_Memory
Win32_PerfFormattedData_PerfOS_Objects
Win32_PerfFormattedData_PerfOS_PagingFile
Win32_PerfFormattedData_PerfOS_Processor
Win32_PerfFormattedData_PerfOS_System
You may recognize some of the names from Powershell commands, like Win32_PerfFormattedData_PerfDisk_LogicalDisk. To list performance counters for the entire LogicalDisk class, you can run a command like:
Get-WmiObject -Query "Select * from Win32_perfformatteddata_perfdisk_LogicalDisk"
which will output counters for all logical disks on the server:
[...]
AvgDiskBytesPerRead : 0
AvgDiskBytesPerTransfer : 0
AvgDiskBytesPerWrite : 0
AvgDiskQueueLength : 0
AvgDiskReadQueueLength : 0
AvgDisksecPerRead : 0
AvgDisksecPerTransfer : 0
AvgDisksecPerWrite : 0
AvgDiskWriteQueueLength : 0
CurrentDiskQueueLength : 0
DiskBytesPersec : 0
DiskReadBytesPersec : 0
DiskReadsPersec : 0
DiskTransfersPersec : 0
DiskWriteBytesPersec : 0
DiskWritesPersec : 0
FreeMegabytes : 100400
Name : C:
PercentDiskReadTime : 0
PercentDiskTime : 0
PercentDiskWriteTime : 0
PercentFreeSpace : 77
PercentIdleTime : 96
The table below lists the WMI queries to collect all of the metrics from part one of this series.
| Metric Class | Query |
|---|---|
| CPU | Get-WmiObject -Query “Select * from Win32_perfformatteddata_perfos_processor”Get-WmiObject -Query “Select * from Win32_perfformatteddata_perfproc_thread” |
| Memory | Get-WmiObject -Query “Select * from Win32_perfformatteddata_perfos_memory”Get-WmiObject -Query “Select * from Win32_perfformatteddata_perfos_pagingfile” |
| Disk | Get-WmiObject -Query “Select * from Win32_perfformatteddata_perfdisk_logicaldisk”Get-WmiObject -Query “Select * from Win32_perfformatteddata_perfos_memory” |
| Network | Get-WmiObject -Query “Select * from Win32_perfformatteddata_tcpip_networkinterface”Get-WmiObject -Query “Select * from Win32_perfformatteddata_tcpip_tcpv4” |
Polling for performance data with WMI or Powershell is good for collecting data with scripts or other automated means. But without some means of visualizing that data, it can be hard to spot trends and issues from a sea of numbers.
Windows Performance Monitor provides a built-in interface for graphing performance counters, either in real-time or from logs of historical data. You can graph data from both local and remote hosts, as well. Performance counters are organized by class and have human-readable names as well as detailed metric descriptions.
Windows Resource Monitor is very similar to the well-known task manager, but differs in the amount of information it makes available. The resource monitor is a very good starting point for investigation; it can surface nearly all of the metrics listed in part one of this series. Its main strength is that it provides a real-time graphical interface to access CPU, memory, disk, and network metrics, allowing you to see at a glance which particular process is hogging the disk, for example.
Windows Reliability Monitor is a graphical interface that surfaces system events and organizes them chronologically and by severity.
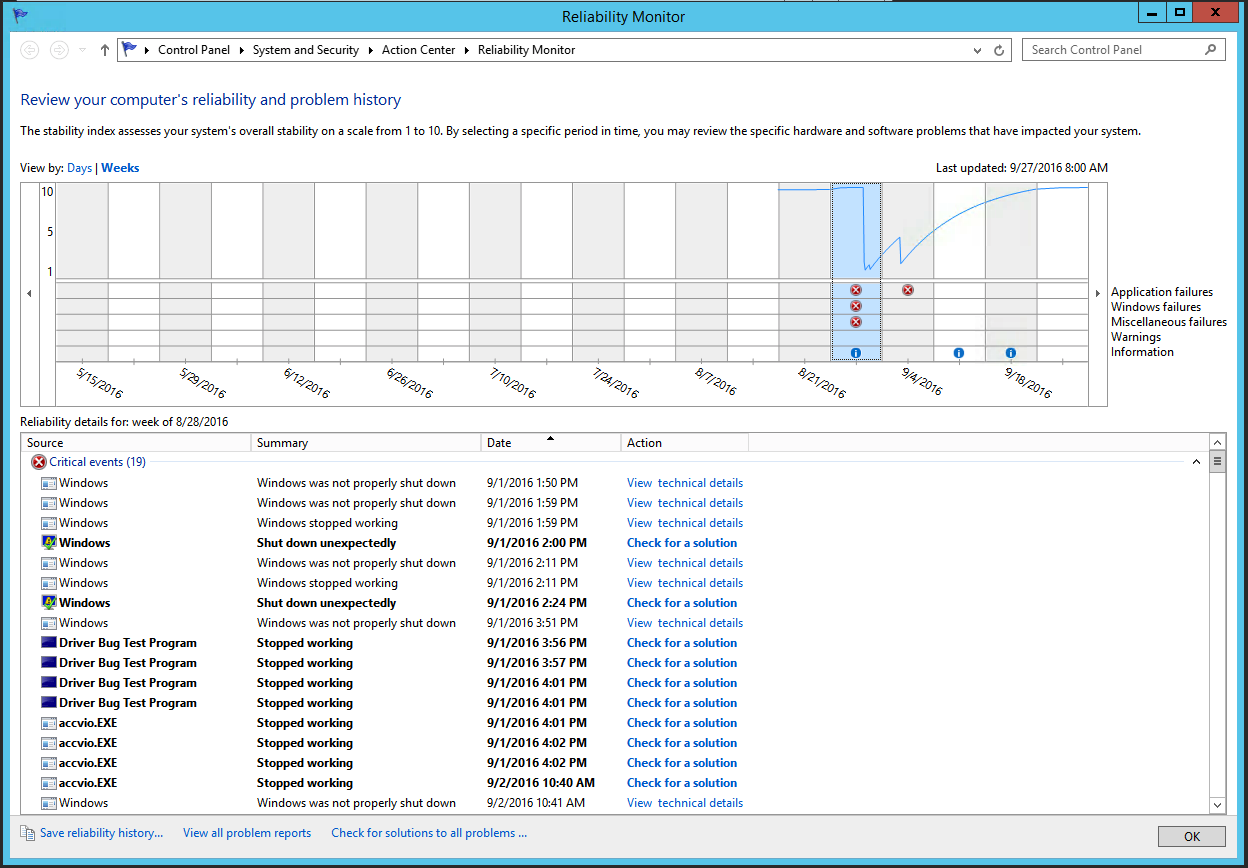
From this list view, you can right-click a specific event and check for a solution to the issue, view a solution to the issue, or view technical details for more information on the state of the system at the time of the event. Selecting “View technical details” will display more detailed information on the issue, like problem event name, where the error occurred, and more.
Selecting “Check for a solution” will prompt you to send details of the event to Microsoft for analysis. If you’re lucky, your problem may have a known solution and “View solution” will no longer be grayed out; clicking it will open the solution (on Microsoft’s website) in your browser.
The Services management snap-in (services.msc) is an indispensable tool that provides administrators with a graphical interface to monitor and manage services on Windows machines.
With sortable rows, you can see at a glance the state, startup type, and execution privileges of all services on your system.
Right-clicking on any service and selecting Properties will give you more detail on the selected service, including a list of its dependencies and the services that depend on it.
Last but not least, you can also set alerts on service failure by selecting the Recovery tab and changing First, Second, or Subsequent failure actions to “Run a Program” and setting the program to an email script or other response.
Like the reliability monitor, Server Manager surfaces information from disparate sources, all in a single pane.
With Server Manager, you can access a high-level overview of resource consumption, service status, and events, aggregating information from both local and remote hosts.
Also included in Server Manager is the Windows Server Best Practices Analyzer. Windows Server Best Practices Analyzer (BPA) is a tool unique to Windows Server 2008 R2 and Windows Server 2012 R2. BPA analyzes the roles enabled on your host, and provides recommendations based on Windows server management best practices. It can identify issues with configuration, security, performance, policies, and more.
On a local machine, the venerable task manager provides immediate access to a view of what’s going on under the hood. In addition to a list of running processes, the task manager also includes tabs with more information on hardware performance and running services.
In the same vein as the Task Manager is Process Explorer, a third-party tool in the versatile Sysinternals Suite. Since it is not included in Windows Server 2012, we won’t go into too much detail here. However, it is worth mentioning as a more full-featured alternative to the built-in Task Manager.
Some of its noteworthy features include:
In this post we’ve covered several ways of surfacing Windows Server 2012 R2 metrics, events, and service information using simple, lightweight tools already available on your system.
For monitoring production systems, you will likely want a dynamic solution that not only ingests Windows Server performance metrics, but metrics from every technology in your stack.
At Datadog, we’ve developed integrations with more than 1,000 technologies, including Windows, so that you can make your infrastructure and applications as observable as possible.
For more details, check out our guide to monitoring Windows Server 2012 R2 performance metrics with Datadog, or get started right away with a free trial.
此内容由惯性聚合(RSS阅读器)自动聚合整理,仅供阅读参考。 原文来自 — 版权归原作者所有。