






While overprovisioning Kubernetes workloads can provide stability during the launch of new products, it’s often only sustainable because large companies have substantial budgets and favorable deals with cloud providers. As highlighted in Datadog’s State of Cloud Costs report, cloud spending continues to grow, but a significant portion of that cost is often due to inefficiencies like overprovisioning. That’s why for most companies, proper resource provisioning and autoscaling play crucial roles in keeping costs down and helping the product respond to traffic spikes.
The Kubernetes built-in Horizontal Pod Autoscaler (HPA) scales based on a single target threshold. At Datadog, we built the open source Watermark Pod Autoscaler (WPA) controller to extend the HPA, allowing for more flexibility by introducing high and low watermarks for scaling decisions and more fine-grained control over autoscaling behavior.
In this post, we’ll take a look at how the WPA helps you keep your cloud spend under control by managing scaling policies and simulating actions before deployment. For a more detailed guide on scaling your Kubernetes workloads and clusters, check out our blog post.
But first, we’ll cover some important provisioning principles we learned while implementing the WPA.
High resource utilization is essential prior to setting up autoscaling. As we were setting up the WPA for one of our own internal query engines, we realized we had overprovisioned worker pods. Our investigation revealed these pods were only seeing 10 percent CPU utilization during peak hours, making it difficult to determine when the pods were actually under load.
In order to achieve high utilization, we gradually decreased the CPU cores per pod in 10 percent increments, closely monitoring performance to maintain high utilization without sacrificing latency. This process allowed us to reduce CPU cores per pod by 40 percent, leading to higher utilization and a savings of ~$30k per month prior to setting up the autoscaler.
Similar to vertical provisioning, horizontal provisioning should come before autoscaling and can be done incrementally. By gradually adjusting the number of pods and evaluating workload distribution, you can find the optimal balance between resource allocation and performance.
We ran numerous A/B tests in our data centers to determine how scaling down vertically or horizontally would affect our cluster performance. As an example, running one zonal cluster with 15 pods, one at 12, and one at 10 allowed us to compare latency changes. These A/B tests are invaluable for determining the optimal minimum and maximum replica counts that your autoscaler should adjust to. Typically, services reach a point of diminishing returns, where adding more pods no longer improves performance—such as reducing latency—but only increases costs. Similarly, these tests help identify the minimum number of replicas required before performance degradation occurs.
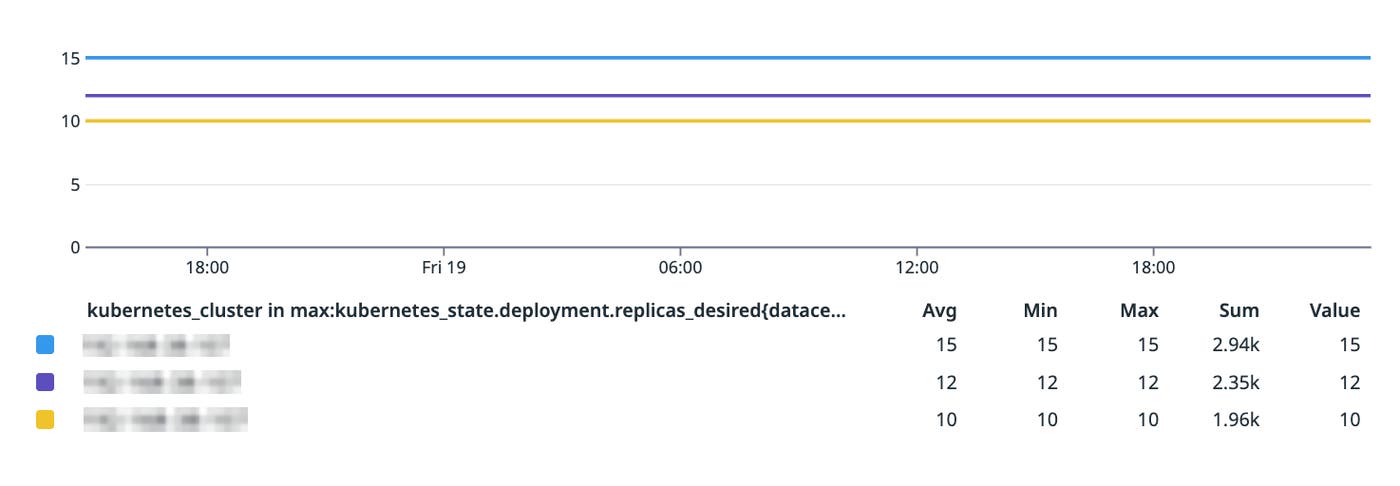
This latency comparison offers two points to consider during the provisioning stage.
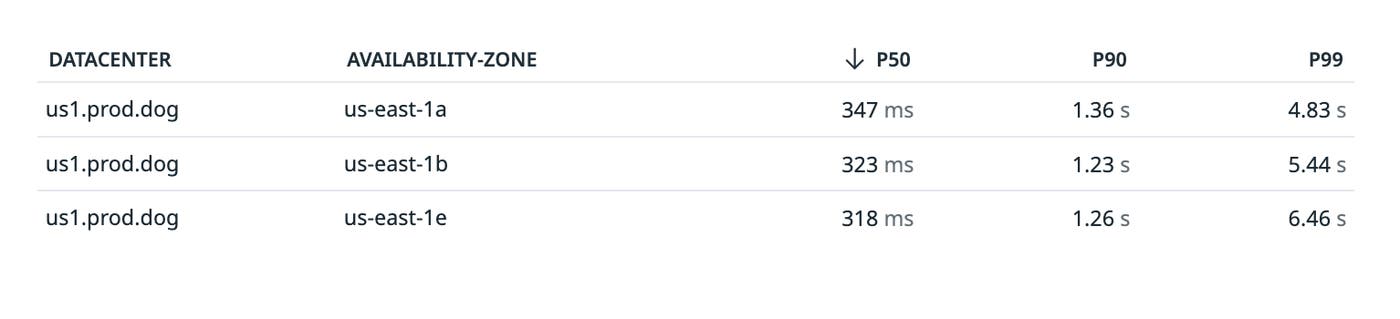
The first is to identify your service level objectives (SLOs). For example, you may want the p99 latency to be less than five seconds or each pod to handle 600 requests per second. This can help you identify your range for a steady state and will guide your autoscaling configuration decisions for scaling delays and velocity (which we’ll talk about later).
If your service is very expensive and you want to squeeze out as much efficiency as possible, the next step may be to load test your service. Load testing shows you how quickly performance falls off during times of high stress, which is useful for calculating an efficiency ratio. In other words, how much traffic does an extra CPU core or gigabyte of memory buy you? This can also help determine a minimum and maximum bound for the number of pods in your cluster.
Lastly, prior to autoscaling it’s important to figure out your cloud spend to establish a baseline. We used internal metrics to determine our hourly price per pod, but Datadog Cloud Cost Management provides out-of-the-box tooling to determine any service’s costs.
The principles of vertical and horizontal provisioning apply to scaling as well. Vertical scaling increases resources (CPU, memory, etc.) for a single pod, while horizontal scaling adds more pods to distribute the workload across nodes. In this post, we’ll primarily focus on horizontal scaling, as it was the key requirement for our service. Not every workload benefits from autoscaling, so it’s important to determine whether it’s the right choice for your specific needs.
Before implementing autoscaling, ask the following:
Does your workload experience fluctuating or unpredictable traffic patterns? If traffic surges are frequent but short-lived, autoscaling can prevent overprovisioning and wasted resources.
Is your application sensitive to delays caused by scaling up? If immediate response times are critical, autoscaling may need to be paired with other optimizations such as preloaded caches, rate limiting, or scheduled scaling.
Are you consistently seeing high resource utilization (CPU, memory)? Low utilization may indicate overprovisioning, signaling that autoscaling could help reduce costs.
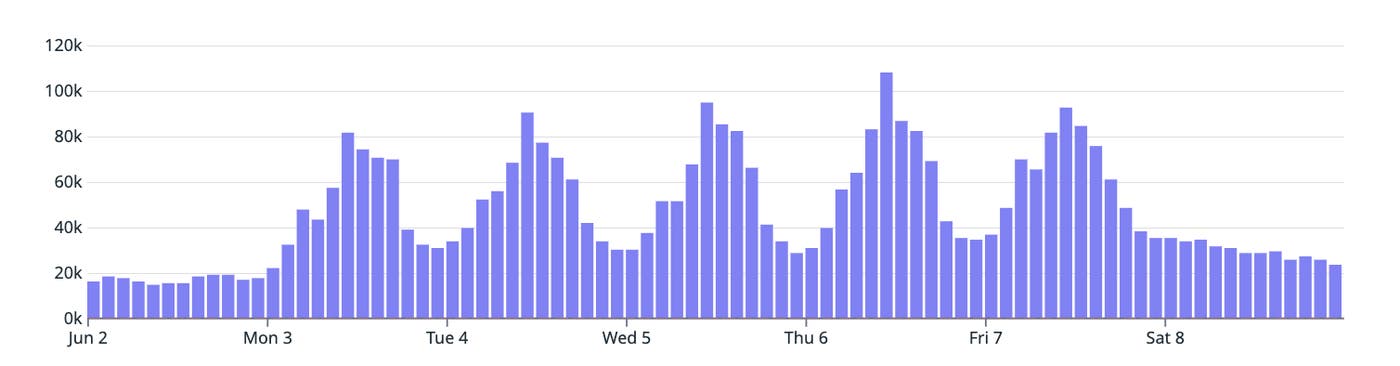
Below is an example chart that we used to determine autoscaling was the right choice for our workload. Notice the traffic surges during peak hours, followed by lower demand periods; this pattern made static provisioning inefficient and wasteful. This chart matches expected behavior, as customers use the product mostly during business hours and less so at nights and on weekends.
Selecting the right metric is fundamental for effective autoscaling. There are two main types of metrics to consider: container metrics, such as CPU, memory usage, and network load that directly reflect workload resource needs, and custom metrics, like queue length, request latency, or database transaction time for more precise control over specialized applications.
We found that some metrics took longer to show workload stress than others. For example, CPU utilization might show a traffic spike 15 seconds later than request queue size. We opted for using the length of our request queue as our scaling metric. It’s important to remember that scaling decisions involve cascading steps—the Datadog Agent has to pick up the new metric, intake it, and then spin up new pods—which can take minutes, so finding a proactive metric is ideal.
The WPA can bake in your scaling metric during deployment or reference an externally deployed metric. We referenced an external metric for more granular configurations—check out this post on autoscaling workloads to learn more about how to set up external metrics. While it’s possible to use multiple metrics for scaling, it is not recommended because it can introduce complexity and inefficiency. For example, relying on different metrics for scaling up and down can lead to conflicting scaling decisions, and external dependencies can distort metrics, making scaling less predictable. It’s generally more efficient to scale based on a single, well-defined metric, like CPU utilization, and adjust scaling parameters to control behavior.
Once you understand your metrics, it’s time to set up the autoscaler itself. The first key decisions to make are what kind of autoscaler you want to use—WPA or HPA—and how you want to scale—by cluster or data center. In general, the HPA is well-suited for predictable scaling needs while the WPA is better for handling erratic traffic patterns. If you need a wider range of thresholds and more granular control over your scaling configurations, the WPA is the recommended choice.
Depending on your infrastructure, you will need to decide whether to scale individual clusters or scale workloads across multiple data centers. The latter is beneficial for high availability and fault tolerance but can introduce more complexity in scaling decisions.
Next, you can jump into writing Terraform. Implementing the WPA in Terraform is easy and allows you to manage scaling policies in a consistent, templated manner. Terraform simplifies scaling configurations and enables you to manage autoscalers across environments.
apiVersion: datadoghq.com/v1alpha1
kind: WatermarkPodAutoscaler
metadata:
name: {{ template "workload.name" . }}
namespace: {{ $.Release.Namespace }}
spec:
scaleTargetRef:
apiVersion: apps/v1
kind: Deployment
name: {{ template "workload.name" . }}
minReplicas: {{ .Values.server.autoscaling.minReplicas }}
maxReplicas: {{ .Values.server.autoscaling.maxReplicas }}
tolerateZero: true # Tolerate our Datadog Metric being zero (queue length is zero)
downscaleForbiddenWindowSeconds: 1200 # 20min
upscaleForbiddenWindowSeconds: 60 # 1min
scaleDownLimitFactor: 10
scaleUpLimitFactor: 100
dryRun: {{ $.Values.server.autoscaling.dryRun }}
replicaScalingAbsoluteModulo: 1
metrics:
- external:
highWatermark: "10"
lowWatermark: "5"
metricName: "datadogmetric@{{ $.Release.Namespace }}:{{ printf "%s-queue-length" $.Values.trino_cluster }}"
metricSelector:
matchLabels:
app: {{ template "workload.name" . }}
datacenter: {{ $.Values.global.datacenter.datacenter }}
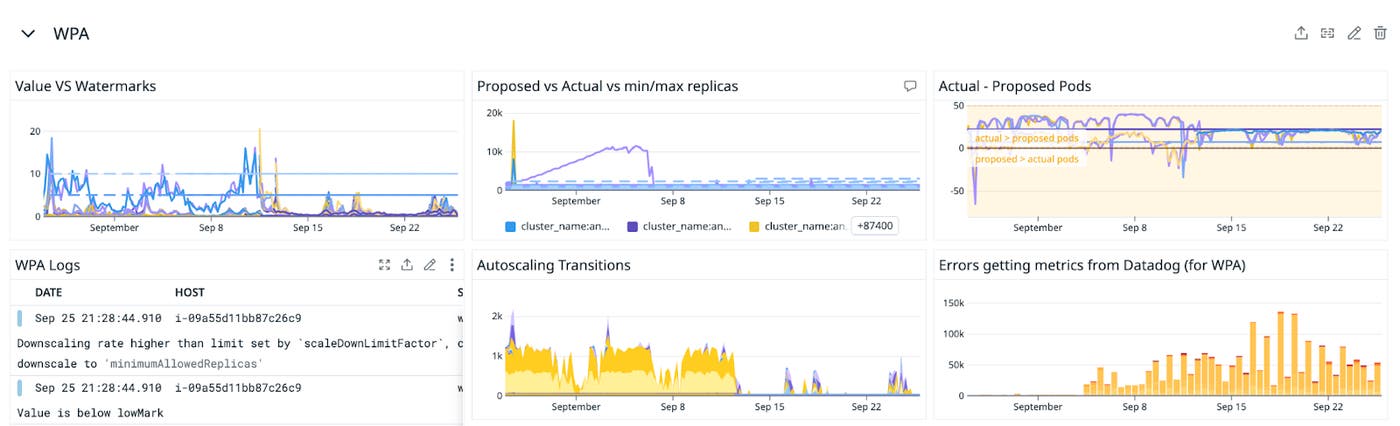
It’s recommended to start the WPA in dryRun mode, which lets you simulate scaling actions based on metrics without actually modifying your infrastructure. This is a useful feature for testing how your autoscaler will react to different conditions such as sudden traffic spikes, before rolling it out in production. This also provides adequate data to build out and tune dashboards, monitors, and other alerting systems. The WPA in dryRun mode emits wpa_controller_replicas_scaling_proposal and wpa_controller_replicas_scaling_effective metrics, which are useful for determining scaling velocity and how your metric affects the autoscaler. A sample dashboard shown below includes widgets we found useful:
Prior to letting your autoscaler loose in production, it’s important to ensure that monitoring and alerting are in place. It’s essential to monitor your autoscaler’s performance to detect potential issues early, which includes setting up alerts for abnormal scaling behaviors or failures. You should also know when metrics stop emitting, as autoscalers might stop working as expected. In such cases, fallback configurations should be in place, such as relying on a minimum replica count.
Additionally, we found it useful to build out runbooks for turning on and off the autoscaler. This can be done with the kubectl CLI tool by turning dryRun back on. These commands can be strung together in a bash script to disable or enable autoscalers across all your clusters at once:
kubectl patch wpa <WPA_NAME> --type='json' -p='[{"op": "replace", "path": "/spec/dryRun", "value":true}]'
As a note, the WPA will not perform any scaling actions when metrics aren’t received. It is often recommended to build uptime monitors for whichever metric the autoscaler is using. Datadog Workflow Automation can also be a great remediation tool if the WPA or metrics start to fail. As an example, if your metric stops reporting data you can prompt an engineer and scale all pods up to the maxReplica until the metric starts reporting again.
While using dryRun metrics provides valuable insights into how the system would behave under load, these metrics alone aren’t a perfect substitute for having the WPA fully enabled. As long as you start with conservative configurations, it’s best to enable WPA and start tuning rather than using dryRun for weeks on end.
After setting up your autoscaler, continuous tuning is necessary to optimize it. Tuning the autoscaler is an iterative process aimed at optimizing both cost efficiency and cluster performance. To achieve this, several key areas must be considered.
The first is scaling velocity, which refers to how quickly your system scales up or down. It’s important to maintain balance, as scaling too quickly may result in overprovisioning, while scaling too slowly can hinder performance. This is controlled by the scaleUpLimitFactor and scaleDownLimitFactor parameters. For more detailed information on how these parameters work in the scaling algorithm, refer to the official WPA GitHub page.
The second consideration is scaling speed. A common best practice is to scale up fast and scale down slowly, allowing the system to handle sudden load spikes quickly while scaling down conservatively to avoid oscillation (frequent scaling up and down) that can lead to instability and increased costs. Another crucial factor is tuning cooldown periods, which helps prevent overreacting to short-lived spikes in demand. After weeks of iterative tuning, we found the following configurations gave us a well-tuned autoscaler for our clusters. As a note, these numbers are specific to our service but can be a good starting point:
downscaleForbiddenWindowSeconds: 1200 # 20min
upscaleForbiddenWindowSeconds: 60 # 1min
scaleDownLimitFactor: 10
scaleUpLimitFactor: 100
A useful heuristic for assessing whether your autoscaler is functioning efficiently is to monitor CPU and memory utilization. The chosen metric should remain stable on average across your cluster or datacenter. For example, if your workload is optimal at 75 percent CPU utilization, the autoscaler should keep this value at a steady state without significant fluctuations.
Lastly, when it comes to tuning the autoscaler, changes may take significantly longer than you initially expect. We iterated through numerous configurations and tested different scaling velocities, cooldown periods, and resource limits to prevent performance degradation while still ensuring the system could handle traffic spikes. Each adjustment required extensive monitoring for days at a time to observe the effects over various traffic patterns and workloads, which prolonged the tuning process.
Autoscaling offers a powerful and flexible approach to managing Kubernetes workloads by dynamically scaling on real-time metrics. However, regardless of which horizontal autoscaling framework you choose (WPA or HPA), it is not a “set it and forget it” solution; it requires continuous monitoring and adjustments. As your product grows or your autoscaler becomes less responsive, revisiting and fine-tuning configurations—whether monthly or quarterly—is essential to ensure optimal performance.
For a fully managed experience, Datadog Kubernetes Autoscaling combines watermark-based horizontal scaling, continuous vertical scaling, and built-in monitoring to simplify your scaling strategies and setup time. Try it out with a 14-day free trial.
此内容由惯性聚合(RSS阅读器)自动聚合整理,仅供阅读参考。 原文来自 — 版权归原作者所有。