




Candace Shamieh

Pratik Parekh
Today’s distributed IT infrastructure consists of many services, systems, and applications, each generating logs in different formats. These logs contain layers of important information used for data analytics, security monitoring, and application debugging. However, extracting valuable insights from raw logs is complex, requiring teams to first transform the logs into a well-known format for easier search and analysis. Teams may also need to add custom context to the logs to simplify debugging and improve data quality as they are ingested by downstream applications.
Datadog Observability Pipelines already provides users with the ability to aggregate their logs behind a single pane of glass, process them, and route them to assigned destinations. Now Observability Pipelines’ out-of-the-box processors allow you to convert logs into a standardized format, enrich logs for better consumption by your downstream applications, embed data provenance into your logs for simplified debugging, and add precise geographic location for more efficient analysis.
In this post, we’ll discuss how Observability Pipelines can:
Logs are produced from a variety of sources, including network appliances, messaging queues, and transaction processes. Each source emits logs in a unique format that contains relevant, source-specific information. As a result, teams must tokenize the logs so they can adhere to data governance and compliance standards before routing them to downstream applications like log management tools, debuggers, or SIEM systems. This parsing process is tedious, resource-intensive, and difficult to scale.
Observability Pipelines introduces the Grok Parser, a processor that allows you to write custom parsing rules or automatically apply preconfigured parsing rules to your logs. Adding the Grok Parser to Observability Pipelines enables you to process and transform any log type as it routes to its destination.
The Grok Parser enables you to choose from over 150 preconfigured parsing rules in the Datadog Pipeline Library. You can use the parsing rules out-of-the-box or clone them to make customizations that fit the unique needs of your environment. You also have the option to write custom parsing rules completely from scratch. Custom parsing rules enable you to satisfy vendor taxonomy requirements and control log volume at a granular level as you structure, enrich, or extract important information from your logs.
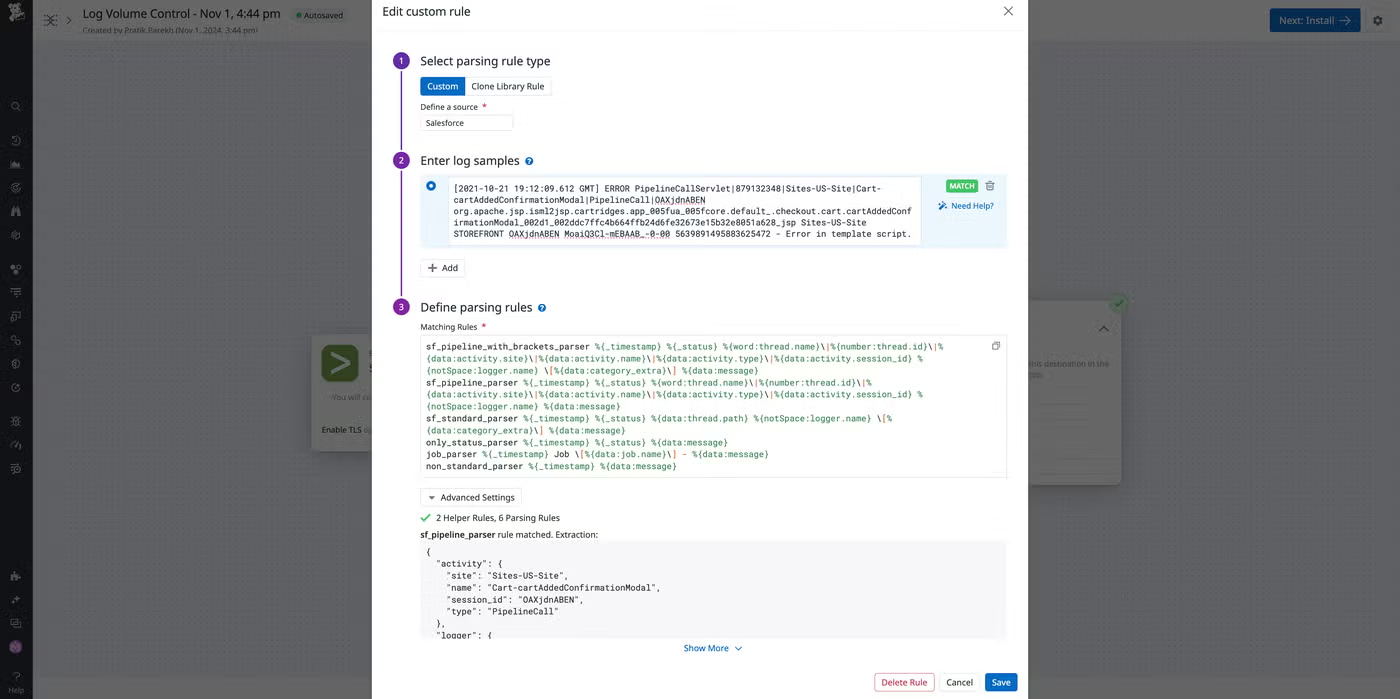
You can write and test your parsing rules in the Datadog app, so you can ensure that your logs are in the desired format before you route them to their destination. Unlike pure regular expressions, the Grok syntax does not require you to create a new expression for each data type, making it a more scalable way to parse your logs.
For example, let’s say you have an unstructured log message that displays a long string of numbers and words from an application. The log message includes an IP address, browser information, API calls, and more, but your downstream applications are unable to properly ingest and analyze the message because of its default format. Instead of manually sorting, defining, and categorizing each portion of the log, the Grok Parser uses the source attribute within the log message to automatically extract fields like IP address, timestamp, request, bytes, OS, and browser. You’re then able to use the tokenized logs to quickly search for relevant information and derive helpful insights as you conduct analysis or troubleshooting steps.
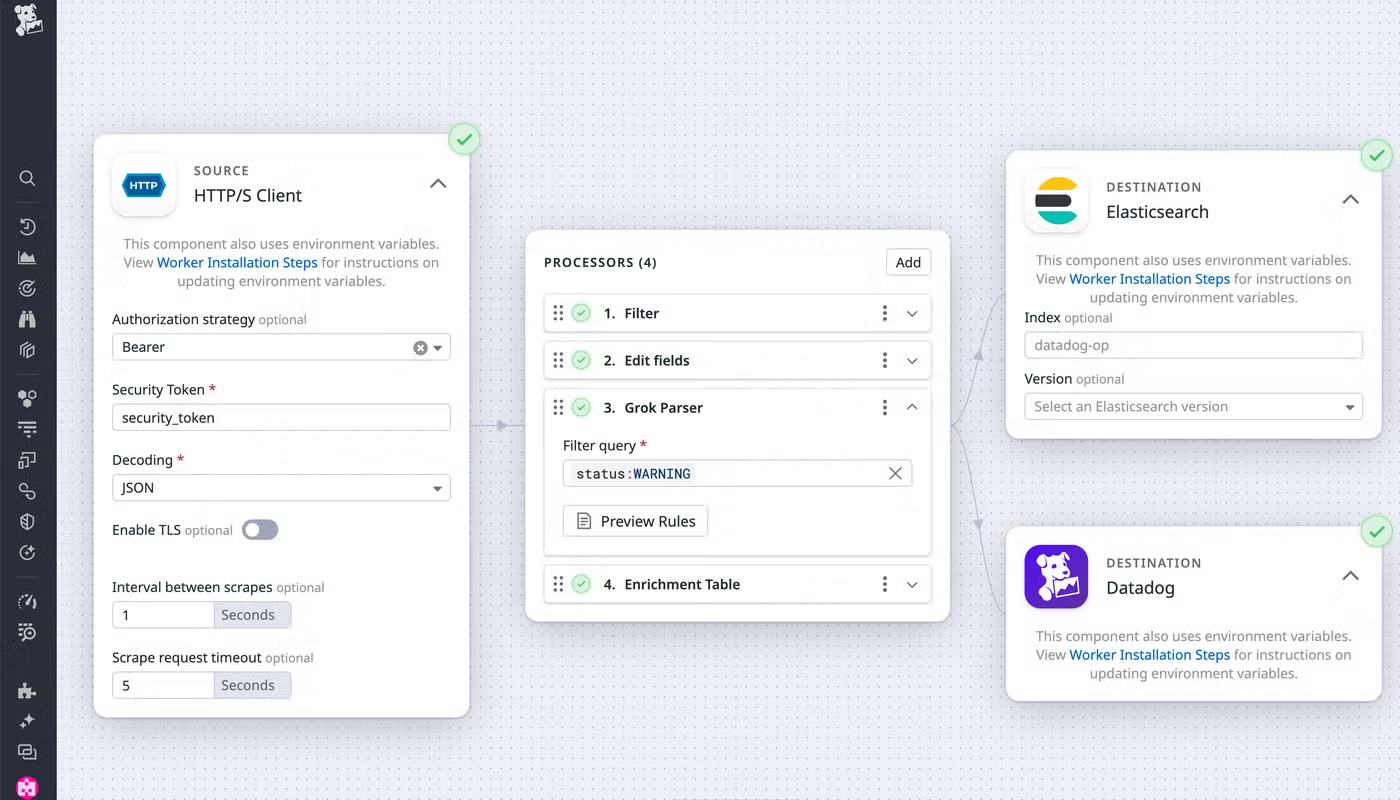
The following code provides an example of how a raw Docker log looks before and after using our Grok Parser:
192.0.2.17 - - [06/Jan/2017:16:16:37 +0000] "GET /datadoghq/company?test=var1%30Pl HTTP/1.1" 200 612 "http://www.test-url.com/" "Mozilla/5.0 (X11; Linux x86_64) AppleWebKit/537.36 (KHTML, like Gecko) Chrome/55.0.2883.87 Safari/537.36" "-"
{
"http": {
"referer": "http://www.test-url.com/",
"status_code": 200,
"method": "GET",
"useragent": "Mozilla/5.0 (X11; Linux x86_64) AppleWebKit/537.36 (KHTML, like Gecko) Chrome/55.0.2883.87 Safari/537.36",
"version": "1.1",
"url": "/datadoghq/company?test=var1%30Pl"
},
"network": {
"bytes_written": 612,
"client": {
"ip": "192.0.2.17"
}
},
"timestamp": 1483719397000
}
Raw logs usually contain specific, detailed information, such as customer IDs, SKUs, or IP addresses. While valuable, this information can be difficult to search for and understand in its original form. Enriching your logs with contextual data allows them to be searchable in a human-readable format and enhances usability for downstream analysis.
Observability Pipelines’ Enrichment Table processor allows you to create custom tables that enrich data as it routes logs to the appropriate destination, avoiding the complex, time-consuming task of transforming diverse log formats after ingestion. Using a CSV file, the processor adds contextual information to each log message.
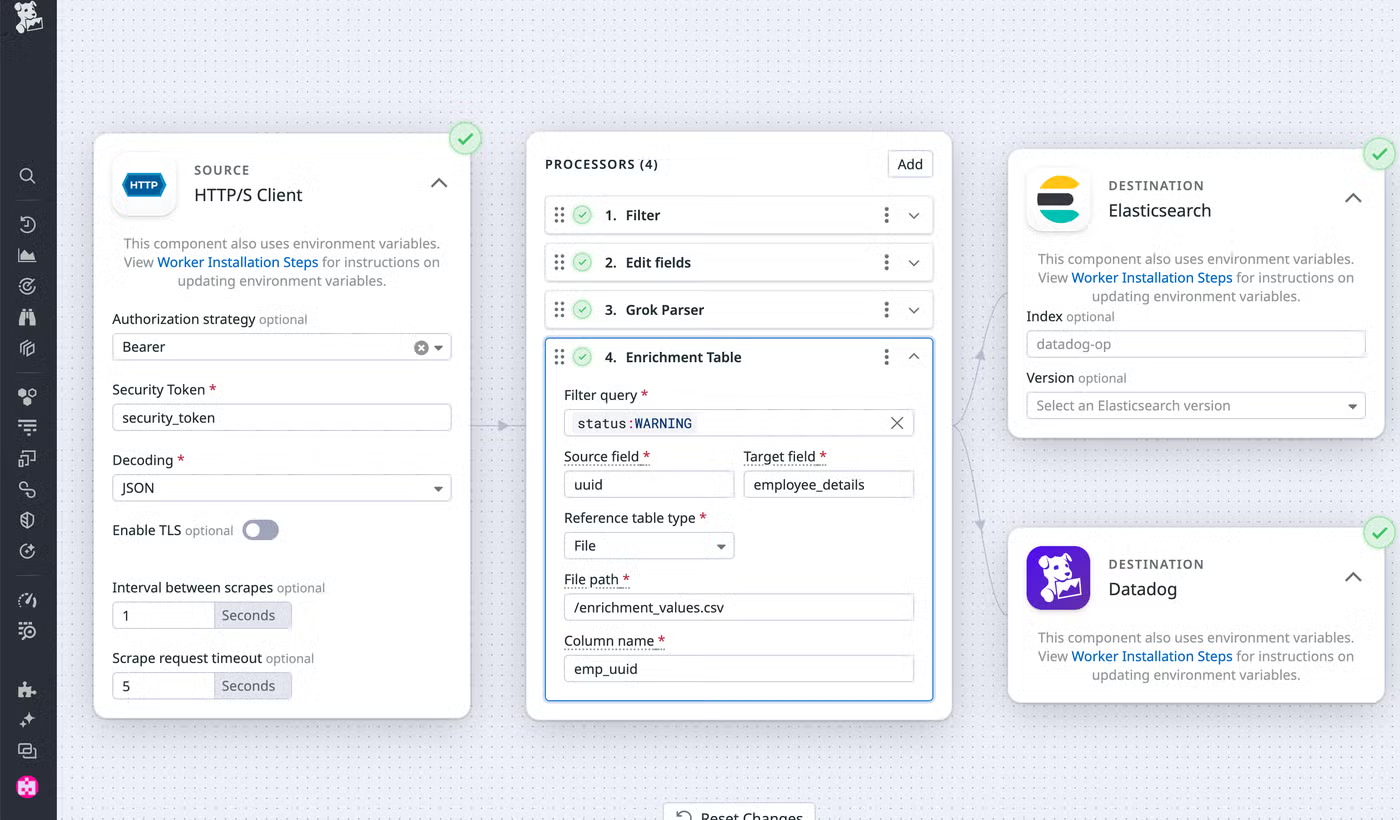
As an example, let’s say you’re the regional director of operations for a food delivery service and one of your managers wants to create a report that shows each delivery driver’s zone. They attempt to find the zoned areas by searching for employee names but cannot find the information because your raw logs contain only universally unique identifiers, or UUIDs. With the Enrichment Table processor, you can insert employee names into the logs and associate them with the UUID.
The following code illustrates a log before and after enrichment:
empID, Name, Delivery Zone, State
1990, John Smith, Dallas-Fort Worth Metroplex, TX
3998, Jane Doe, Metro Atlanta, GA
8267, Michael Johnson, Nashville Metropolitan Area, TN
{
"employee_details": {
"emp_id": 1990,
"Name": "John Smith",
"Delivery Zone": "Dallas-Fort Worth Metroplex",
"State": "TX"
},
}
{
"employee_details": {
"emp_id": 3998,
"Name": "Jane Doe",
"Delivery Zone": "Metro Atlanta",
"State": "GA"
},
}
{
"employee_details": {
"emp_id": 8267,
"Name": "Michael Johnson",
"Delivery Zone": "Nashville Metropolitan Area",
"State": "TN"
},
}
Most large, distributed systems make use of autoscaling, where resources are spun up or torn down dynamically as demand fluctuates. When debugging an issue or tracking a possible security threat, identifying affected hosts is critical to better understand the scale of the issue or vector of the attack. When aggregating logs from various sources, users often need to run multiple queries to gather enough context before taking action.
With the Add Hostname processor, you can automatically insert the hostname directly within the log message. The Add Hostname processor automatically embeds system information in a structured format, making it easily searchable and helping you pinpoint a root cause if an issue occurs.
Nested within the Enrichment Table processor, the GeoIP Parser adds context from the GeoIP database directly within the log message. This processor enables you to pinpoint an IP address’s geographical location, improving security monitoring and data analytics. With the GeoIP Parser, you can visualize geographical locations in your reports and add maps to custom notebooks or as widgets on a Datadog dashboard.
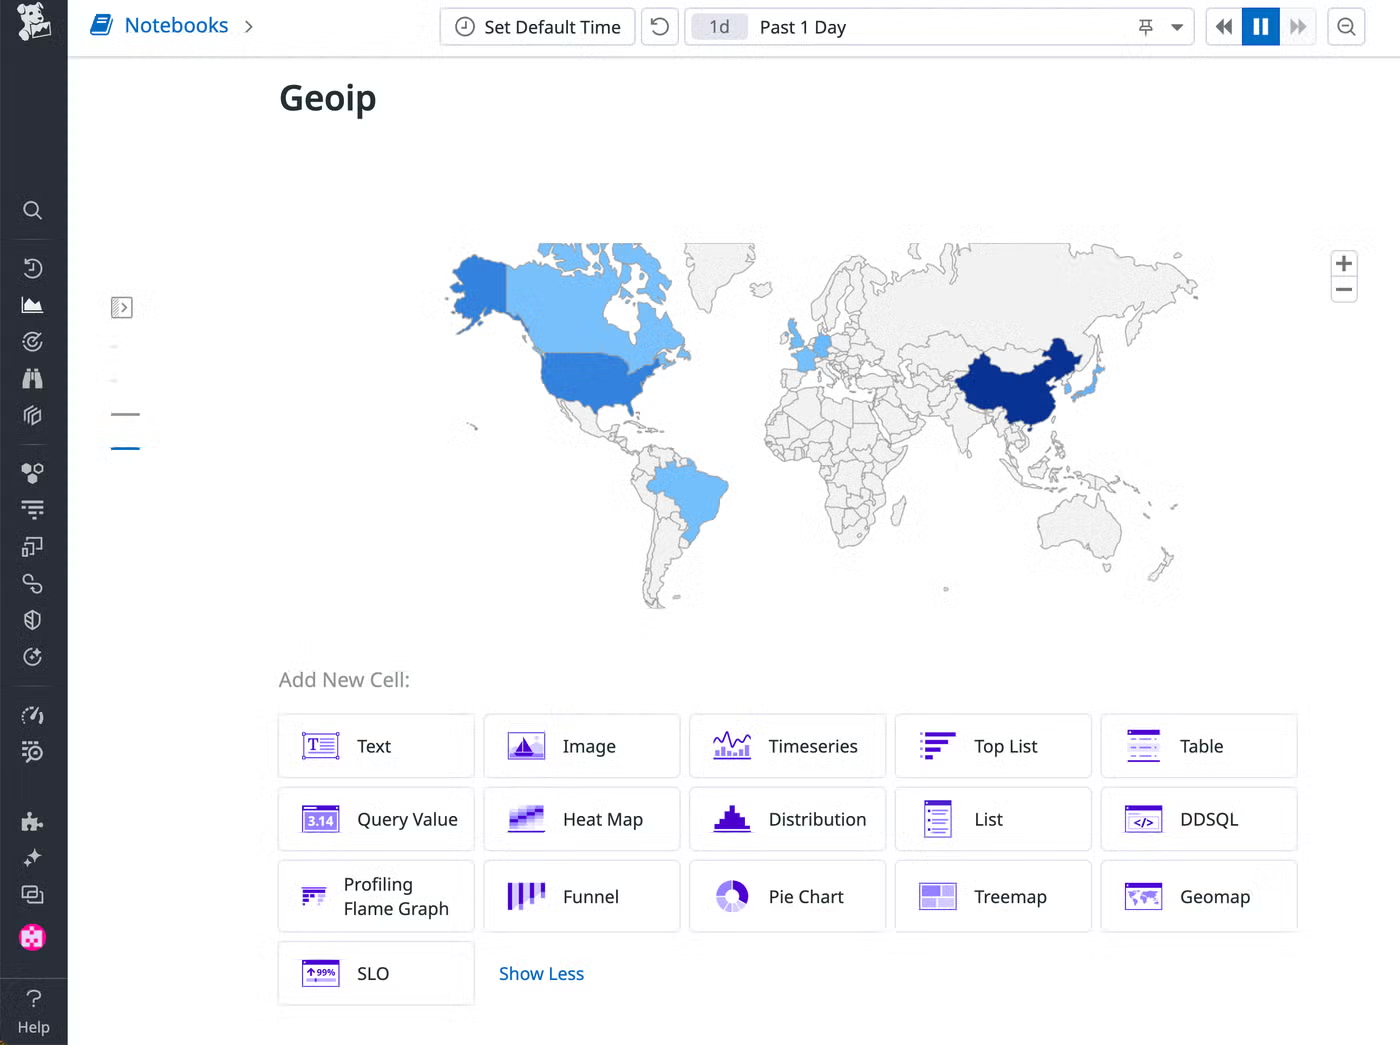
To demonstrate how the GeoIP Parser works with the other new Observability Pipelines processors to enhance security, let’s say you have a production server farm with multiple servers generating logs. The Grok Parser structures your logs with the IP address, browser information, request, and timestamp. When a critical service fails, the Add Hostname processor enables you to easily correlate logs with the specific server via hostname, allowing for faster troubleshooting and targeted fixes. In the case of a suspected attack on your environment, the GeoIP Parser can help you pinpoint the geographic location of a malicious host sooner, while the Enrichment Table processor attaches a CSV file that contains a list of known malicious IP addresses.
Building upon the food delivery service example, let’s say the IT team receives an alert notifying them of a suspicious login attempt in the route-planning application used by delivery drivers. The login attempt was made from Metro Atlanta, so IT can’t immediately determine whether an actual delivery driver made the attempt. Using the Add Hostname processor to insert hostnames into logs, the IT team can pinpoint the host and, subsequently, the device used for the login attempt. Taking the investigation further, IT can leverage the GeoIP Parser to query the GeoIP database and connect delivery driver device locations with IP addresses and timestamps. This additional context helps the IT team identify the exact locations of their Metro Atlanta delivery drivers at the time of the suspicious login attempt and whether the activity is typical.
The following code shows how the output of a log will look after processing:
{
"employee_details": {
"emp_id": 1990,
"Name": "John Smith",
"Delivery Zone": "Dallas-Fort Worth Metroplex",
"State": "TX"
},
"hostname": "john-smith-1-device",
"geoip": {
"country": "United States",
"region": "Texas",
"city": "Fort Worth",
"latitude": 32.7767,
"longitude": -96.7970
},
"timestamp": "2024-07-15T12:34:56Z",
"action": "login attempt",
"ip": "203.0.113.25" },
{
"employee_details": {
"emp_id": 3998,
"Name": "Jane Doe",
"Delivery Zone": "Metro Atlanta",
"State": "GA"
},
"hostname": "jane-doe-1-device",
"geoip": {
"country": "United States",
"region": "Georgia",
"city": "Alpharetta",
"latitude": 34.0522,
"longitude": -118.2437
},
"timestamp": "2024-07-15T12:34:56Z",
"action": "login attempt",
"ip": "198.51.100.23" },
{
"employee_details": {
"emp_id": 8267,
"Name": "Michael Johnson",
"Delivery Zone": "Nashville Metropolitan Area",
"State": "TN"
},
"hostname": "michael-johnson-1-device",
"geoip": {
"country": "United States",
"region": "Tennessee",
"city": "Franklin",
"latitude": 35.9251,
"longitude": -86.8689
},
"timestamp": "2024-07-15T12:34:56Z",
"action": "login attempt",
"ip": "192.0.2.18"
}
Datadog Observability Pipelines enables you to collect, transform, enrich, and route your infrastructure logs. The Grok Parser equips you with out-of-the-box parsing rules, allowing you to transform logs on the wire and enhance your search and analysis capabilities for efficient downstream consumption. Enrich logs with custom context with our Enrichment Table processor, and insert the local hostname with the Add Hostname processor for simplified debugging. Lastly, leverage our GeoIP Parser to add geographic information to log messages so that you can identify and respond to incidents quickly and create custom maps for your reports.
For more information, visit our documentation. If you’re new to Datadog, you can sign up for a 14-day free trial.
此内容由惯性聚合(RSS阅读器)自动聚合整理,仅供阅读参考。 原文来自 — 版权归原作者所有。