











Many modern applications rely on MongoDB and MongoDB Atlas to manage growing data volumes and to provide flexible schema and data structures. As organizations adopt these and other NoSQL databases, effective monitoring and optimization become critical, especially in distributed environments. The decentralized nature of microservices and the increasing complexity of applications can lead to fragmented insights and limited visibility into database performance, resulting in longer troubleshooting times and decreased application stability.
Datadog Database Monitoring (DBM) now supports MongoDB, building on existing MongoDB and MongoDB Atlas integrations to provide deeper visibility into database performance.
DBM surfaces critical information about your MongoDB instances, including slow operations, explain plans, and replication state changes. It enables you to analyze detailed operation samples to pinpoint performance bottlenecks before they impact applications. You can also monitor the health and efficiency of your MongoDB instances, making it easier to proactively diagnose and resolve database issues.
In this post, we’ll walk through how DBM for MongoDB enables your teams to:
Ensure high availability by tracking replication health and node status to keep MongoDB self-hosted and Atlas clusters running smoothly
Optimize query and database performance by using detailed metrics and explain plans to identify and resolve bottlenecks
Drive collaboration by unifying MongoDB monitoring with application and infrastructure metrics for a complete view of system performance
In distributed MongoDB environments, maintaining high availability across clusters with multiple nodes and replicas is essential. Replication failures or misconfigurations can result in significant downtime and data inconsistencies, which may impact application performance and reliability.
DBM helps teams keep MongoDB nodes healthy and replicating smoothly by providing metrics on replication lag (mongodb.replset.optime_lag), replica set member state (mongodb.replset.state), and member health (mongodb.replset.health), alongside other cluster health telemetry. mongodb.replset.optime_lag measures the delay between a write on the primary and its replication to the secondary, helping you monitor replication state with minimal delay. Additionally, mongodb.replset.votefraction and mongodb.replset.votes track election processes within replica sets to confirm that leader elections proceed smoothly when needed. These metrics provide visibility to help ensure that your clusters remain available and that replication functions as expected, even as your system scales.
DBM offers two key views to help you visualize your MongoDB clusters:
Cluster List
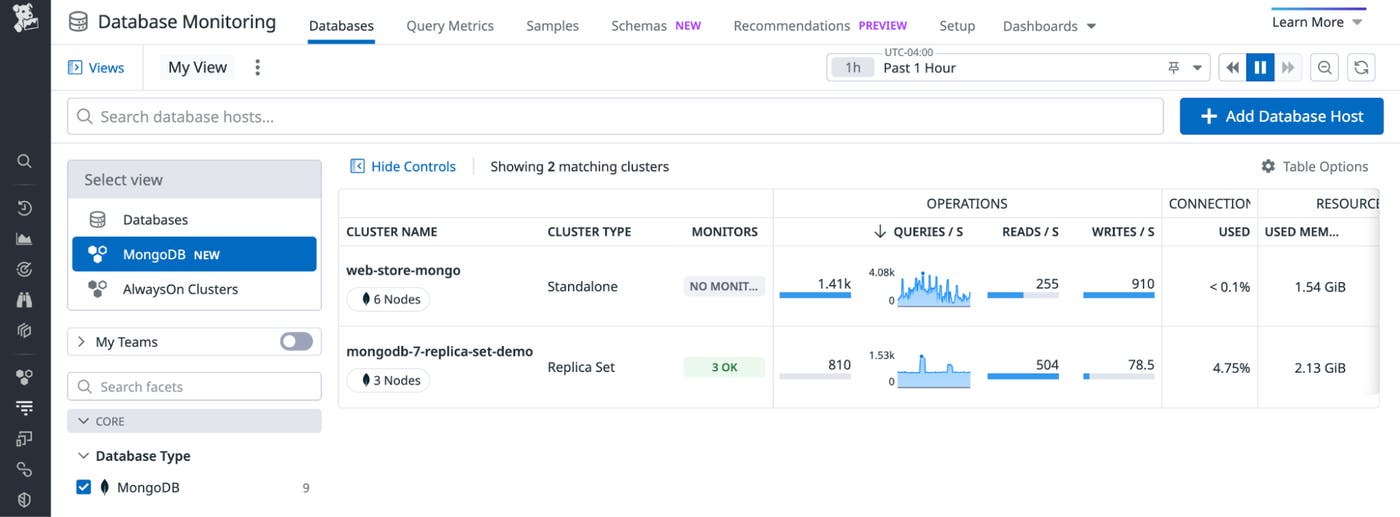
When you open DBM, you’ll see the Cluster List view, which provides a comprehensive list of your MongoDB clusters. This view displays critical metrics like queries per second, reads and writes per second, and replication details. You can monitor overall cluster performance at a glance and drill into specific clusters for more detailed metrics like replication lag and operations log (oplog) size. This allows you to detect potential issues early and take preventive action.
Cluster Composition
From the Cluster List view, you can navigate to the Composition tab to see a visual representation of your cluster’s structure. MongoDB Clusters are grouped by replica set or shard, with each node represented by a hexagon. Healthy nodes appear in green, while offline or unhealthy nodes show in red. This visualization provides a quick assessment of cluster health and confirms that replication processes are functioning as expected.
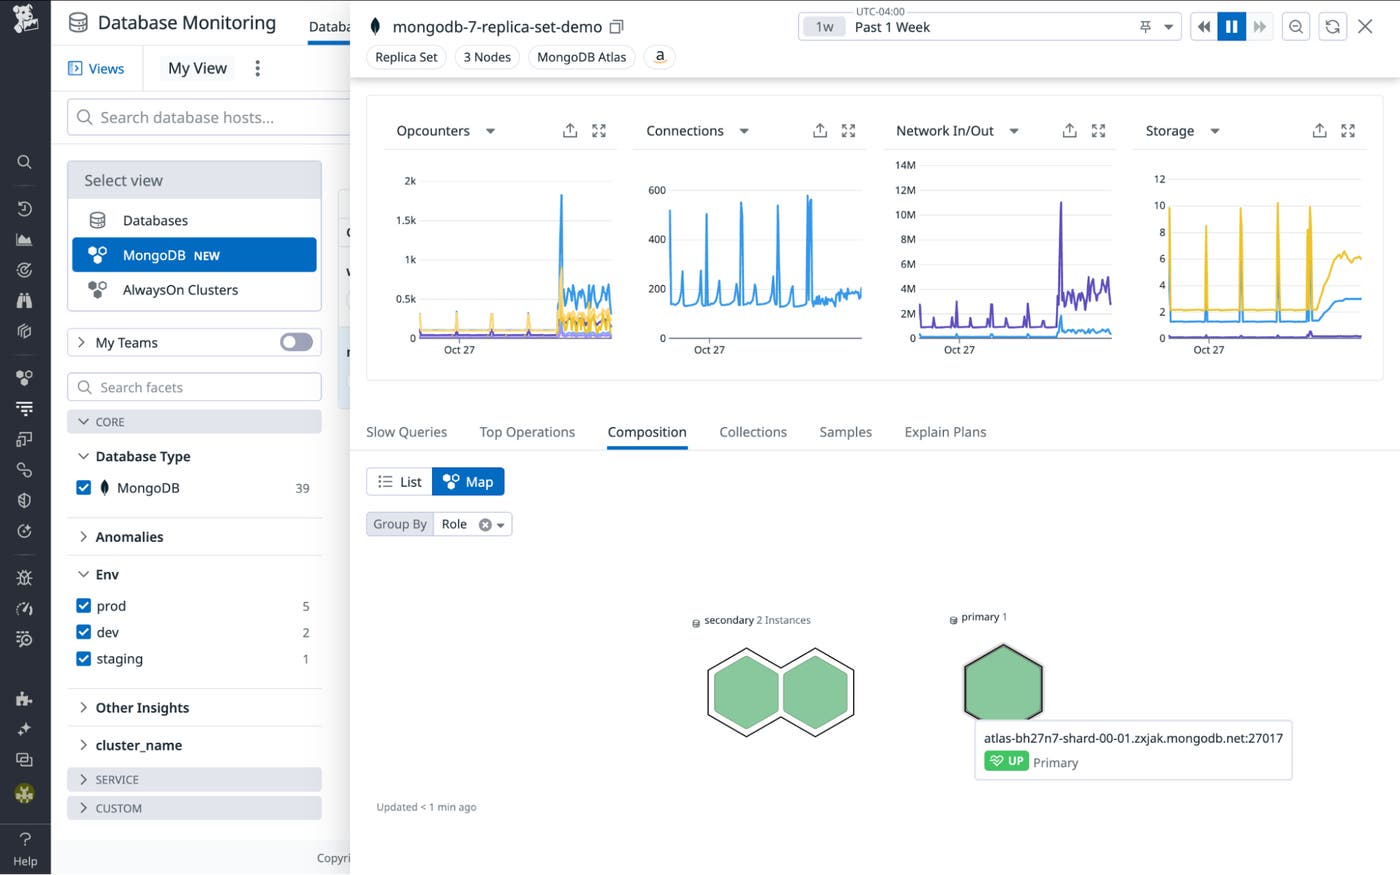
You can set custom alerts on these metrics to notify you, for example, when replication lags or a node goes down. This enables you to maintain high availability and quickly resolve issues before they escalate.
As your application scales, database queries can become performance bottlenecks. Inefficient indexing strategies or suboptimal query patterns can lead to slow response times and degraded application performance. Identifying the root cause of these slowdowns in a distributed environment is complex, requiring visibility into query behavior, execution plans, and host-level metrics.
DBM simplifies troubleshooting database inefficiencies by providing detailed information on MongoDB queries and operations. You can identify issues such as slow queries caused by missing indexes, full collection scans from inefficient execution plans, or resource contention from high CPU or memory usage. DBM’s features provide a complete picture of MongoDB performance, allowing you to drill down from high-level metrics to specific inefficiencies.
Slow Queries and Top Operations
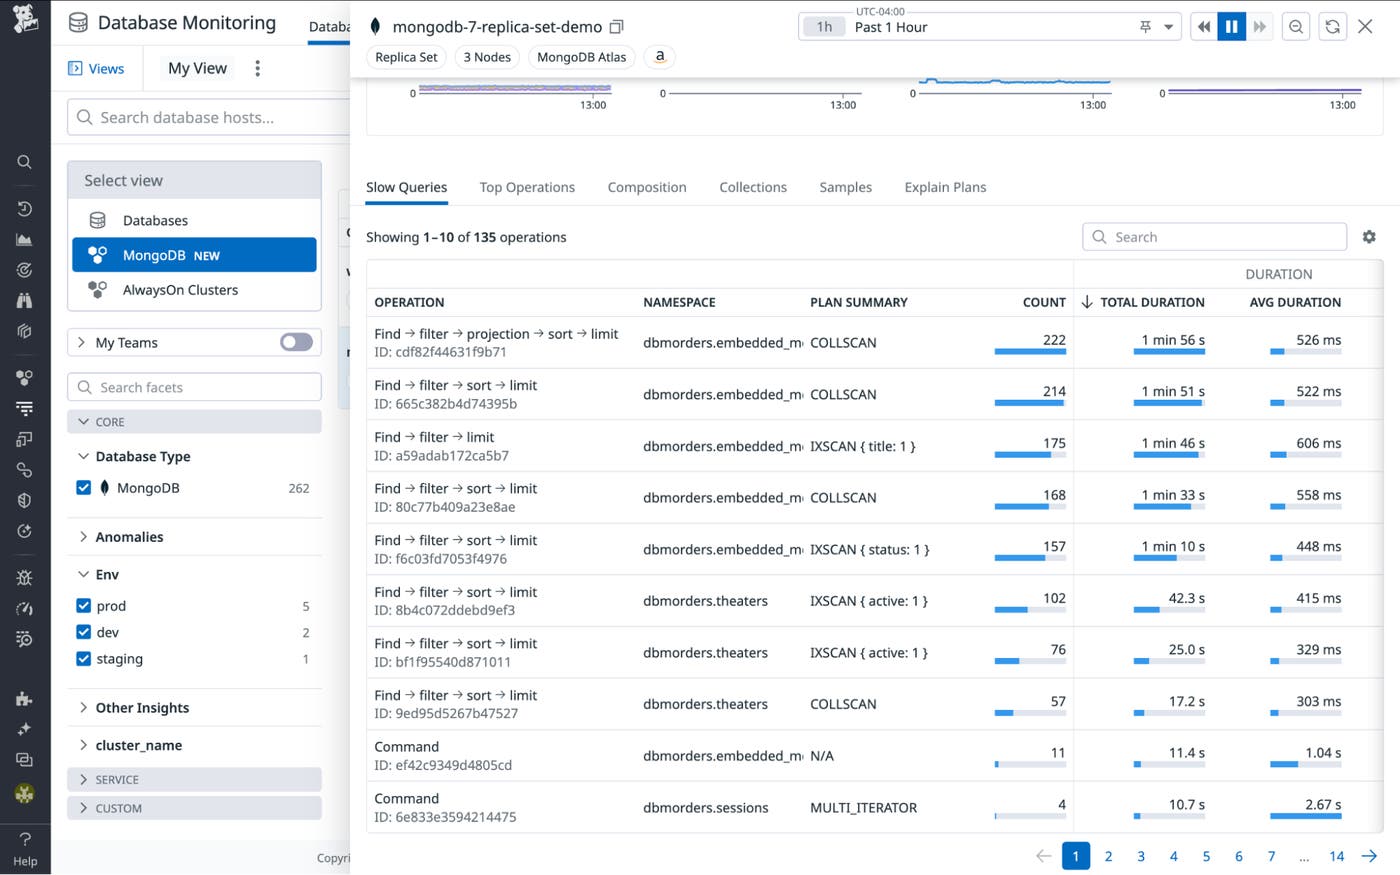
The Slow Queries tab highlights the longest-running queries, displaying key metrics such as total duration, the number of keys or documents examined, documents returned, and the type of execution plan used (e.g., COLLSCAN for collection scans).
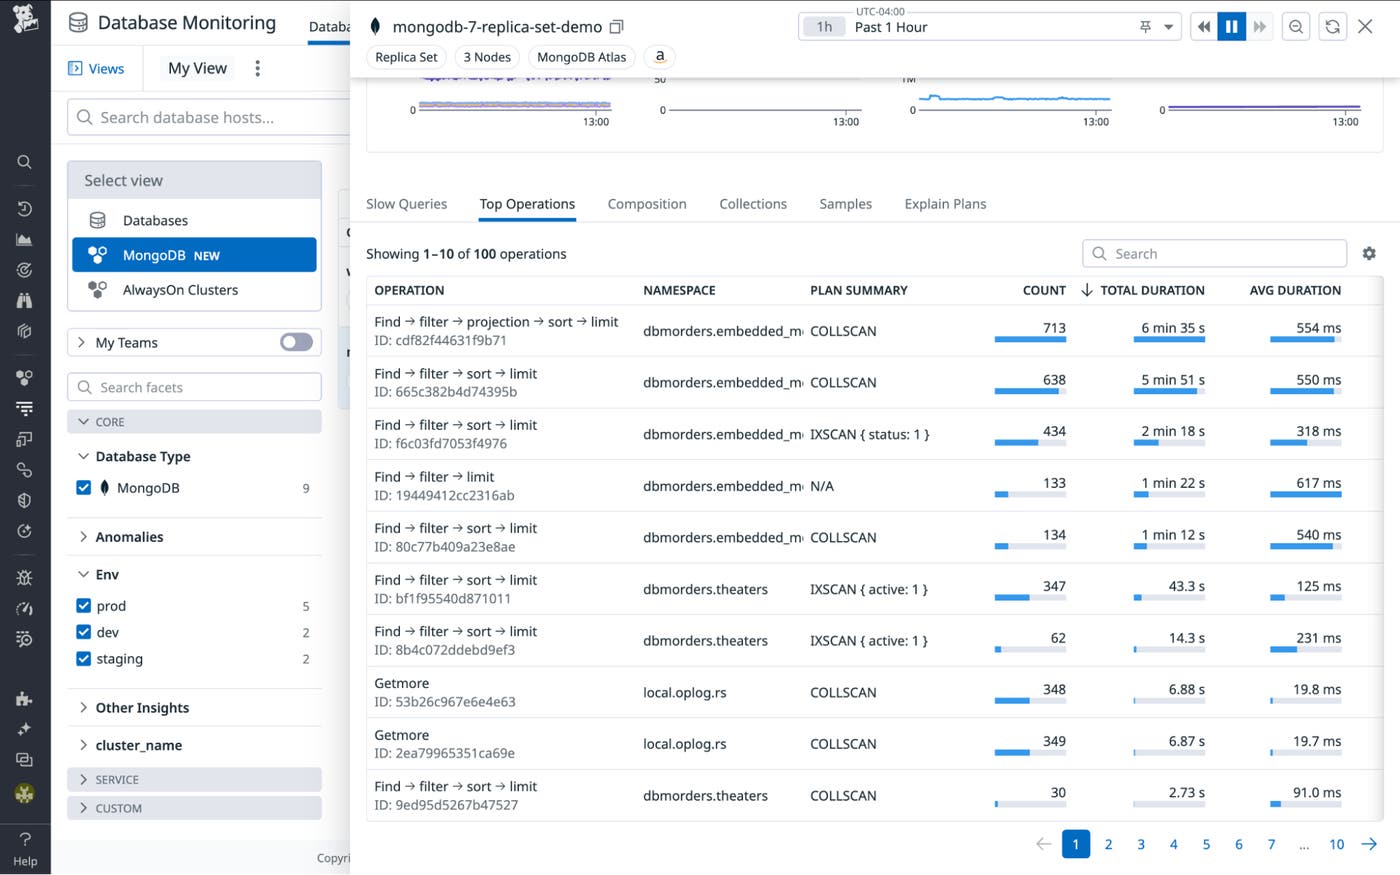
Similarly, the Top Operations tab ranks the most resource-intensive operations, showing which queries or operations consume the most resources. Together, these views offer an overview of major resource bottlenecks due to a specific slow query or a high-traffic operation.
Explain plans for deeper diagnosis
After identifying slow queries or high-resource operations, you can analyze their explain plans for more detail. This feature breaks down MongoDB’s query execution, revealing whether the query performs a full collection scan (COLLSCAN), inefficiently sorts large datasets in memory, lacks key indexes to speed up execution, or scans more index entries or documents than it returns. The Map View visually highlights the most resource-intensive parts of the query execution, while the List View provides a step-by-step breakdown of each stage, from index usage to document retrieval, offering the context needed to optimize performance.
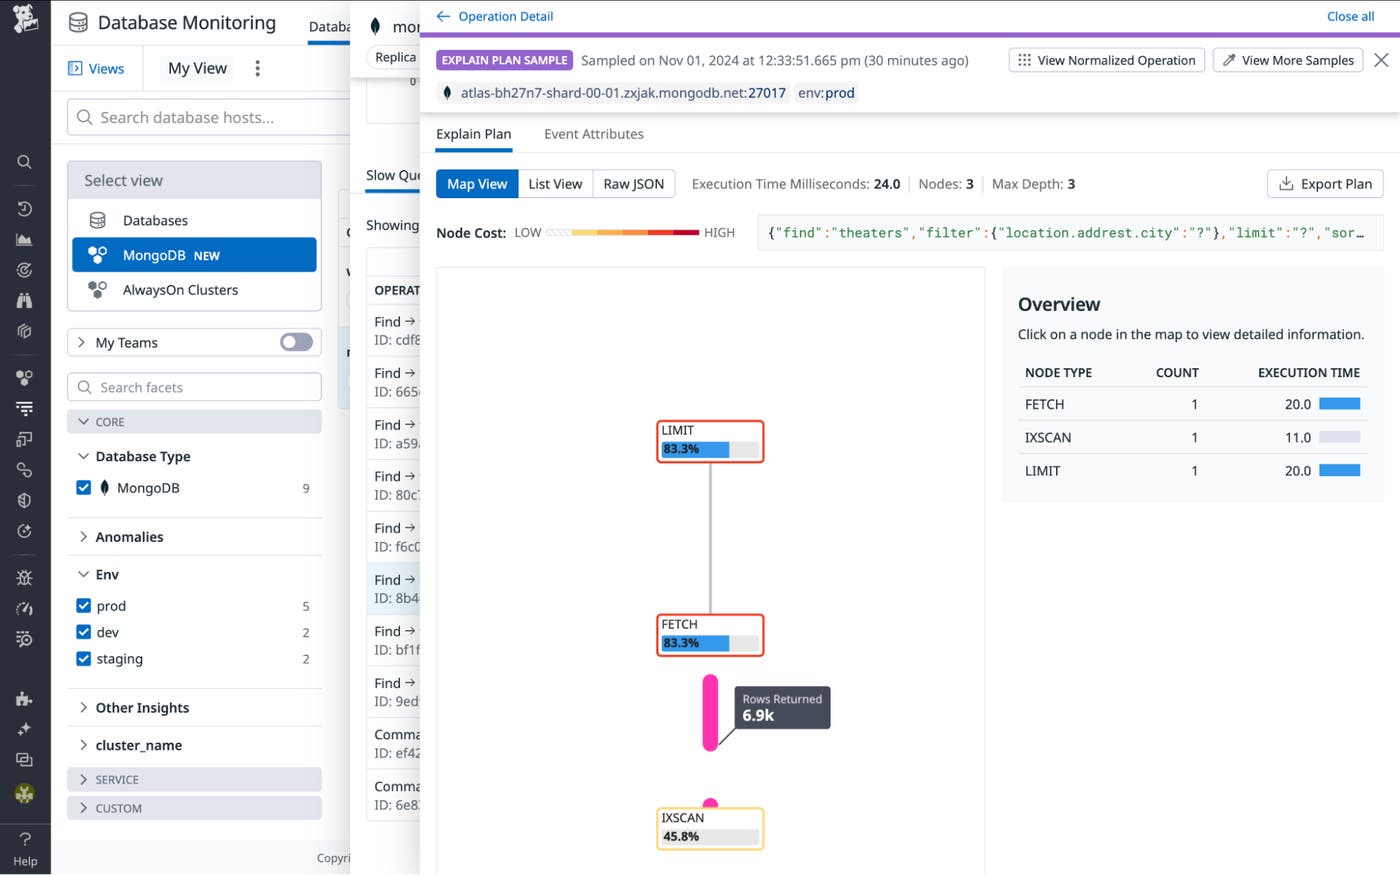
Linking slow queries to their execution plans enables you to diagnose inefficiencies and optimize them by adding indexes, adjusting query filters to reduce the number of scanned documents, or refining projections to limit returned fields.
Query samples for additional context
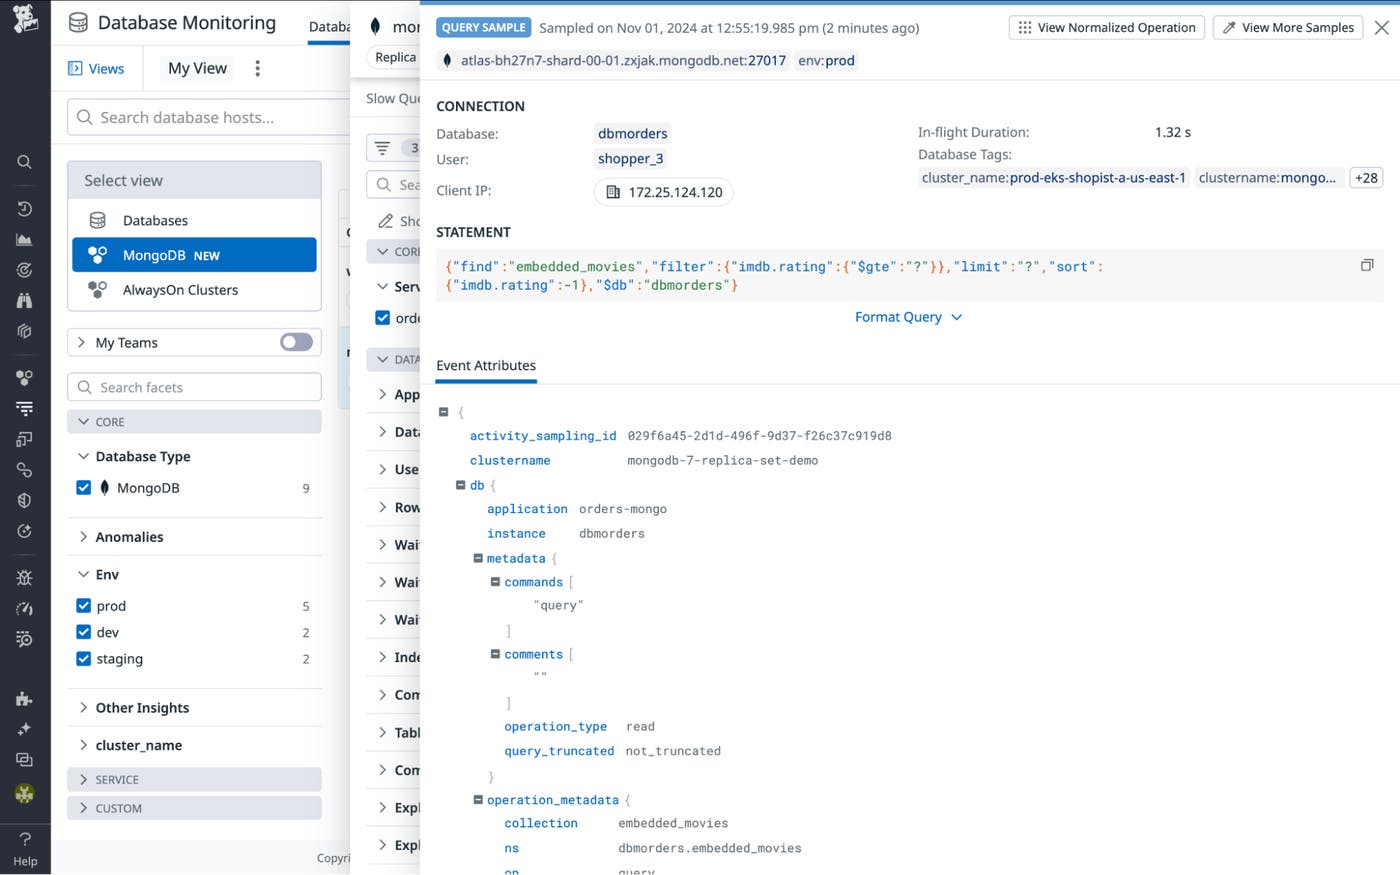
The Samples tab allows you to examine individual query executions in greater detail. You can filter by attributes such as database, user, client IP, or application to pinpoint specific queries or users that may be causing issues. Each sample includes the originating statement and in-flight duration, and provides metadata—such as the application making the query—to give context on how queries interact with your database and whether certain applications or users generate inefficient queries.
You can link query samples back to slow queries and explain plans, providing an end-to-end view of how and why a query is underperforming, from execution time to context.
Collections for schema and index information
Beyond individual queries, DBM provides details on MongoDB Collections, allowing you to track schema-level information such as index usage, index size, document size, and read/write operations per second. Optimizing your indexing strategy is key to efficient query execution. Monitoring index usage and collection activity lets you make proactive adjustments to enhance performance, especially in high-traffic collections. For example, dropping unused indexes can reduce write overhead and improve efficiency.
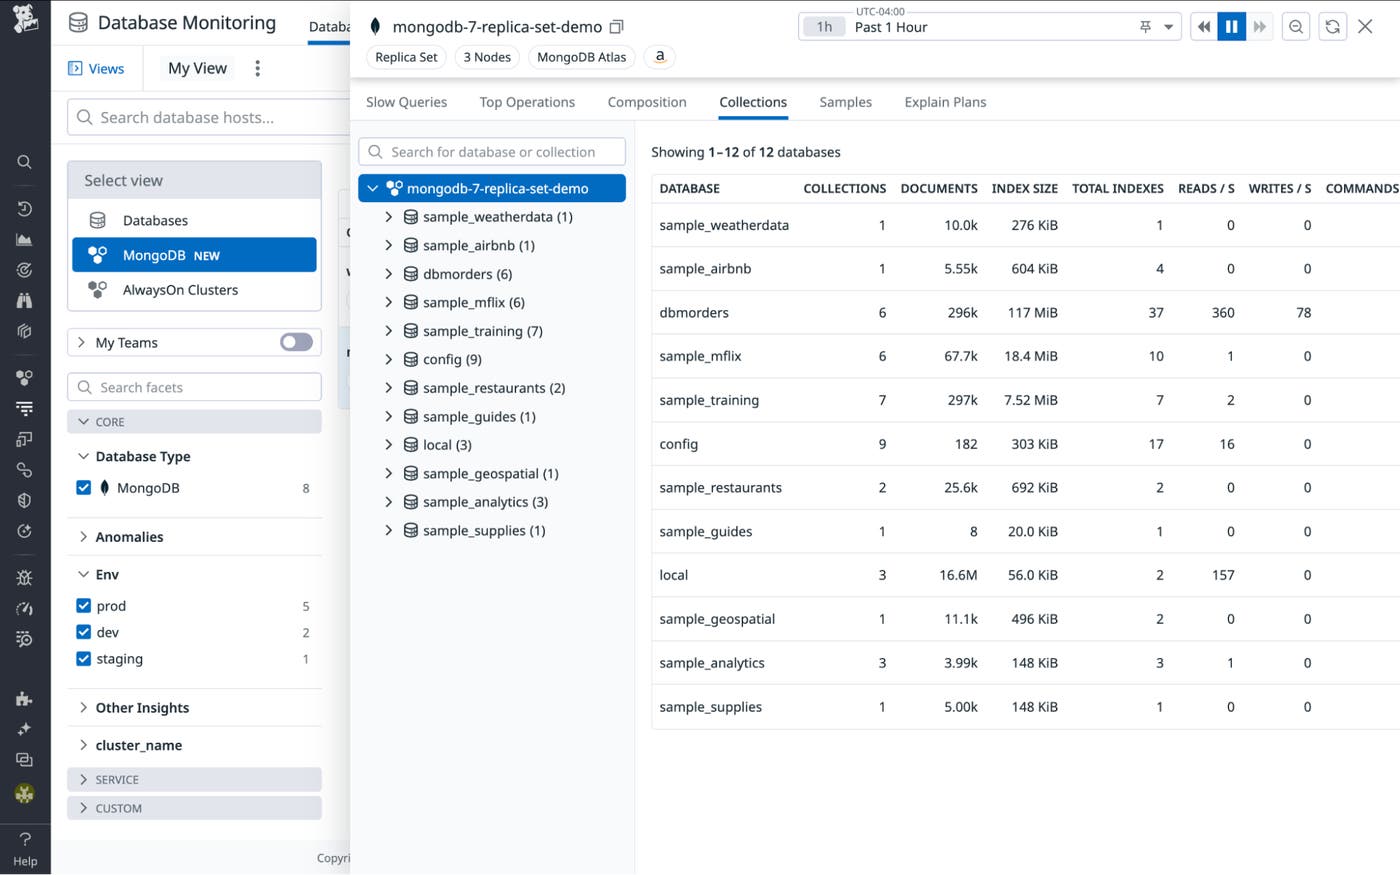
By using these features together, you can troubleshoot performance bottlenecks from a high level down to specific queries and maintain optimal performance as your MongoDB environment scales.
Databases like MongoDB have often been monitored in silos, with dedicated database teams managing and troubleshooting as needed. With separate monitoring solutions, it can be challenging to ensure the right teams are notified promptly and have the necessary tools and context to troubleshoot efficiently. Additionally, most organizations rely on various database types, further complicating monitoring efforts.
DBM offers a full-stack view of MongoDB performance, enabling teams to understand database health alongside infrastructure metrics like CPU and memory usage. This holistic view simplifies pinpointing the root cause of issues, attributing them to resource constraints or inefficient queries.
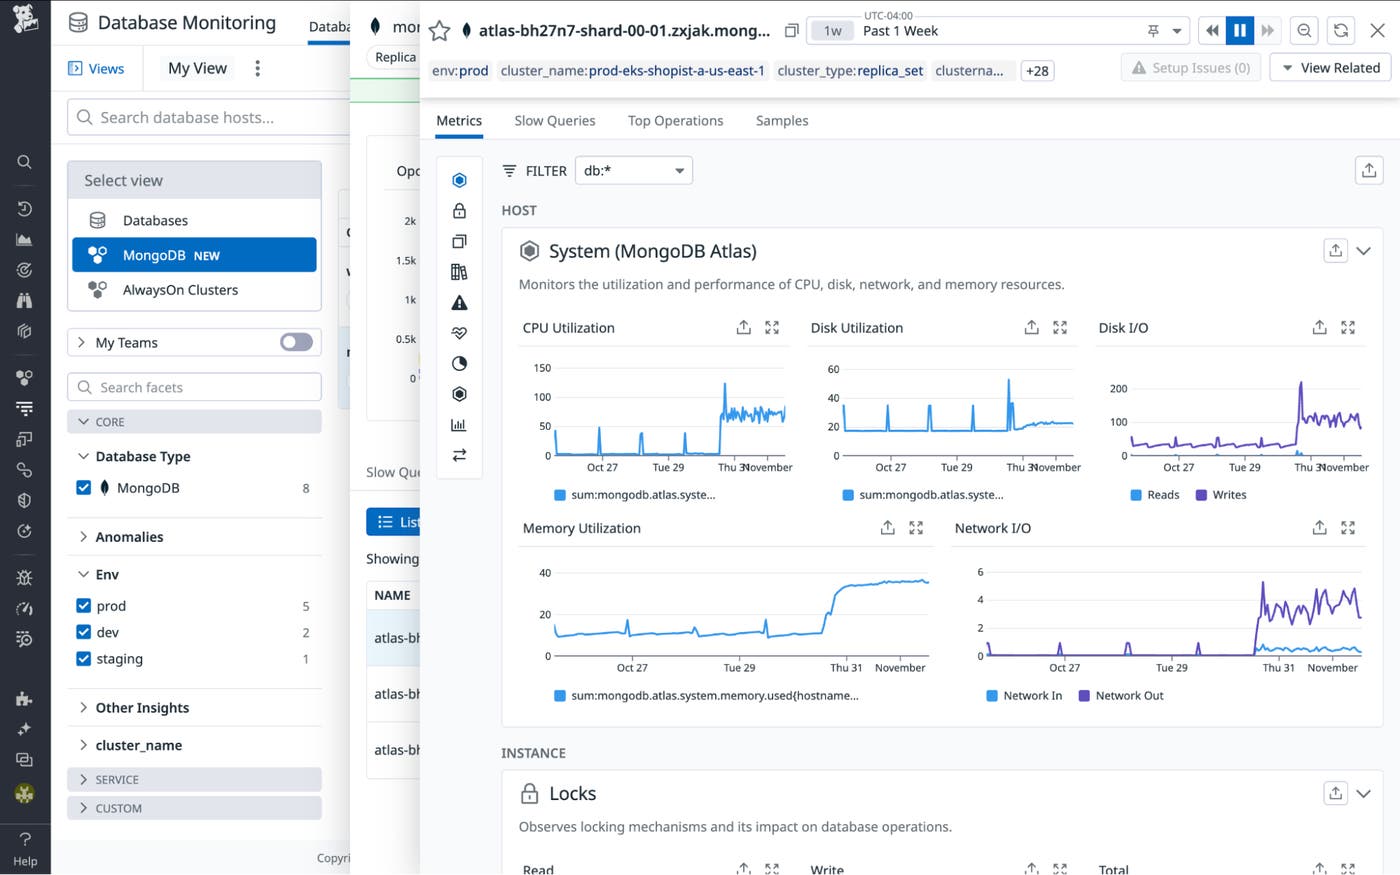
You can set up recommended monitors for key thresholds, such as memory consumption or available connections, to ensure faster incident response. By making database health and performance easily accessible, DBM enables multiple teams—including application developers, platform teams, and database administrators—to interpret database and query performance metrics, fostering efficient collaboration.
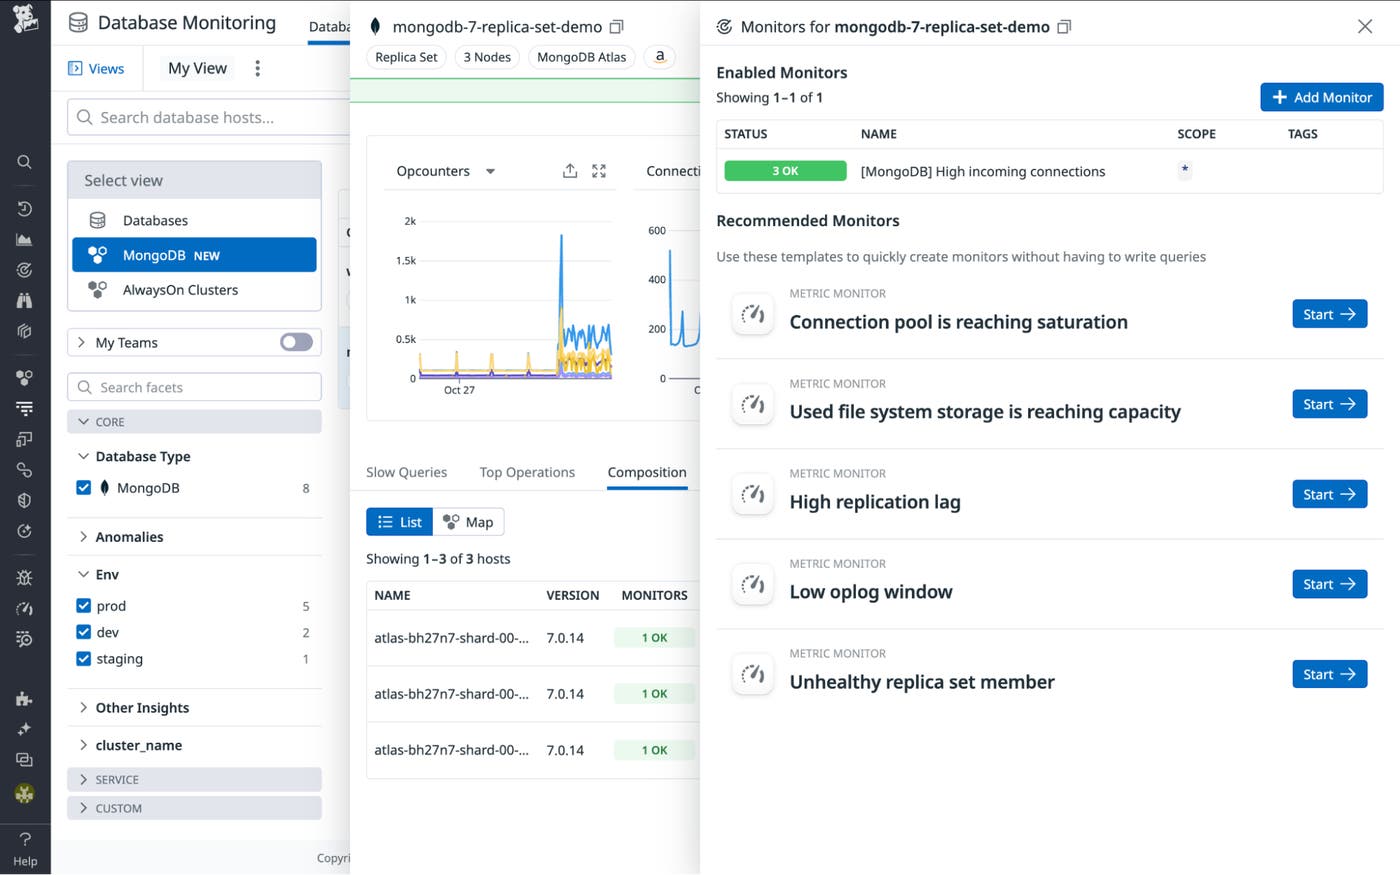
Monitoring MongoDB alongside your infrastructure and other databases in DBM enables teams to troubleshoot issues effectively and ensure consistent performance across the entire stack.
Datadog DBM delivers key metrics on your MongoDB databases alongside infrastructure telemetry, providing a unified view to proactively manage performance and address issues before they affect your applications.
From monitoring critical MongoDB cluster health to setting proactive alerts and analyzing slow queries, DBM enables your teams to optimize performance and reduce troubleshooting time. DBM offers support for multiple database types, so you can manage all your databases in one place, simplifying and scaling your monitoring efforts.
Visit our documentation to learn more about DBM. If you’re new to Datadog, sign up for a free 14-day trial.
此内容由惯性聚合(RSS阅读器)自动聚合整理,仅供阅读参考。 原文来自 — 版权归原作者所有。