







When you face issues like reduced throughput or latency spikes in your production applications, determining the cause isn’t always straightforward. These kinds of performance problems might not arise for simple reasons such as under-provisioned resources; often, the root of the problem lies deep within an application’s runtime execution. Diagnosing performance issues in these cases is important, but it’s often hard to get the kind of granular visibility you need to spot the root causes in code.
To help software engineers tackle these kinds of challenges, Datadog Continuous Profiler now includes a timeline view. This feature provides a detailed chronological visualization of code and runtime activity—grouped by threads, fibers, goroutines, or event loops—filtered to a container or a specific APM trace. Supported languages and frameworks currently include Java, Python, Go, Ruby, Node.js, .NET, and PHP.
Timeline view offers a complementary perspective to the traditional flame graph view used in Continuous Profiler. By giving you a detailed timeline of activity for each thread, it often lets you pinpoint the causal factors behind runtime performance issues more easily.
In this post, we’ll look at three scenarios, based on real customer experiences, that illustrate how you can use timeline view in Continuous Profiler to help you:
Enhance application throughput
Reduce p99 latency
Analyze the impact of garbage collection
In this first scenario, let’s say that you observe that the load for a Java-based image analysis application has gradually increased over a period of weeks, and that you notice performance has started to drag. An understandable first response might be to throw more CPU or memory at the problem. However, let’s say that, even with increased resources, you find that the service is still not handling more requests over time. Or perhaps you observe some benefit from scaling resources, but that those improvements are not proportional—representing a classic case of wasteful spending.
Such an occasion calls for Continuous Profiler to help you determine what is causing the bottleneck within the application’s runtime environment. Specifically, you want to determine whether, during the execution of the application, the available CPU is being used efficiently by the different application threads. In this case, you find that the information available in the traditional flame graph view isn’t detailed enough to help you.
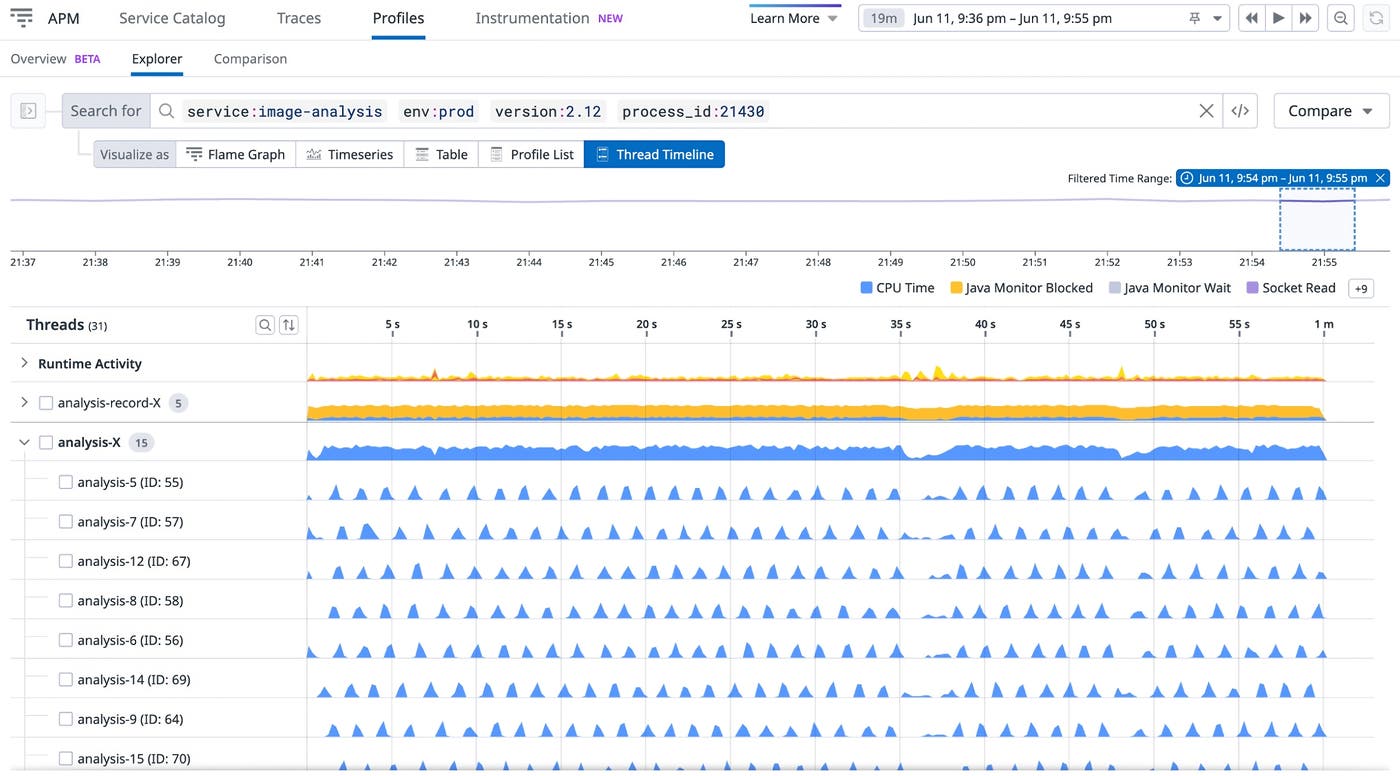
To research this problem in a more in-depth way, you turn to timeline view to investigate the execution of threads. In timeline view, you are able to see that the available threads mostly remained idle during the same time period. Despite 15 analysis workers being available, they are only sporadically active, as evidenced by the CPU time represented in blue:
You also notice that the analysis-record thread pool is heavily contended, as shown by the high percentage of yellow (representing time spent locked while waiting for synchronizations):
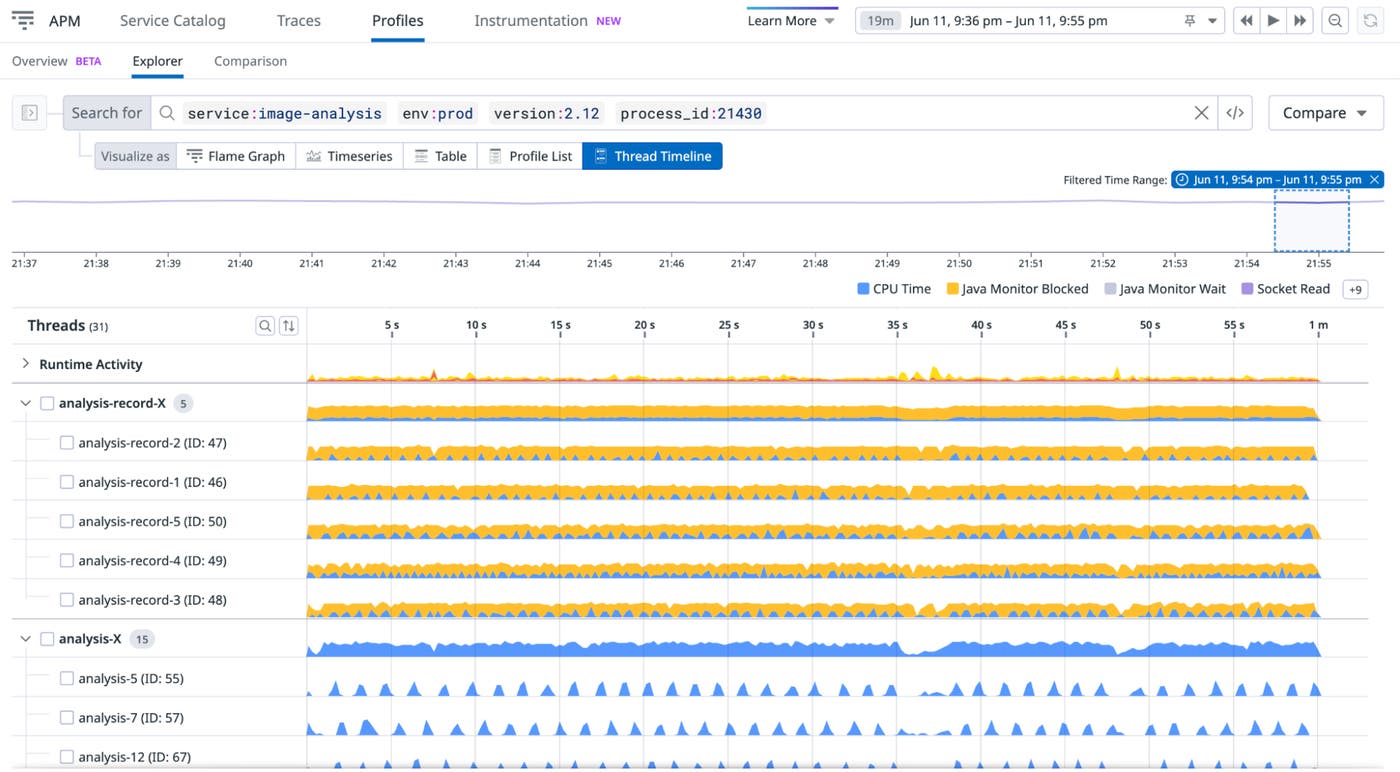
Within this application, the analysis-record pool is designed to preprocess the data and then send that data to the analysis pool. This means that, given the activity observed above in timeline view, the throughput of analysis is being throttled by the slow analysis-record throughput. This behavior is thus also throttling the JVM’s ability to fully leverage the CPU, as the entire data processing pipeline is constrained by the image-analysis pool throughput. Spotting that the analysis-record lock contention is the reason behind the throughput bottleneck would be much harder to do in the flame graph view.
To shed some light on what might be causing the contention within the image-transaction-record pool, you decide to zoom in to a smaller time segment to take a closer look. By looking at the blue (CPU Time) and yellow (Java Monitor Blocked) activity within a narrow sliver of the timeline, you can see that only one thread at a time is active, while all others are locked:
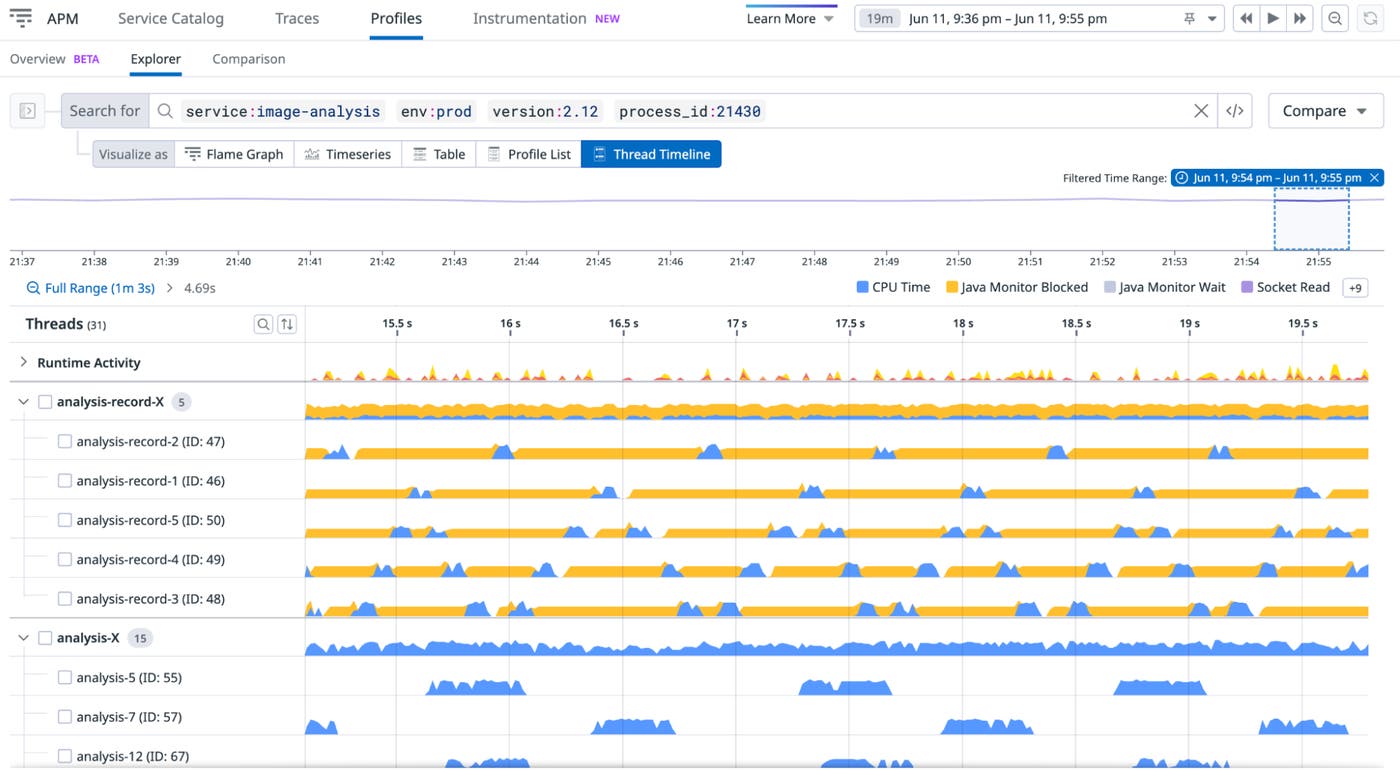
Note that this ability to quickly perceive the non-parallelization of the workload is possible only in timeline view, particularly since it breaks down the activity of each thread within the pool. By looking at the thread activity individually and together over a timeline, you can see that the lack of parallel CPU time is occurring because each thread is waiting for synchronizations. In other words, the problem is not that the process is throttled on CPU, for example, or that it is busy performing I/O.
To investigate the problem further, you select an individual Java Monitor Blocked event. The call stack information reveals that the lock is on the method Request.executeTransaction(), on line 39.
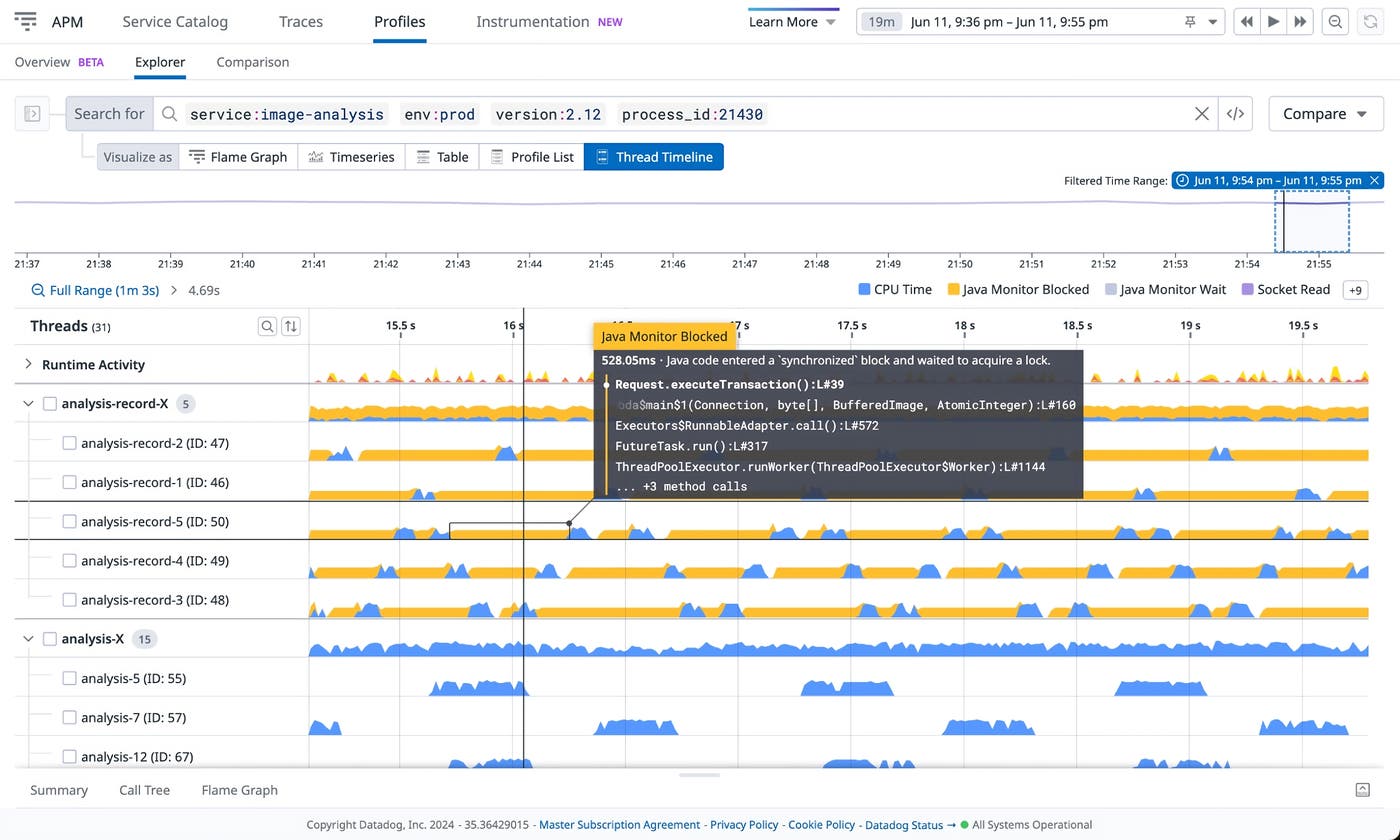
Looking back at the source code for this method, you can see that there is a lot of processing within the synchronized() statement. The code can be summarized by the following steps:
synchronized(recordLock) {
// Some preprocessing that takes a dozen of milliseconds per request
// the actual critical part that needs a lock - which is very short
}
Armed with this information, you decide to move the synchronized() code block so that it includes only the critical part, as summarized below:
// Some preprocessing that takes a dozen of milliseconds per request
synchronized(recordLock) {
// the actual critical part that needs a lock - which is very short
}
Once this fix is applied to production, you observe that as a result of the fix you have just applied, the application throughput has increased dramatically. You return to the timeline view and now see that the CPU activity per thread is indeed higher:
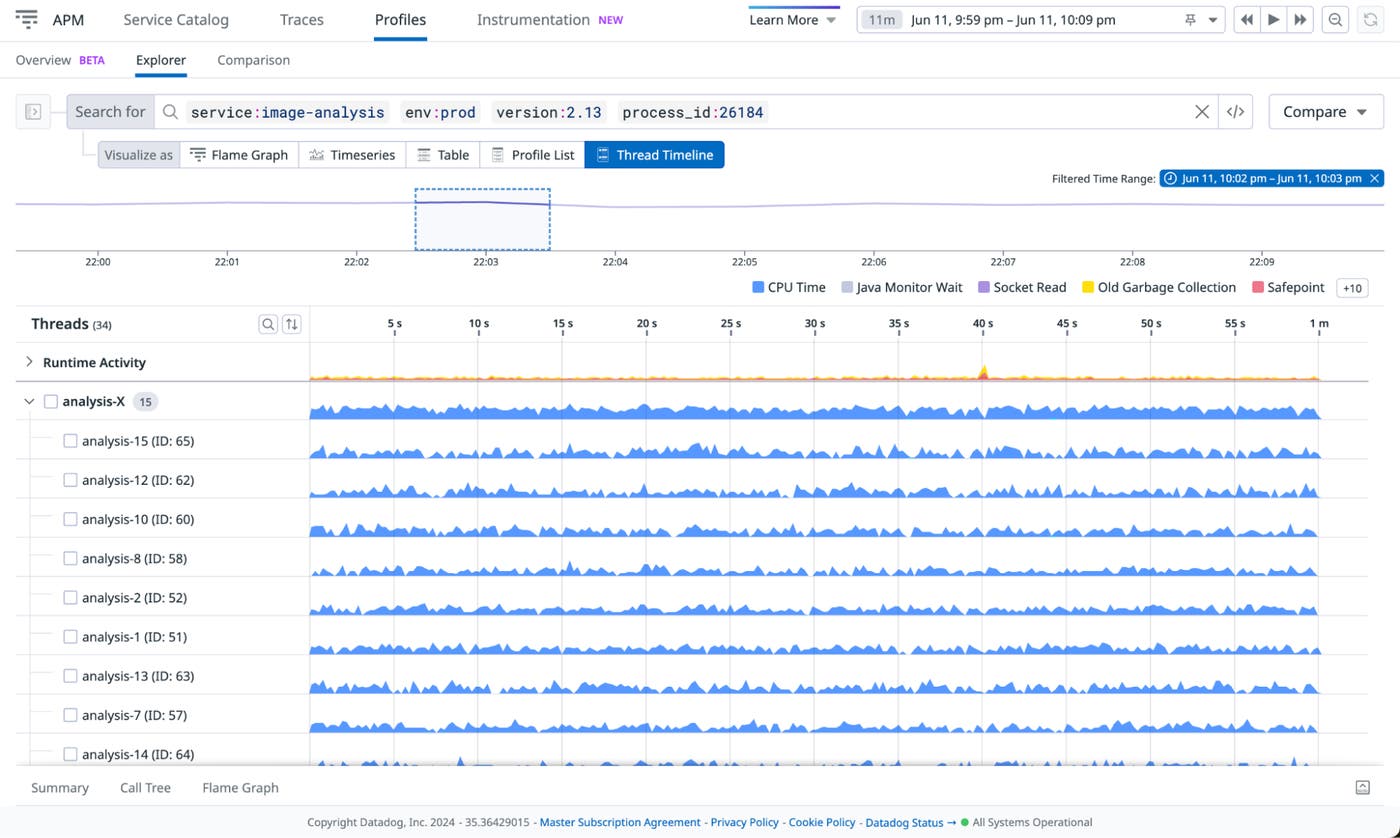
Keep in mind that even though this solution might be simple to implement, the root cause is typically very hard to detect in a normal-sized codebase. This kind of problem is also not easy to recreate in a testing environment because the bottleneck appears only under production load. By using timeline view in a live production environment, you are able to identify and address inefficiencies that previously remained hidden during staging or local testing.
Datadog APM is often a launching point for investigations, helping you identify which service or services are contributing to a slowdown observed in an APM trace. Once a problematic service is identified, typical next steps involve using Continuous Profiler’s endpoint profiling to scrutinize and optimize the average latency of an endpoint. This feature allows you to see which particular methods are the most resource-intensive and to make adjustments as needed. However, using endpoint profiling tends to be less effective to reduce p99 latency or to mitigate other performance issues for complex endpoints that parallelize work. For these cases, using the timeline view of profiling data via the Code Hotpots tab is more helpful.
For an illustration, let’s assume you begin investigating an APM trace to troubleshoot latency in a web store application. In this particular trace, you observe slow performance in the flame graph associated with the product-recommendation service (designated by the color green). Specifically, it is unclear why a delay of over five seconds occurred before it eventually made queries to user-db (in blue). This timeline is shown below, with the problematic time segment highlighted:
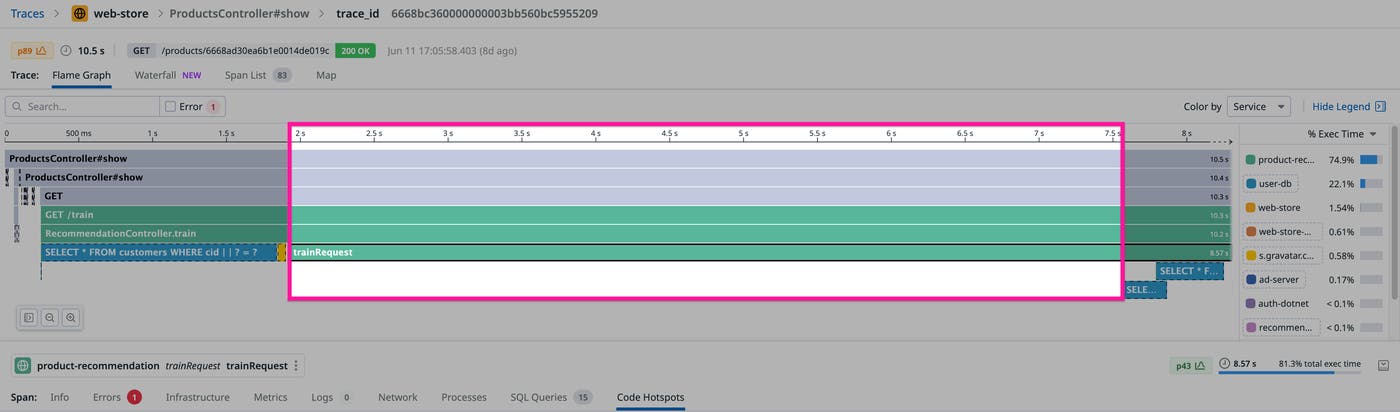
By using the Code Hotspots feature with its timeline view, you can look more closely at spans like this one that reveal high latency. You can then observe low-level activities, including I/O operations and locks, that can help you gain insights into these latency issues.
To use timeline view within Code Hotspots for this purpose, begin by selecting the span whose timeline you want to review (here, the trainRequest span), and then select the Code Hotspots tab beneath the flame graph. Next, within the timeline displayed in the Code Hotspots tab, use the selectors to narrow the focus to the problematic 5.5-second time segment where the delay occurs. This properly scopes your profiling data to the particular time segment you care about within the trainRequest span.
Note that the timeline view of this segment reveals that the majority of the five-second stretch was consumed by CPU activity (or CPU time, designated by the color blue).
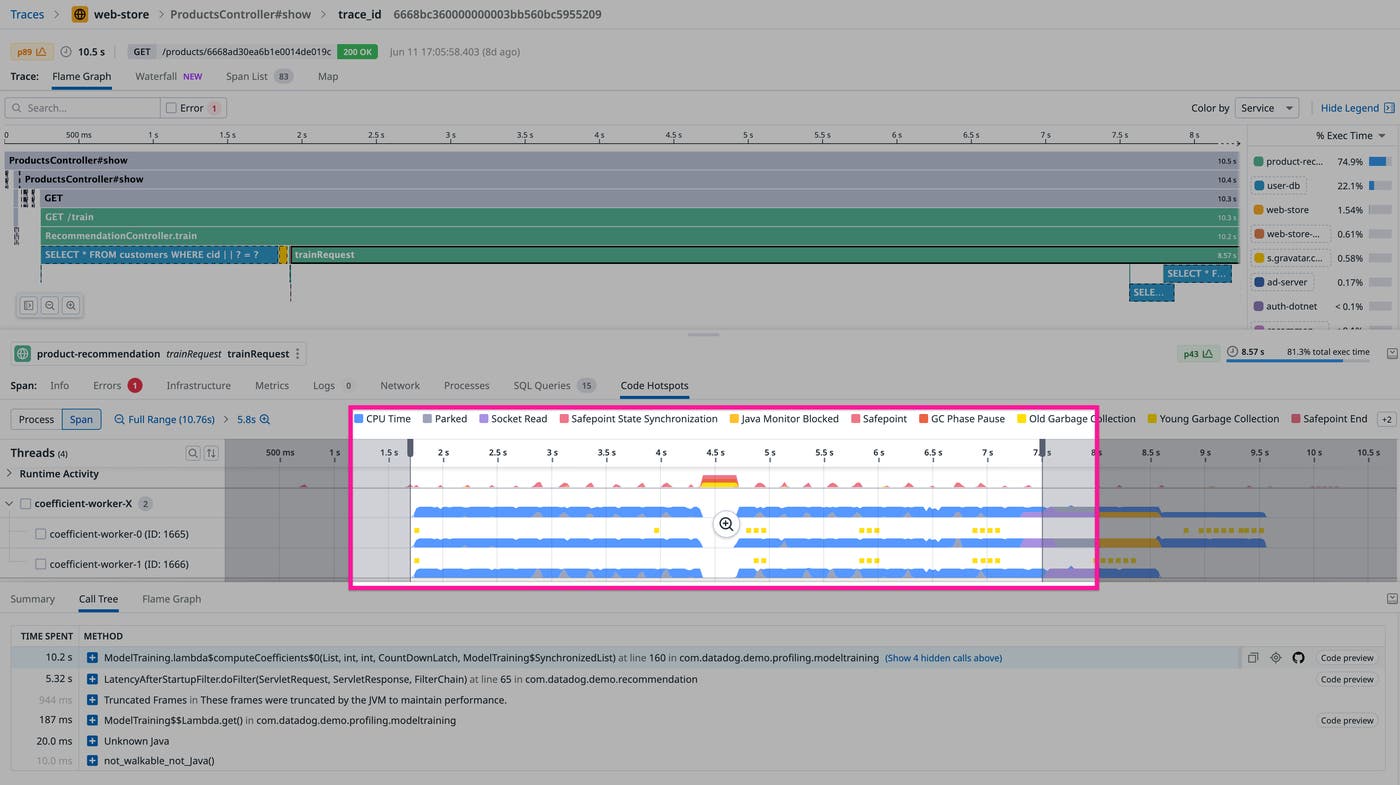
Finally, you look at the data in the Call Tree tab in the lower portion of your window. The information in the Call Tree tab indicates which methods are running during the time period you have selected, with the Time spent value representing the cumulative time spent from all worker threads.
The methods in the Call Tree tab are listed in descending order of time spent. You expand the method located at the top of the list, which is named ModelTraining.lambda$computeCoefficients. Within the 10.2 seconds spent on that method, over half—about 5.8 seconds—is spent on a single method that it calls, named ModelTraining.computeCoefficientsOnFeature(ModelTraining$Feature), at line 247. This length of time is a red flag indicating that you’ve found the problematic block of code you’ve been looking for. The source code preview connected to this latter method reveals that the time-consuming activity is occurring on the following loop:
for (int k = 0; k < result.length; k++) {
result[k] = j * k * feature.coefficients[k];
}
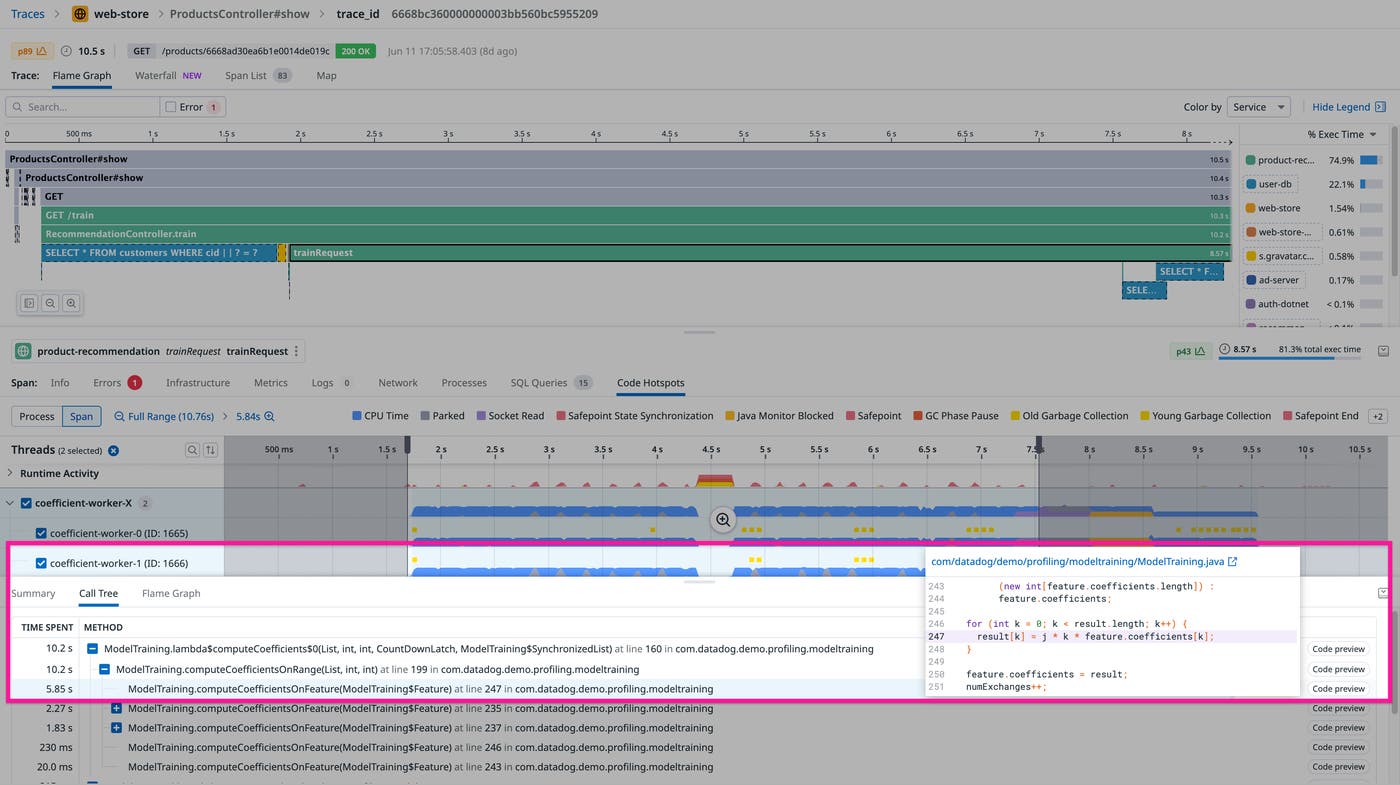
To continue along this troubleshooting path to resolve this issue, you might focus next on optimizing this code or on gathering more information with the help of Dynamic Instrumentation.
This scenario demonstrates that by using Continuous Profiler’s timeline view scoped to an APM trace, you can quickly pinpoint the exact piece of code responsible for a latency issue appearing only in your production environment. You can always perform this type of “code-level tracing” as an avenue of investigation because the Continuous Profiler runs without interruption, monitoring all activities of the profiled service. This ensures that, when the profiler is enabled, you can investigate all APM traces.
In our third scenario, let’s assume that the product-recommendation service from the second scenario runs on a Java Virtual Machine (JVM) with the Parallel Garbage Collector. In this example scenario, you observe that product-recommendation is experiencing unusual latency issues.
During an analysis of a long trace, you notice a red block within the timeline view of the Runtime Activity section. You can also see that at the same time, other threads are not executing. When you hover over the red block, a pop-up reveals that this is a GC Phase Pause or “stop-the-world” (STW) garbage collection (GC) event. This means that all application threads are stopped until this GC operation completes.
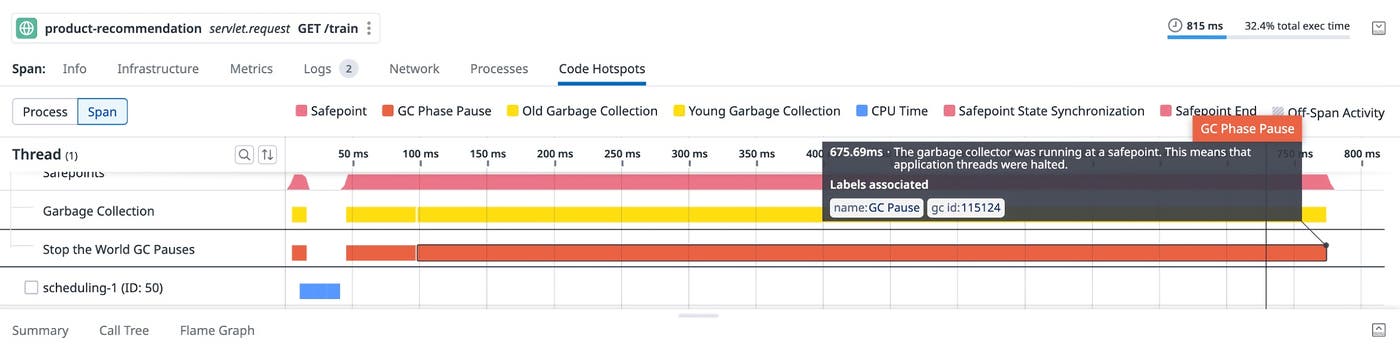
There are multiple ways to potentially mitigate this issue. For example, you could consider switching to a different GC, or seek to reduce allocated memory by analyzing the Continuous Profiler allocated memory profile.
This example demonstrates how you can use timeline view to uncover the impact of garbage collection on application performance in production. Keep in mind, however, that timeline view illuminates a wide variety of runtime activity, of which GC is just one example. Other runtime activities are also visible in timeline view, such as Just-in-time (JIT) Compilations. These areas can just as easily be a focus of troubleshooting via timeline view.
The Continuous Profiler timeline view sheds new light on the behavior of your services in production, helping you pinpoint the root causes of performance anomalies that are otherwise hard to diagnose. Seeing a chronological sequence of all runtime and code activity gives engineers more power to fine-tune their services for optimal performance. For SREs, this new feature can help them more quickly determine whether issues originate from the underlying infrastructure, the runtime activity, or the code itself.
Timeline view is now a standard feature in Datadog Continuous Profiler. If you don’t already have a Datadog account, you can sign up for a 14-day free trial to get started.
此内容由惯性聚合(RSS阅读器)自动聚合整理,仅供阅读参考。 原文来自 — 版权归原作者所有。