







If you are familiar with OpenTracing and OpenCensus, then you have probably already heard of the OpenTelemetry project. OpenTelemetry merges the OpenTracing and OpenCensus projects to provide a standard collection of APIs, libraries, and other tools to capture distributed request traces and metrics from applications and easily export them to third-party monitoring platforms. At Datadog, we’re proud to be supporters of the project, and we’re building on that to provide out-of-the-box instrumentation for your applications using OpenTelemetry’s suite of tools and our existing tracing libraries.
As part of this ongoing work, we’re excited to announce a new Python exporter for sending traces from your instrumented Python applications to Datadog, with support for exporting metrics coming soon. OpenTelemetry exporters are libraries that transform and send data to one or more destinations. The Datadog exporter enables you to integrate the OpenTelemetry tracing library into your application and seamlessly connect to other applications already instrumented with either OpenTelemetry and Datadog libraries.
In this guide, we’ll show how to instrument an application with OpenTelemetry as well as how to plug in Datadog’s new Python exporter and start collecting data.
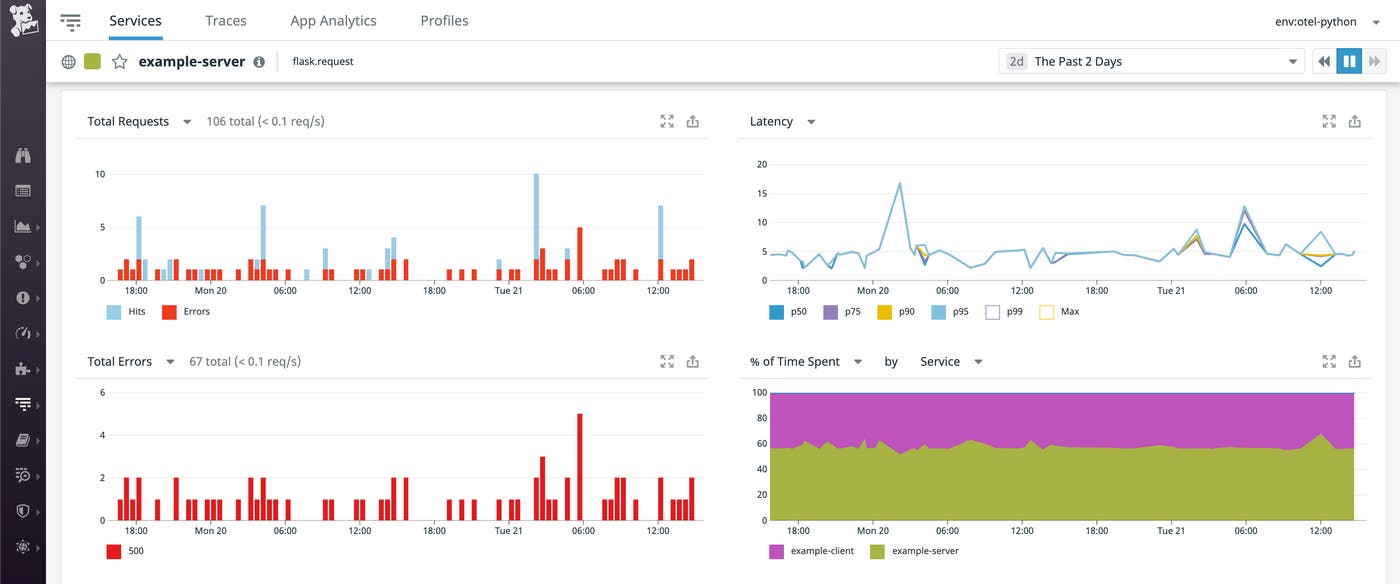
We’ll first take a look at a basic Python application that is already instrumented with OpenTelemetry.
from opentelemetry import trace
from opentelemetry.sdk.trace import TracerProvider
from opentelemetry.sdk.trace.export import (
ConsoleSpanExporter,
SimpleExportSpanProcessor,
)
trace.set_tracer_provider(TracerProvider())
trace.get_tracer_provider().add_span_processor(
SimpleExportSpanProcessor(ConsoleSpanExporter())
)
tracer = trace.get_tracer(__name__)
with tracer.start_as_current_span("span_1"):
with tracer.start_as_current_span("span_2"):
with tracer.start_as_current_span("span_3"):
print("Hello world from OpenTelemetry Python!")
The application imports modules from the OpenTelemetry API and SDK packages. The API package provides the necessary interfaces for instrumentation such as the TracerProvider, Tracer, and Span classes. With the OpenTelemetry API, developers can ship instrumented code or libraries and allow their users to easily plug in their preferred vendor backend using the OpenTelemetry SDK. The SDK package is an implementation of the API and provides the functionality for creating and exporting traces and spans. For example, the above application uses the SimpleExportSpanProcessor, which receives trace spans and sends them directly to the ConsoleSpanExporter exporter, which shows span information in your console’s output.
As part of its specification, OpenTelemetry requires both a tracer and span processor for instrumentation. The application sets the current global tracer provider with the opentelemetry.trace.set_tracer_provider and then adds the span processor to that tracer provider with trace.get_tracer_provider().add_span_processor. Finally, it uses tracer.start_as_current_span to create three spans.
Running the above application would show a JSON output in your console of a single trace with the three configured spans:
Hello world from OpenTelemetry Python!
{
"name": "span_3",
"context": {
"trace_id": "0x03daf682c3ea43db5d3efda7be2647e1",
"span_id": "0xad92ecf97088654f",
"trace_state": "{}"
},
"kind": "SpanKind.INTERNAL",
"parent_id": "0xc6bc3607c80840d7",
"start_time": "2020-07-27T13:58:54.622999Z",
"end_time": "2020-07-27T13:58:54.623071Z",
"status": {
"canonical_code": "OK"
},
"attributes": {},
"events": [],
"links": []
}
{
"name": "span_2",
"context": {
"trace_id": "0x03daf682c3ea43db5d3efda7be2647e1",
"span_id": "0xc6bc3607c80840d7",
"trace_state": "{}"
},
"kind": "SpanKind.INTERNAL",
"parent_id": "0xca376238f0dafb19",
"start_time": "2020-07-27T13:58:54.622960Z",
"end_time": "2020-07-27T13:58:54.623591Z",
"status": {
"canonical_code": "OK"
},
"attributes": {},
"events": [],
"links": []
}
{
"name": "span_1",
"context": {
"trace_id": "0x03daf682c3ea43db5d3efda7be2647e1",
"span_id": "0xca376238f0dafb19",
"trace_state": "{}"
},
"kind": "SpanKind.INTERNAL",
"parent_id": null,
"start_time": "2020-07-27T13:58:54.622878Z",
"end_time": "2020-07-27T13:58:54.623763Z",
"status": {
"canonical_code": "OK"
},
"attributes": {},
"events": [],
"links": []
}
In order to send those traces to a backend for storage and analysis, you can replace the console exporter with another compatible exporter. A key benefit to instrumenting applications with OpenTelemetry is the ability to easily plug in any exporter without needing to change your instrumentation.
Using the same application example, we’ll show how you can easily import Datadog’s Python exporter and route traces to Datadog for analysis. Note that you will need the Datadog Agent to send traces to Datadog. You can run a containerized version of the Agent to get started.
To instrument your application with Datadog, you will need to install the exporter package with the following Python command:
pip install opentelemetry-exporter-datadog
The Datadog exporter includes its own span processor and exporter, which replaces the ConsoleSpanExporter and SimpleExportSpanProcessor options in the previous example:
from opentelemetry import trace
from opentelemetry.ext.datadog import (
DatadogExportSpanProcessor,
DatadogSpanExporter,
)
from opentelemetry.sdk.trace import TracerProvider
[...]
The Datadog span processor is responsible for preparing OpenTelemetry traces for the Datadog exporter to send to the Agent. It’s important to note that while the OpenTelemetry specification supports exporting individual spans as they are finished or as batches of arbitrary spans as they are queued up, the Datadog Agent expects to receive spans as parts of complete traces.
You can forward traces to the Datadog Agent by first configuring the DatadogSpanExporter with parameters for a service name and a URL endpoint the Agent listens to for traces. Then you can pass the configured exporter to the span processor, as seen below:
#import packages
[...]
trace.set_tracer_provider(TracerProvider())
trace.get_tracer_provider().add_span_processor(
DatadogExportSpanProcessor(
DatadogSpanExporter(
agent_url="http://localhost:8126", service="dd_tracing_example"
)
)
)
tracer = trace.get_tracer(__name__)
[...]
Datadog will submit each trace when all of its spans are finished and append the service name as a tag that you can use to search on in Datadog APM.
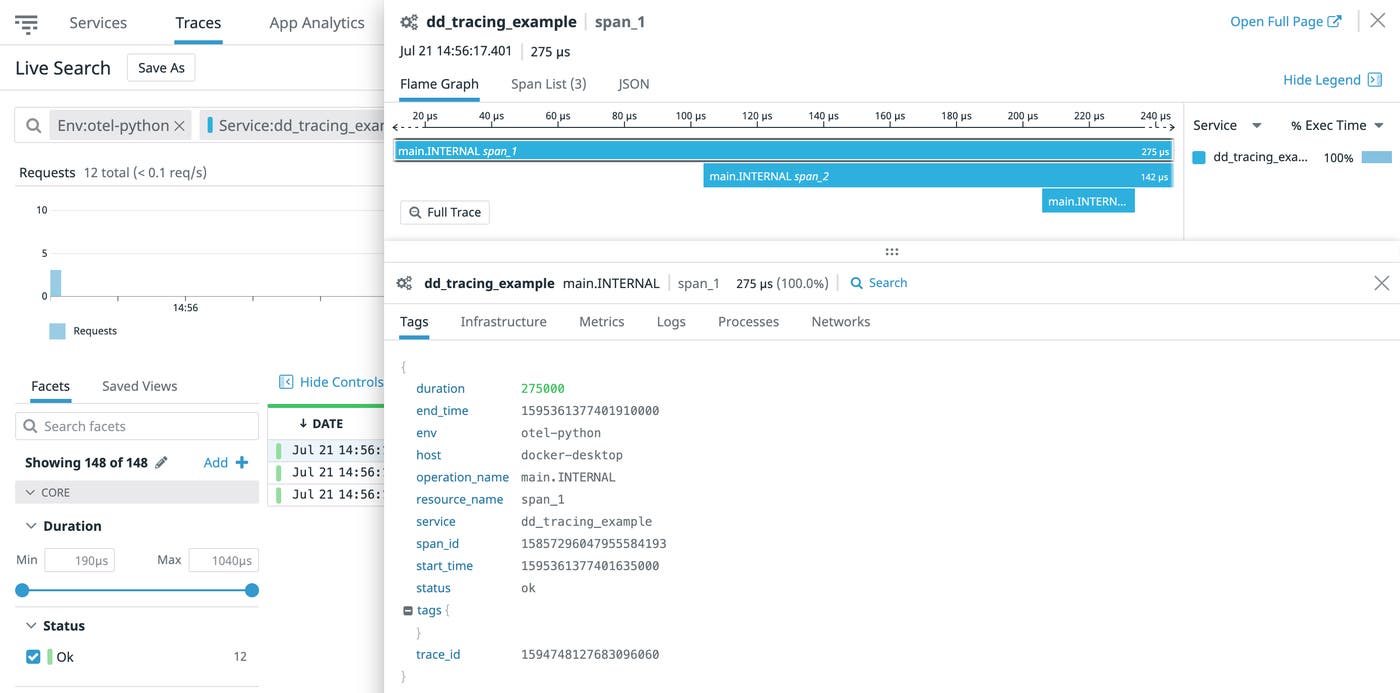
This is a simple example of how easy it is to incorporate Datadog’s Python exporter into a Python application, but a key benefit of instrumentation is following request traces across service boundaries in more complex applications. Next, we’ll show how to do this in a Flask application and visualize its distributed traces in Datadog.
Flask is a web framework for Python applications, and both OpenTelemetry and Datadog instrumentation libraries work together seamlessly to track requests across Flask and other Python service boundaries. We’ll show how to instrument a simple Flask client-server application using Datadog’s Python exporter using this guide.
The Flask server example below creates a single /server_request endpoint that parses a param query parameter and raises an exception if the word “error” is used as the parameter:
#package imports
#initialize exporter
[...]
@app.route("/server_request")
def server_request():
param = request.args.get("param")
with tracer.start_as_current_span("server-inner"):
if param == "error":
raise ValueError("forced server error")
return "served: {}".format(param)
if __name__ == "__main__":
app.run(port=8082)
The snippet below shows a Flask client that allows users to pass a parameter to the /server_request route:
#package imports
#initialize exporter
[...]
with tracer.start_as_current_span("client"):
with tracer.start_as_current_span("client-server"):
headers = {}
propagators.inject(dict.__setitem__, headers)
requested = get(
"http://localhost:8082/server_request",
params={"param": argv[1]},
headers=headers,
)
assert requested.status_code == 200
print(requested.text)
To generate traces, you can start the Flask server and make requests to the service via the instrumented client:
#start flask server & make requests
opentelemetry-instrument python server.py
opentelemetry-instrument python client.py testing
You can also generate error traces by passing in the “error” argument to the client:
opentelemetry-instrument python client.py error
Note that the application will generate an AssertionError if you do not include an argument. Datadog will receive three spans from two services: one server-side span and two client-side spans. These spans are automatically connected in one trace through context propagation, which passes information, such as request headers, across services. In the example client code above, that is done through the propagators.inject() call. In application architectures that leverage a collection of loosely coupled services (i.e., microservices), context propagation is critical for following a request end to end.
Once you have traces flowing from your instrumented application into Datadog, you can query and analyze them in Datadog APM. You can get an overview of all your traces with Live Search, as seen below.
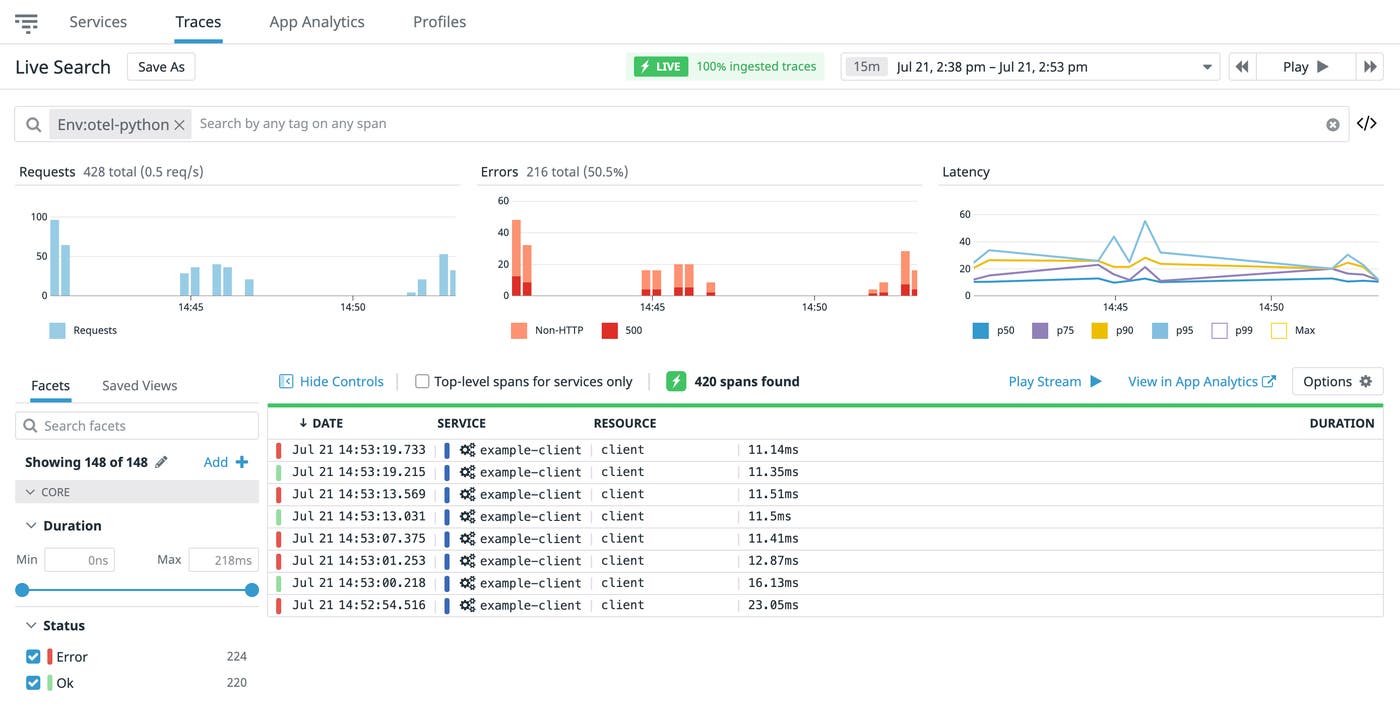
From this list, you can select a single trace to view more details such as a breakdown of traces with flame graphs. Flame graphs show the duration of each individual span within each trace so you can easily troubleshoot application bottlenecks or latency. For example, you can use flame graphs to debug the slowest endpoints of your Flask application or troubleshoot server errors.
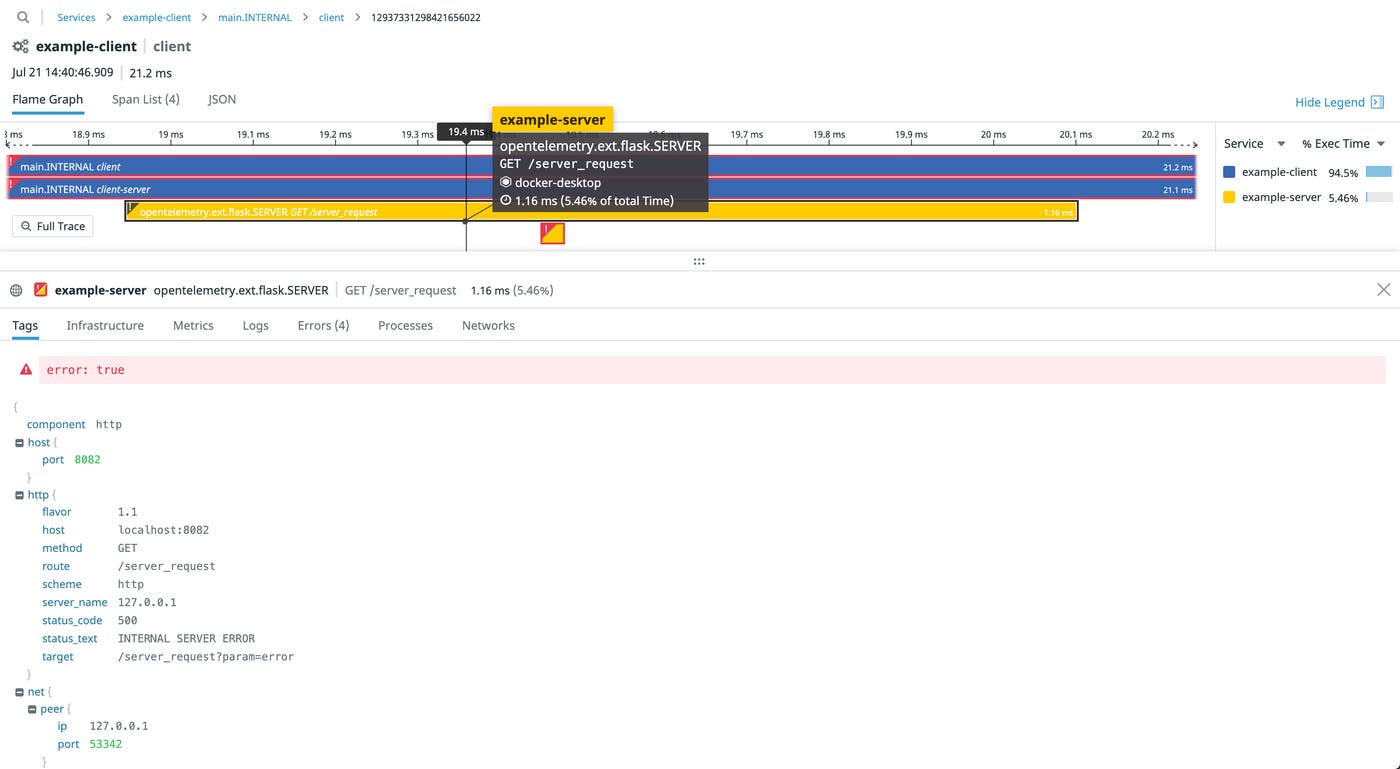
With Datadog’s Python exporter, you can start monitoring your instrumented Python applications and get deeper insights into each of your application services. We also have exporters for tracing your Ruby and JavaScript applications, with support for Java and .Net coming soon. Read our documentation to learn more about Datadog’s other available tracing libraries, or sign up for a free trial today to start collecting telemetry data from your instrumented applications.
此内容由惯性聚合(RSS阅读器)自动聚合整理,仅供阅读参考。 原文来自 — 版权归原作者所有。