






Cloud environments generate high volumes of security signals every day. With each one, you have to determine if it’s benign, a clear false positive, or something worth investigating. The challenge is needing to make these calls continuously, often without knowing whether any single event is part of a larger attack. Spending too much time investigating benign activity reduces the ability to detect threats elsewhere, and missing a legitimate threat has clear consequences.
How can you take advantage of AI’s advanced processing capabilities in a way that enables you to analyze and investigate threats more effectively than you can through existing workflows? If we assume the models themselves are good, AI can improve threat analysis, but not without careful planning. Its ability to successfully analyze and investigate threats depends on enforcing the same underlying data discipline required for effective cloud monitoring, particularly around generating consistent telemetry data.
In this post, we’ll discuss how to design cloud environments for AI-powered threat analysis. But first, we’ll look at what AI can do well in threat analysis and where it falls short.
When an attacker targets a cloud environment, their activity is rarely represented in a single event. Instead, their attack paths span multiple events that are connected by different identities, services, resources, and timeframes. Finding threads worth investigating requires sifting through flagged events and other signals generated at around the same time to find connected activity. Two of AI’s strongest use cases for threat analysis address this very issue by finding patterns in and surfacing risks from large amounts of data, such as cloud security signals.
One way that AI is able to accomplish this level of analysis is via User and Entity Behavior Analytics (UEBA). UEBA identifies compromised cloud identities based on historical behavioral patterns, which are only made visible through data recorded about your environment. Your system, user activity, and network traffic logs, along with other telemetry data like application metrics, establish a baseline for what happens in your environment. UEBA uses that data to determine if a particular identity’s behavior is unusual compared to its long-term patterns. This method of analysis tends to generate more accurate conclusions about activity than is possible when teams merely read signals based on fixed conditions or thresholds alone.
AI can improve threat analysis and investigations by automatically connecting activity, but it can fail in predictable ways. For example, AI can mislead investigations by generating confident but inaccurate conclusions (hallucinations). This typically happens when it has to make assumptions about an event, which is why it’s important that conclusions are always tied back to specific events, identities, and resources.
Incomplete telemetry data and poorly defined context can look like the following:
Missing authentication, API, or audit events
Unstructured logs without clear sources or outcomes
Inconsistent tagging for services, identities, and resources
Overly broad permissions
AI also struggles to account for behavior that does not resemble historical patterns, which can include novel threats and new operational workflows. And even when behavior isn’t new, AI can misclassify it as anomalous activity if that system lacks a clear definition of what your organization considers expected behavior. The key idea here is that your environment’s security design heavily influences the accuracy of AI-powered threat analysis.
Your cloud environment needs to give AI a clear picture of what typical behavior looks like and enough context to trace what’s actually happening. The first benchmark depends on how well you scope cloud identity permissions. Clearly defined boundaries give AI the baselines it needs to identify any deviations in cloud activity. The second benchmark depends on the telemetry data your environment generates—for example, audit, authentication, and network logs enriched with ownership metadata—which AI uses to connect individual signals into a reliable trail for investigation.
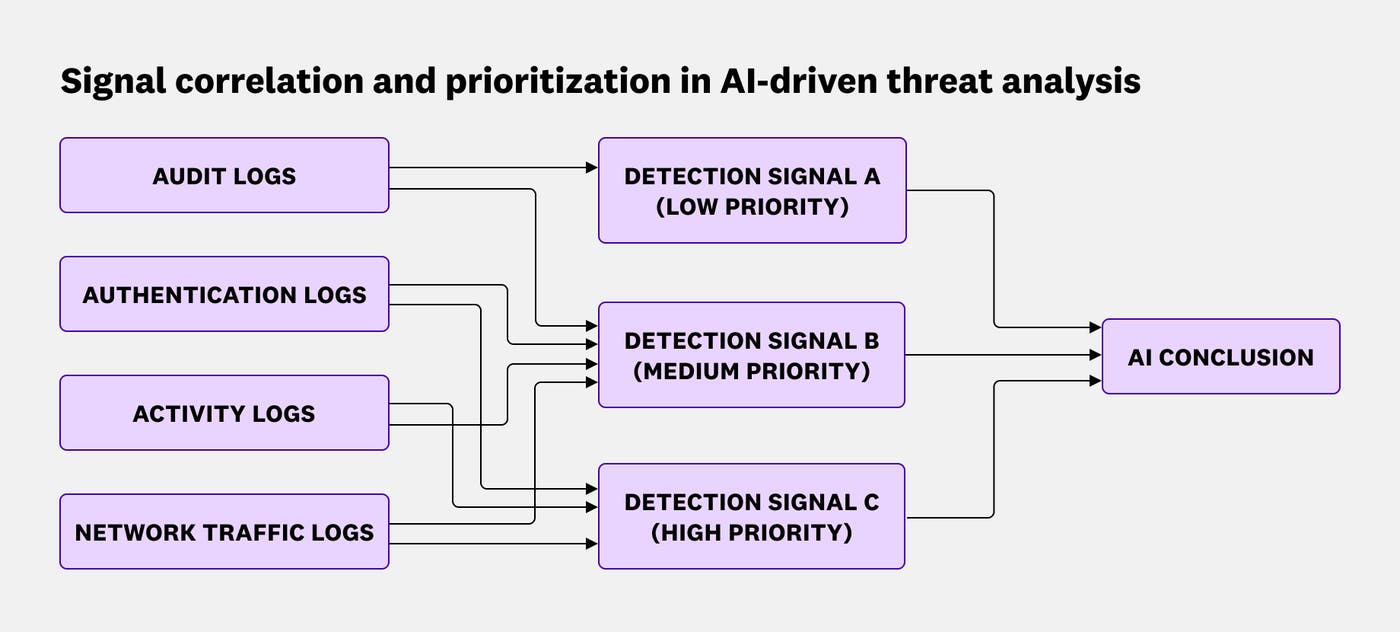
For approaches like UEBA, baselines are established by how cloud identities behave in your environment. They learn from what happens most often, regardless of whether that behavior is risky or appropriate. When identities have overly broad permissions or routinely act outside their intended scope, AI may treat that activity as normal.
The main factor for improving AI conclusions is whether expectations for typical activity are well defined. To illustrate, consider a cloud environment with a custom administrative role. Scoping behavior for this privileged role might require answering the following questions:
Which identities are allowed to perform administrative actions associated with this role?
How often should administrative actions happen? Is it routine or expected only during specific time frames?
Where do these types of actions typically happen? For example, do they tend to occur in specific regions or networks?
For these types of actions, which resources should the associated identities typically access?
Which anomalies, activity thresholds, and locations should be considered suspicious?
The answers to these questions create a playbook for the role’s expected behavior, and approaches like UEBA can use it to further improve its analysis. For instance, instead of applying static thresholds to every identity, UEBA builds individual profiles and generates risk scores, which determines the signals worth prioritizing for investigation. The higher the score, the more likely an identity is to be a security risk. If a high-risk identity with that administrative role rarely accesses storage buckets, UEBA will flag the identity if it suddenly does. This kind of analysis wouldn’t be possible without a clear understanding of what activity should be allowed in your environment.
Besides needing clear guidelines for what should happen in your environment, AI needs identifiers and ownership context to create a cohesive picture of what actually is happening. You can provide that context through logs and tags, which work together to link cloud activity back to their source identities.
Your cloud environment likely already collects audit, authentication, and other activity logs from a wide variety of sources. There are established best practices for collecting the right cloud logs, but at a minimum, they should all capture who performed an action, what action was taken, what the outcome was, and when it occurred. To connect these logs back to a source, you can enrich them with metadata tags that define ownership—for example, by service, team, or resource.
To understand how logs and tags work together to improve threat analysis, consider an attack path that starts with a compromised Entra ID user. The attacker identifies an enterprise application with elevated privileges that the account already owns. By modifying that application’s credentials, the attacker then pivots from the compromised user to the application’s service principal. This step would enable them to later connect to other Azure services beyond what the initial user had access to.
How might this attack path show up in day-to-day signals? The attacker’s actions all generate various types of security signals—for authentication attempts, API calls, configuration changes, and other activity—which you have to review to reconstruct their path. One such signal could capture an attacker adding credentials to an Azure AD application:
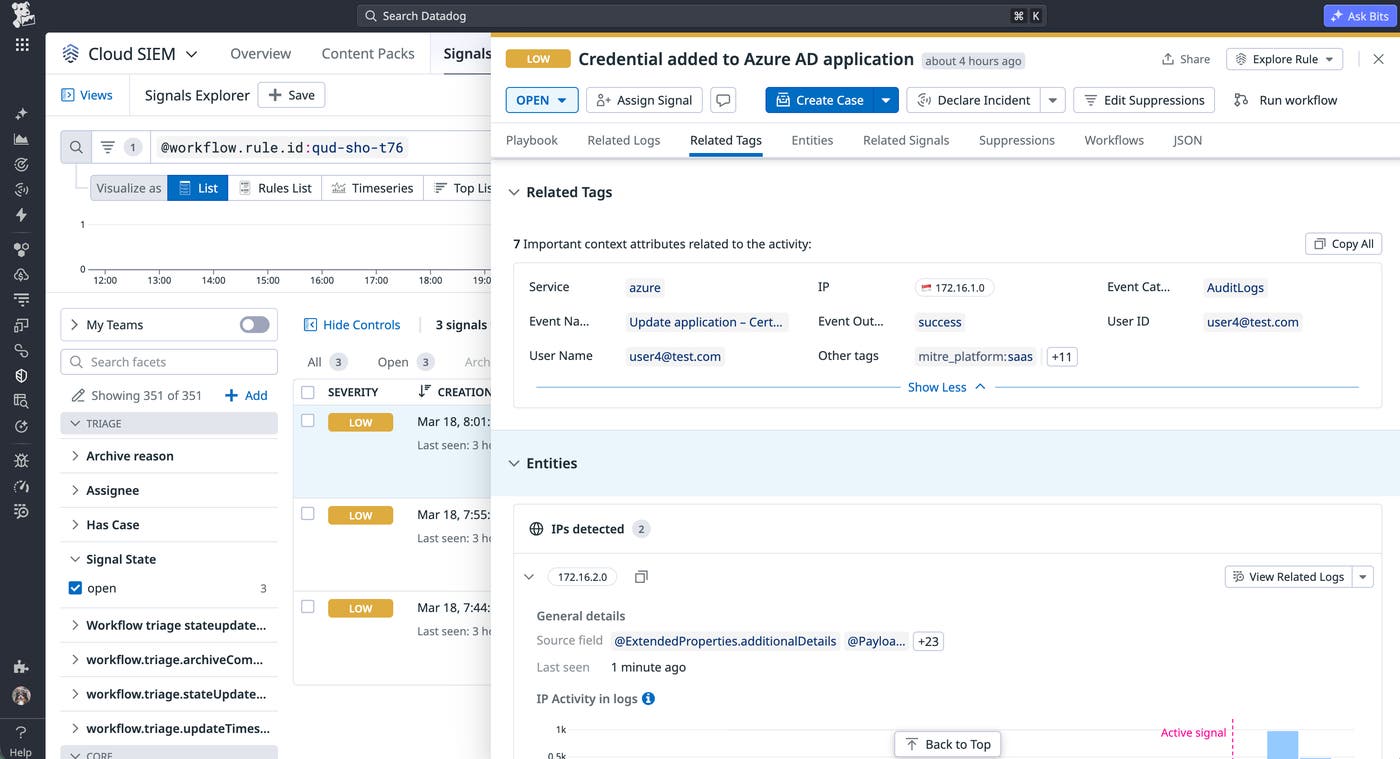
The logs that triggered the signal recorded what happened while the available tags tied the event back to relevant context, such as the specific user ID that added the credential. Creating this thread improves AI’s ability to review other related signals and activity in order to generate more accurate conclusions about the risk. For example, if the UEBA profile for this identity has established that it doesn’t typically add credentials to Azure AD applications, this generated signal indicates a risk worth flagging as suspicious.
AI improves threat analysis by helping you make better decisions about what to investigate, but its conclusions rely on adequate telemetry data and context. Gaps in logging, inconsistent metadata, and cloud misconfigurations not only limit visibility into your environment but also increase the risk of overlooking legitimate threats. When you define consistent, easy-to-interpret telemetry data and clear security controls for your cloud environment, AI can help you focus on the signals that matter most.
For more information about how to secure and monitor your cloud environment, read about Datadog’s security monitoring capabilities. If you’re new to Datadog, you can sign up for a free 14-day trial.
此内容由惯性聚合(RSS阅读器)自动聚合整理,仅供阅读参考。 原文来自 — 版权归原作者所有。