










When you deploy an LLM-powered application, you make assumptions about how users will interact with it. In practice, production traffic rarely matches those assumptions. Users ask questions outside the intended scope, shift goals mid-conversation, and develop workflows the application was never designed to support. At the same time, patterns that worked well at launch can quietly degrade: Costs creep up in specific interaction categories, evaluation scores drop for a subset of requests, or a cluster of behavior that was once predictable starts growing faster than everything else.
Individual trace review can surface that something is wrong, but it can’t tell you which behaviors—including what types of questions users are asking, and what kinds of outputs your agents generate—are associated with the regression, or reveal interaction patterns you didn’t know existed in the first place. The result is that teams end up investigating symptoms without a clear view of the underlying user behavior driving them.
Patterns in Datadog Agent Observability gives you that view, helping you answer two important questions about production traffic: What are users trying to do that the application was not designed for, and what behaviors have meaningfully changed over time? Patterns automatically clusters production interactions into hierarchical topics that give you an interpretable view of your agents’ production behavior, including user input and agent responses, without requiring predefined categories or manual labeling. This enables you to see actual trends in how users are engaging with your application and how your agents are behaving, including workflows, tool calls, and other behaviors you didn’t anticipate. Each cluster surfaces cost, latency, error rate, and evaluation coverage benchmarked against your other patterns, so the interactions driving quality and cost issues are immediately visible.
In this post, we’ll look at how Patterns helps you:
Understand how users are actually interacting with your LLM application
Identify behavioral patterns that are driving quality, latency, and cost issues
Build evaluations and datasets around the interactions that matter most
Many teams think about their LLM applications in terms of a few primary workflows, but production traffic tends to contain many more distinct interaction patterns than expected. For example, a customer support assistant might support billing questions, account changes, troubleshooting requests, onboarding guidance, and escalation handling, all with multiple variations inside each category. Some of these interaction types may never have been represented in evaluation datasets or preproduction testing.
This gap becomes difficult to detect through traditional trace analysis alone. Filtering traces by errors or latency can reveal that something is wrong, but it does not explain if the category of user behavior was tested for in preproduction. Teams often need to manually inspect hundreds of traces before they can identify a recurring pattern.
Patterns addresses this problem by automatically clustering production interactions into groups with thematic similarity. These clusters help you understand how users are actually using your application, including workflows and requests that were never anticipated during development.
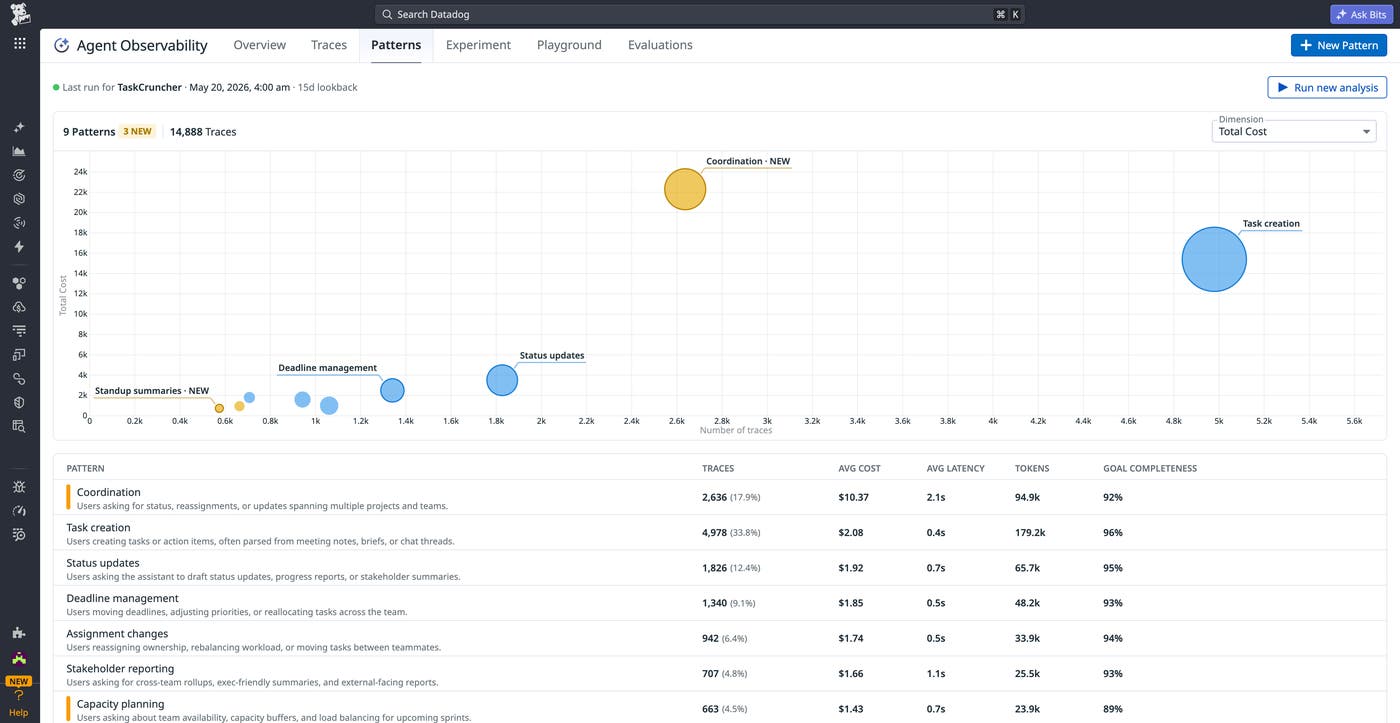
Patterns organizes interactions into clusters: hierarchical topic structures that can represent both broad and narrow categories of behavior. For example, a top-level “billing questions” cluster might contain nested subcategories such as “subscription changes,” “refund requests,” and “cancellation requests.”
Because Patterns is built directly into Datadog Agent Observability, every cluster includes operational and quality context alongside the behavioral grouping itself. You can immediately compare metrics such as traffic volume, latency, cost per interaction, error rate, and evaluation scores against the norms established in other behavioral patterns to identify meaningful outliers.
This context becomes especially important when investigating changes in application behavior over time. A pattern that suddenly increases in volume or begins generating higher costs may indicate a shift in user expectations, a regression in agent behavior, or a new workflow emerging in production traffic.
Behavioral clustering becomes most valuable when you can connect patterns directly to operational and quality signals. A cluster with higher-than-average latency, a spike in failed evaluations, or rapidly increasing token costs can point to a specific category of interactions that deserves deeper analysis.
Patterns helps you move from broad symptoms to concrete investigation targets. Instead of asking why evaluation scores dropped globally, you can identify the specific interaction clusters associated with the regression. Similarly, instead of reviewing expensive traces individually, you can identify which categories of conversations are responsible for rising inference costs.
The pattern detail view provides additional context to help you investigate these issues. You can analyze trends over time for a specific cluster, inspect the most common tool calls and prompts associated with the pattern, and review evaluation pass and fail breakdowns for each evaluator attached to the traffic. This makes it easier to isolate whether failures are tied to a particular retrieval step, prompt structure, or downstream tool invocation.
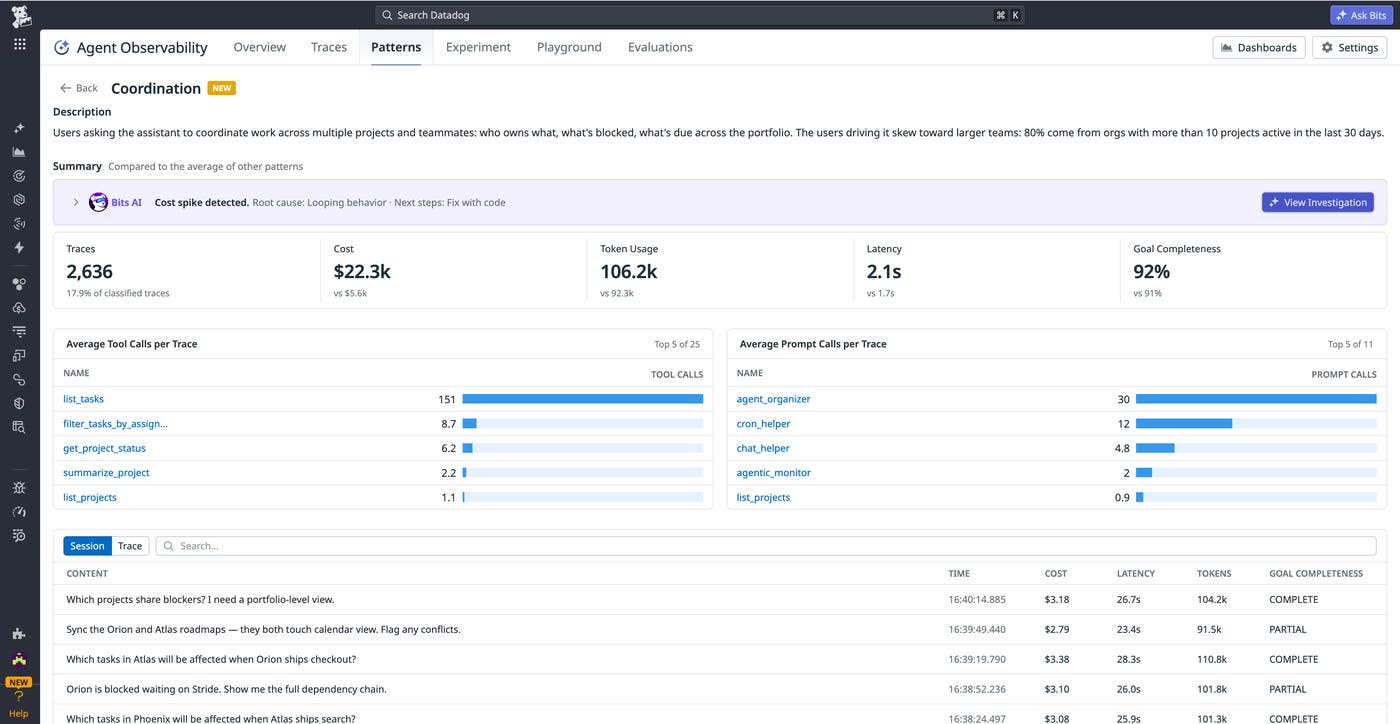
Patterns also highlights clusters that do not currently have evaluation coverage. These uncovered patterns can represent blind spots in your approach to evaluating and maintaining quality, especially when they correspond to high-volume or high-cost interactions. By surfacing these gaps directly in the workflow, Patterns enables you to identify where additional evaluations or datasets are needed before issues become larger production incidents.
For structured assistants and workflow-driven agents, the most valuable patterns are often the ones that teams did not anticipate. Users may ask questions outside the supported scope of the application, shift goals midway through a conversation, or request actions that the agent cannot currently perform. These interactions expose capability gaps that are difficult to identify through synthetic testing alone.
Because Patterns runs continuously against your production traffic, it helps you understand when something shifts in your application. For example, users might repeatedly ask a support assistant for troubleshooting guidance that requires external documentation, or they may attempt follow-up workflows that depend on long-term conversational memory. These recurring requests can point teams toward concrete improvements such as adding new tools, expanding prompt instructions, or improving session memory. Patterns will also cluster on trends in agent behavior, helping you spot unexpected tool calls or agent responses.
At the same time, Patterns helps you identify behavioral drift across existing workflows. A cluster that suddenly grows faster than others, produces more errors, or consumes significantly more tokens may indicate changing user expectations or unintended changes in application behavior.
From either starting point, the next step is often the same: understanding whether the relevant production traffic is represented in datasets and evaluation workflows. Patterns helps you identify how much evaluation coverage exists for a given cluster and where measurement remains limited.
You can then create datasets directly from representative traces inside a specific pattern and attach evaluators that target the associated behavior.
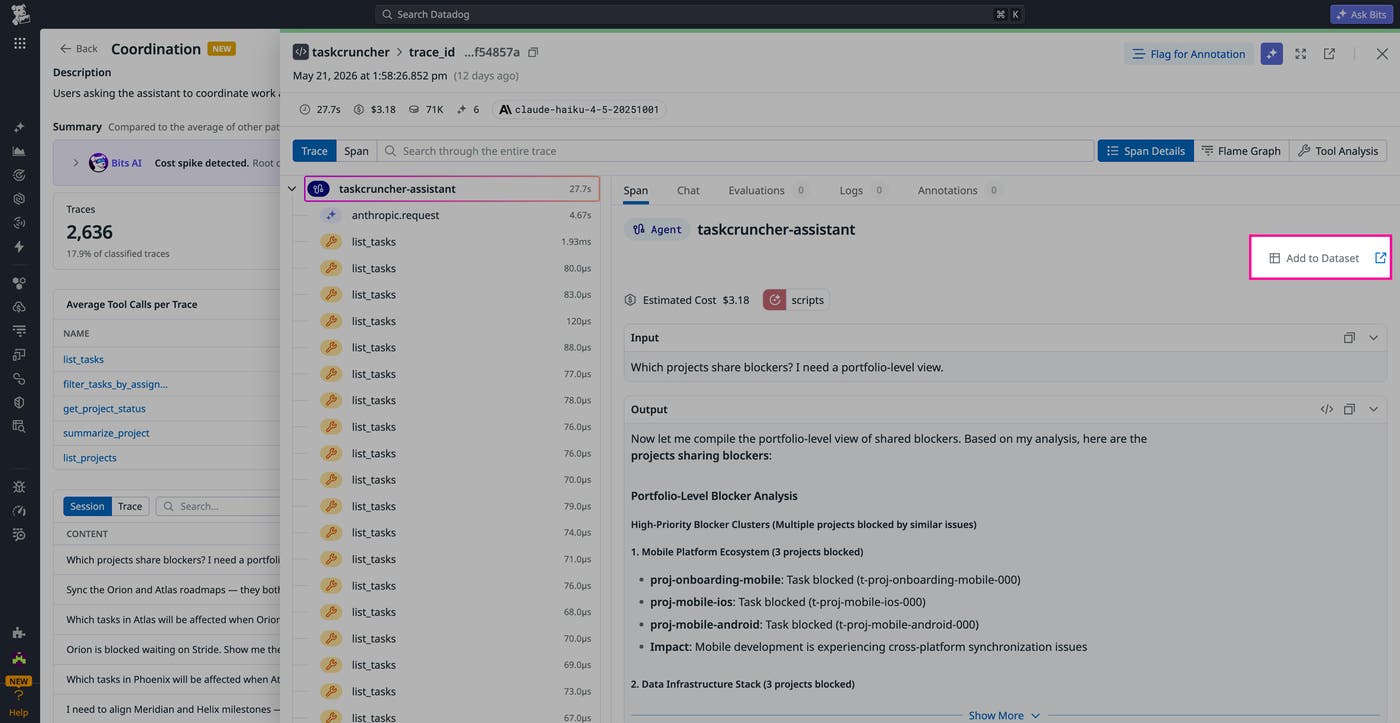
This approach helps you align your quality infrastructure with the interactions users are actually having in production, instead of relying exclusively on datasets built from synthetic tests, which may not generalize well to real traffic. By building evaluations around production behavior, you can improve coverage for emerging workflows, monitor regressions more effectively, and prioritize quality improvements based on real user interactions.
Patterns in Agent Observability helps you understand how users are actually interacting with your LLM applications in production. By automatically clustering interactions into behavioral groups and correlating those patterns with operational and quality signals, Patterns makes it easier to investigate regressions, identify capability gaps, and prioritize evaluation coverage around the workflows that matter most.
To get started, read the Patterns documentation and request access to the Preview. If you’re new to Datadog, you can sign up for a 14-day free trial.
此内容由惯性聚合(RSS阅读器)自动聚合整理,仅供阅读参考。 原文来自 — 版权归原作者所有。