


This is the final post in a three-part series about MySQL monitoring. Part 1 explores the key metrics available from MySQL, and Part 2 explains how to collect those metrics.
If you’ve already read our post on collecting MySQL metrics, you’ve seen that you have several options for ad hoc performance checks. For a more comprehensive view of your database’s health and performance, however, you need a monitoring system that continually collects MySQL statistics and metrics, that lets you identify both recent and long-term performance trends, and that can help you identify and investigate issues when they arise. This post will show you how to set up comprehensive MySQL monitoring by installing the Datadog Agent on your database servers. We’ll also discuss how you can use Datadog Database Monitoring to view historical query performance metrics, explain plans, and other query-level information.
As explained in Part 1, MySQL exposes hundreds of valuable metrics and statistics about query execution and database performance. To collect those metrics on an ongoing basis, the Datadog Agent connects to MySQL at regular intervals, queries for the latest values, and reports them to Datadog for graphing and alerting.
Installing the Agent on your MySQL server is easy: it usually requires just a single command, and the Agent can collect basic metrics even if the MySQL performance schema is not enabled and the sys schema is not installed. Installation instructions for a variety of operating systems and platforms are available here.
Once the Agent is installed, you need to grant it access to read metrics from your database. In short, this process has four steps:
Create a datadog user in MySQL and grant it permission to run metric queries on your behalf.
In the conf.d/mysql.d directory, you will find a sample MySQL configuration file called conf.yaml.example. Copy this file to conf.yaml.
Add the login credentials for your newly created datadog user to conf.yaml.
Restart the Agent.
The MySQL configuration tile in the Datadog app has the full instructions, including the exact SQL commands you need to run to create the datadog user and apply the appropriate permissions.
Out of the box, Datadog collects more than 60 standard metrics from modern versions of MySQL. Definitions and measurement units for most of those standard metrics can be found here.
Starting with Datadog Agent version 5.7, many additional metrics are available by enabling specialized checks in the mysql.d/conf.yaml file (see the example configuration template for context):
# options:
# replication: false
# replication_channel: <CHANNEL_NAME>
# replication_non_blocking_status: false
# galera_cluster: false
# extra_status_metrics: true
# extra_innodb_metrics: true
# extra_performance_metrics: true
# schema_size_metrics: false
# disable_innodb_metrics: false
To collect average statistics on query latency, as described in Part 1 of this series, you will need to enable the extra_performance_metrics option and ensure that the performance schema is enabled. The Agent’s datadog user in MySQL will also need the additional permissions detailed in the MySQL configuration instructions in the Datadog app.
Note that the extra_performance_metrics and schema_size_metrics options trigger heavier queries against your database, so you may be subject to performance impacts if you enable those options on servers with a large number of schemas or tables. Therefore you may wish to test out these options on a limited basis before deploying them to production.
Other options include:
extra_status_metrics to expand the set of server status variables reported to Datadog
extra_innodb_metrics to collect more than 80 additional metrics specific to the InnoDB storage engine
replication to collect basic metrics (such as replica lag) on MySQL replicas
To override default behavior for any of these optional checks, simply uncomment the relevant lines of the configuration file (along with the options: line) and restart the Agent.
The specific metrics associated with each option are detailed in the source code for the MySQL Agent check.
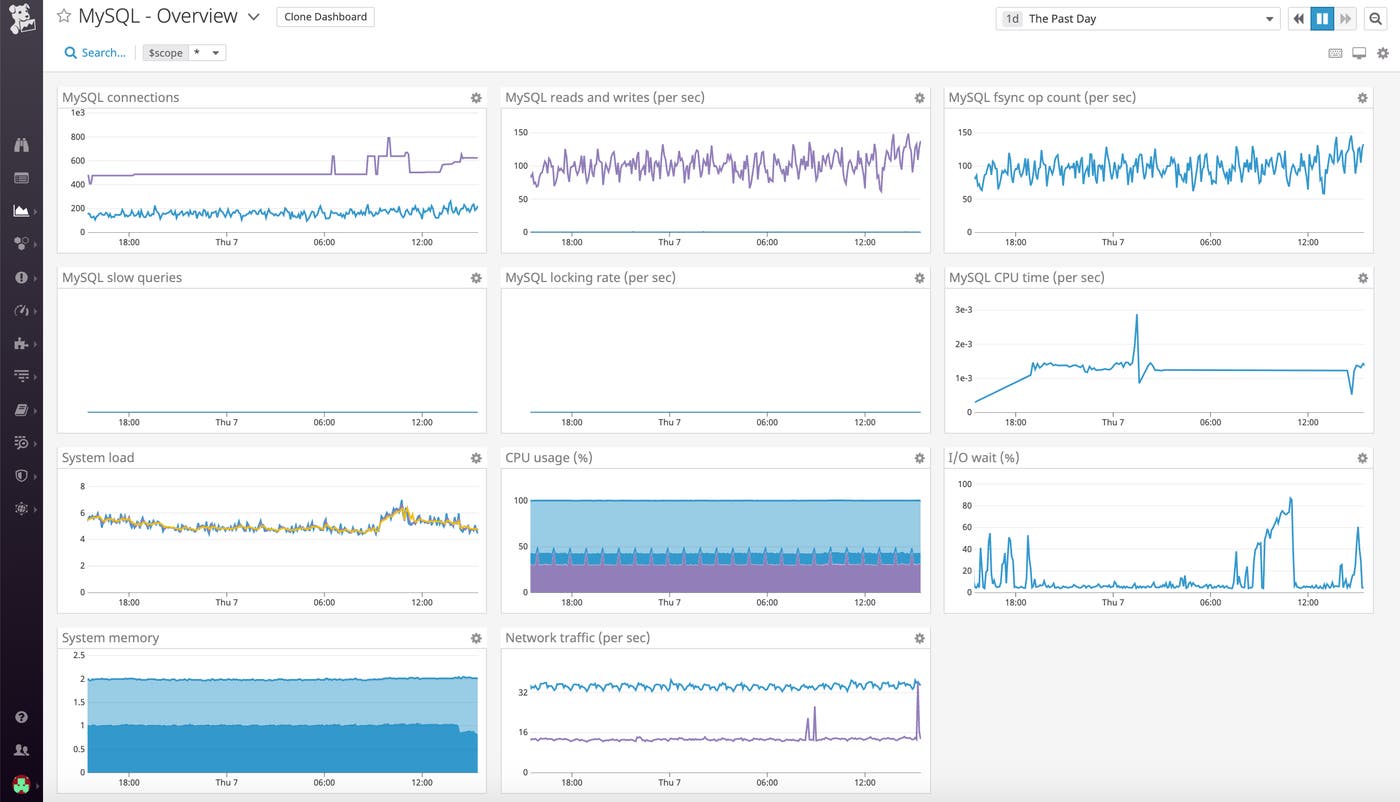
Once you have integrated Datadog with MySQL, a comprehensive dashboard called “MySQL - Overview” will appear in your list of integration dashboards. The dashboard gathers key MySQL metrics highlighted in Part 1 of this series, along with server resource metrics, such as CPU and I/O wait, which are invaluable for investigating performance issues.
The Datadog Agent can also collect metrics from the rest of your infrastructure so that you can correlate your entire system’s performance with metrics from MySQL. The Agent collects metrics from Docker, NGINX, Redis, and more than 1,000 other applications and services. You can also easily instrument your own application code to report custom metrics to Datadog using StatsD.
To add more metrics from MySQL or related systems to your MySQL dashboard, simply clone the template dashboard by clicking on the gear in the upper right.
Datadog Database Monitoring (DBM) helps you get even deeper visibility into your MySQL databases by providing historical query performance metrics, explain plans, host-level metrics, and more. Getting up and running with DBM requires just a few additional configuration steps, which you can find in our documentation.
Once you’ve enabled DBM, simply navigate to the Databases view to begin monitoring the performance of normalized queries across all of your databases. As shown in the screenshot below, you can sort your normalized queries by key statistics, such as the number of executions, average execution time, and the number of rows returned, which can help surface inefficiencies.
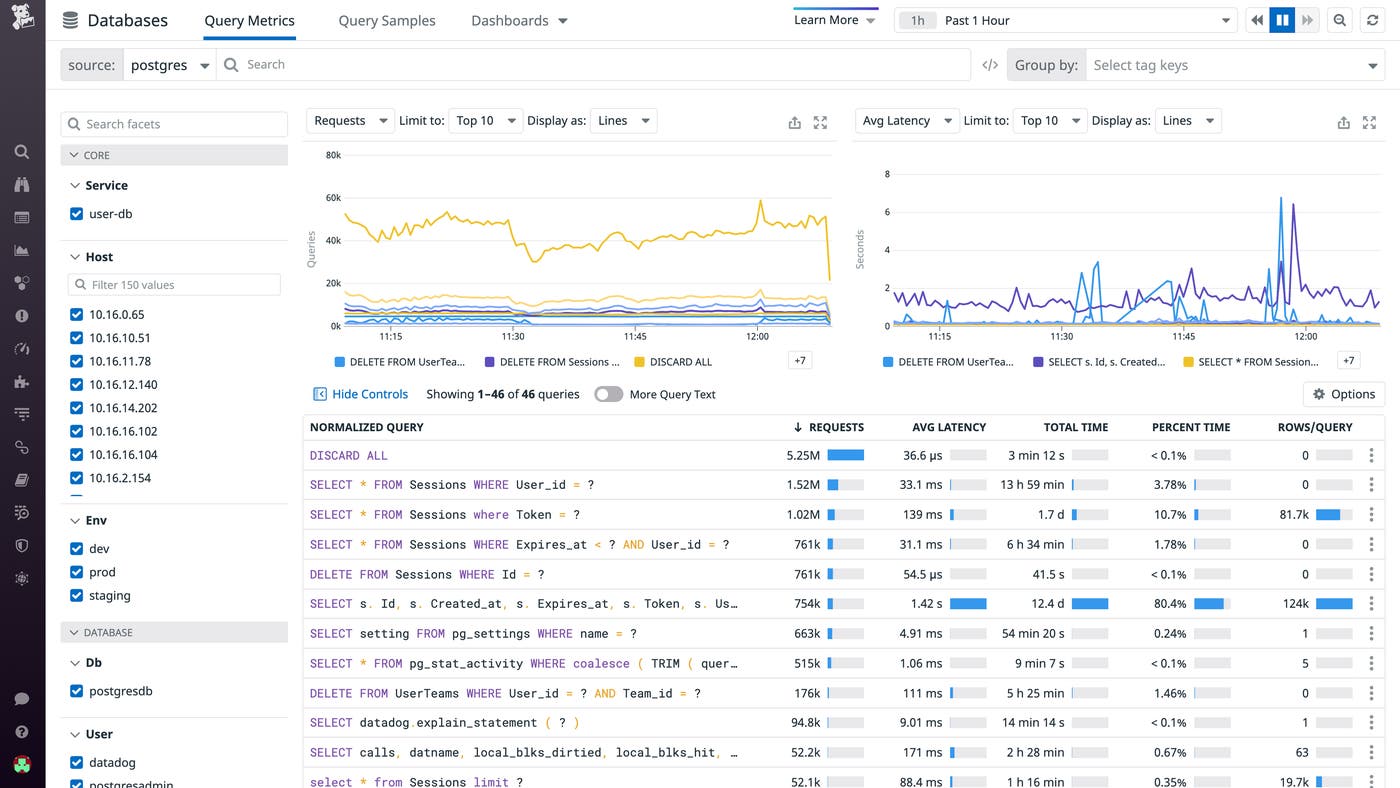
You can click on any problematic query to open the Query Details panel, which includes a wealth of information that can help with troubleshooting. For instance, you can examine the query’s explain plans, which are step-by-step breakdowns of how the query planner has decided to execute it. Explain plans show you which steps are the most expensive, so you can pinpoint areas of your code in need of optimization. The Query Details panel also includes timeseries graphs of the query’s performance metrics, which allow you to monitor trends over the long term and alert on anomalous behavior.
Read our dedicated blog post to learn more about DBM.
Datadog APM traces requests as they propagate across services and infrastructure boundaries, and generates statistics about your application’s throughput, errors, and latency. From APM, you can easily pivot to related metrics and logs for additional context when troubleshooting your application.
As of Agent 5.13+, distributed tracing is enabled by default. Adding an environment tag to your Agent APM configuration can help you better organize and locate your APM data as it flows into Datadog. To do this, navigate to the apm_config section of the Agent configuration file (datadog.yaml) and include the env tag:
## Trace Collection Configuration ##
apm_config:
enabled: true
env: staging
The example here tags APM data with env:staging. If you omit this, Datadog will default to env:none. Save the file and restart the Agent to apply your changes.
Datadog APM supports auto-instrumentation for popular languages, libraries, and frameworks so you can start tracing with minimal configuration. In this section, we’ll show you how to set up APM to trace requests to MySQL within a Ruby on Rails application.
First, add the ddtrace gem to the Gemfile of your Rails application.
Then, install it with bundler.
Next, add a datadog.rb initializer file to your application’s config/initializers directory to auto-instrument your application:
Datadog.configure do |c|
c.use :rails, service_name: 'email-service', database_service: 'email-service-db'
end
Save the initializer file and run your application.
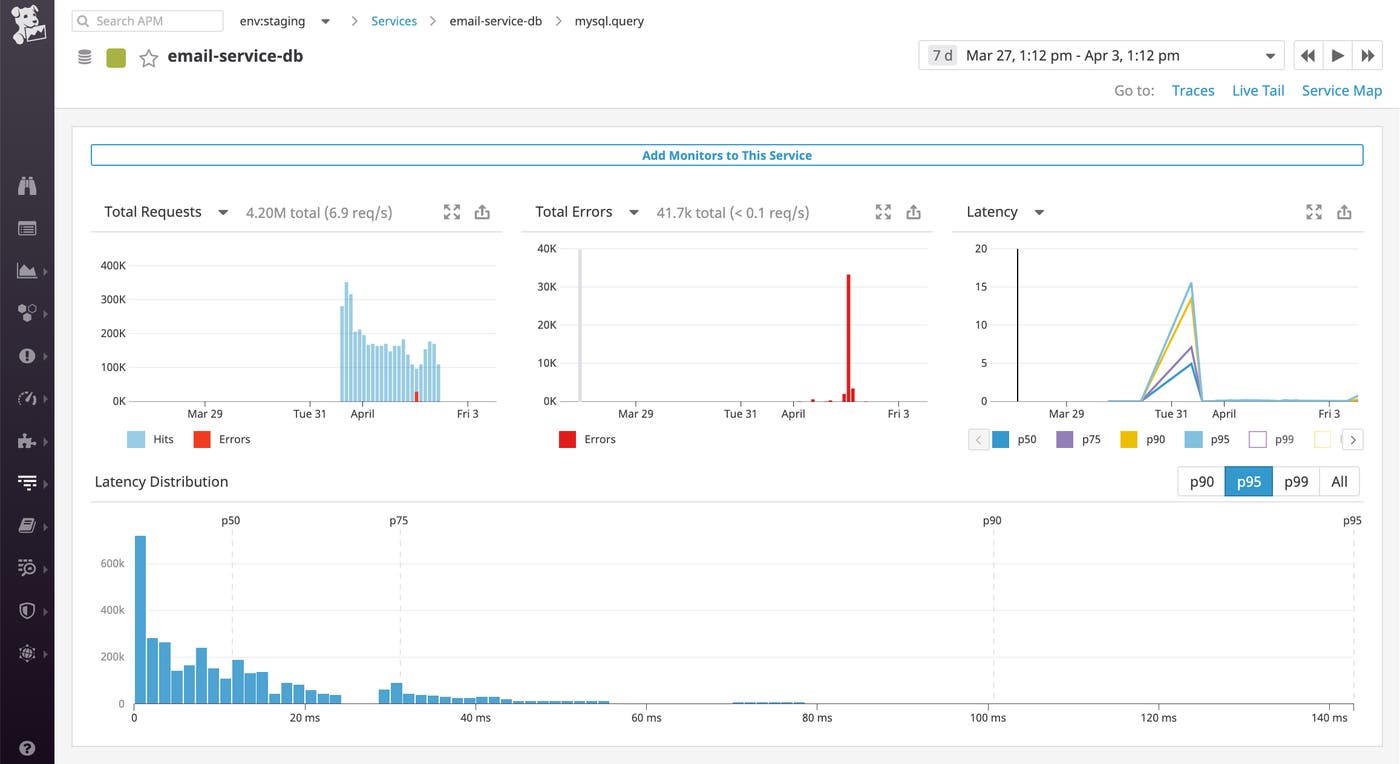
Within a few minutes, you should see the main Rails application (email-service) and MySQL database (email-service-db) service appear in Datadog APM. If you navigate to the service-level dashboard for email-service-db, you will see an overview of key performance indicators such as throughput, latency, and error rate. These graphs can be added to any other dashboard, making it easy to correlate these metrics with data from other parts of your infrastructure when troubleshooting a complex issue.
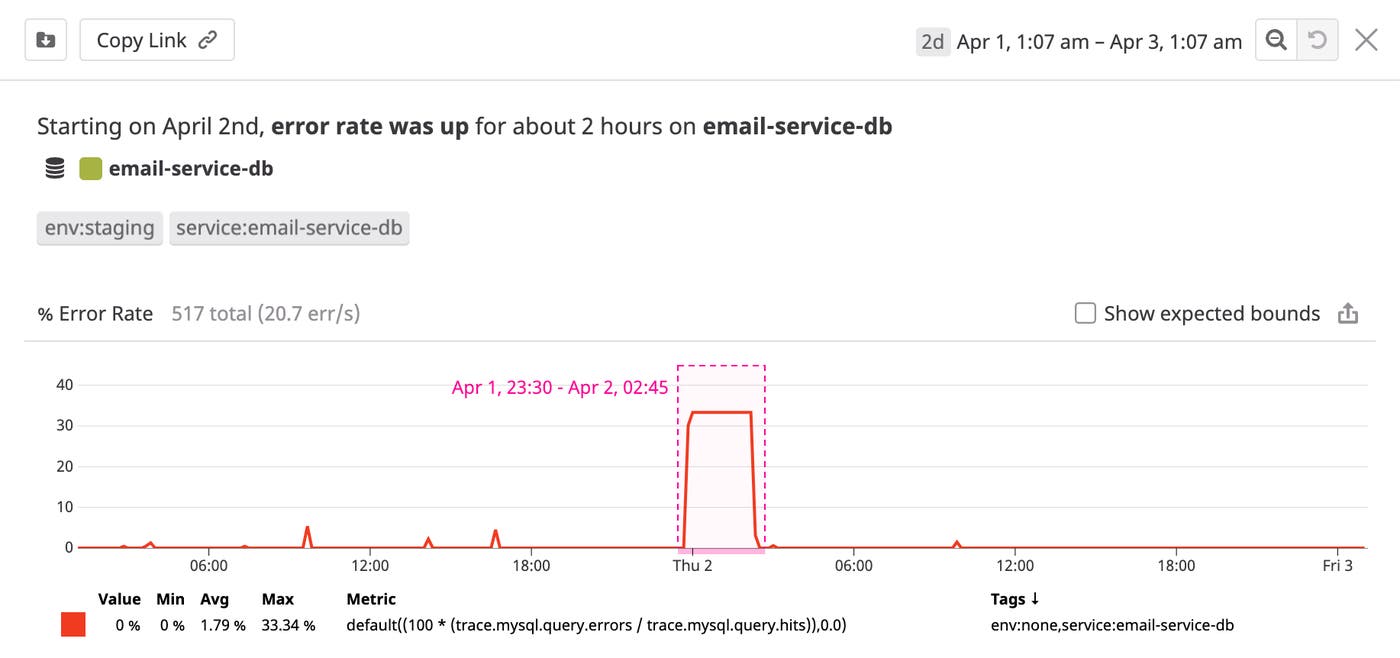
Datadog APM is also equipped with Watchdog, a machine learning-powered engine that automatically detects anomalies across your environment without any manual setup. In our case, we see that Watchdog discovered a sudden spike in errors from our database over a two-hour period. You can then enable an alert to automatically notify you if your application behaves similarly in the future.
In addition, you can click anywhere on the spike to pivot to related traces—and inspect one in more detail. Each trace is visualized as a flame graph that breaks down how long the request spent in each service it accessed. In the example below, we can see the 5xx errors Watchdog detected were mainly a result of MySQL attempting to insert entries into a table that does not exist.
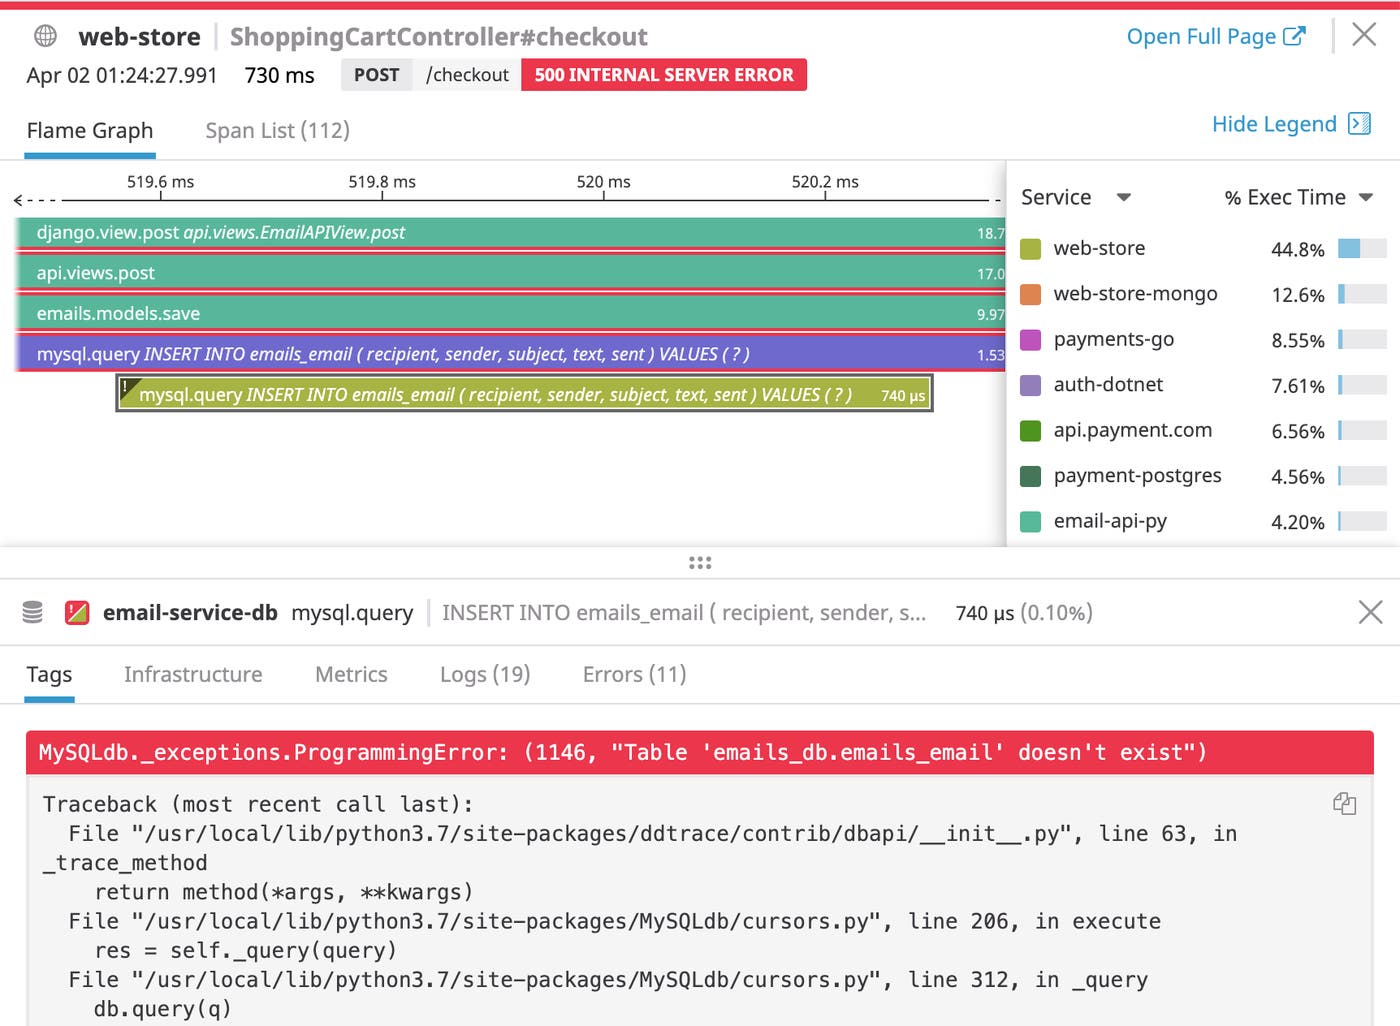
Datadog automatically correlates all the logs and the trace for each request, so you can get rich context for investigating issues. In the next section, we will walk through how you can forward logs to Datadog.
Sending logs from MySQL to Datadog involves making just a few simple changes to your configuration.
We will configure MySQL to collect three types of logs: error, general, and slow query logs. If you’re using a Unix or Unix-like system, you will first need to comment out or remove syslog from /etc/mysql/conf.d/mysqld_safe_syslog.cnf, as error logs are sent to the system log by default. For all other operating systems, you can skip this step.
To enable logging, add the following lines to your MySQL configuration file (my.cnf):
[mysqld_safe]
log_error = /var/log/mysql/mysql_error.log
[mysqld]
general_log = on
general_log_file = /var/log/mysql/mysql.log
log_error = /var/log/mysql/mysql_error.log
slow_query_log = on
slow_query_log_file = /var/log/mysql/mysql_slow.log
long_query_time = 2
Save the file and restart MySQL.
Next, include the following information in mysql.d/conf.yaml to configure the Agent to collect MySQL error, general, and slow query logs, based on the file paths specified in your MySQL configuration file:
logs:
- type: file
path: /var/log/mysql/mysql_error.log
service: email-service
source: mysql
- type: file
path: /var/log/mysql/mysql_slow.log
service: email-service
source: mysql
log_processing_rules:
- type: multi_line
name: new_slow_query_log_entry
pattern: "# Time:"
# If mysqld was started with `--log-short-format`, use:
# pattern: "# Query_time:"
- type: file
path: /var/log/mysql/mysql.log
service: email-service
source: mysql
In this example, we defined a custom log processing rule that instructs Datadog to report each multi-line slow query log as a single entry, rather than spreading it across multiple entries. Datadog scans your raw logs for the specified pattern and aggregates all subsequent lines into a single log message until it encounters the pattern again.
Finally, set the logs_enabled parameter to true in your Agent configuration file:
## Log collection Configuration ##
logs_enabled: true
Restart the Agent to apply your changes. You should now begin to see MySQL application logs appearing in your Log Explorer.
Datadog automatically installs the log processing pipeline for the integration specified in the source parameter (mysql, in this case) and extracts facets and attributes that you can use to search, filter, and sort through your logs. Likewise, using the same service tag you configured earlier in APM enables you to seamlessly pivot from logs to application-level metrics and request traces and get rich context for troubleshooting issues.
To display only logs from your service, search for service:email-service or filter using the service name facet in the sidebar of the Log Explorer. If you click on the Log Patterns button in the upper-left corner of the Log Explorer, the full list of logs collapses into clusters based on their common patterns. When you’re investigating an issue, these patterns can help you easily identify unusual occurrences and focus on specific problem areas—without having to sift through massive volumes of logs.
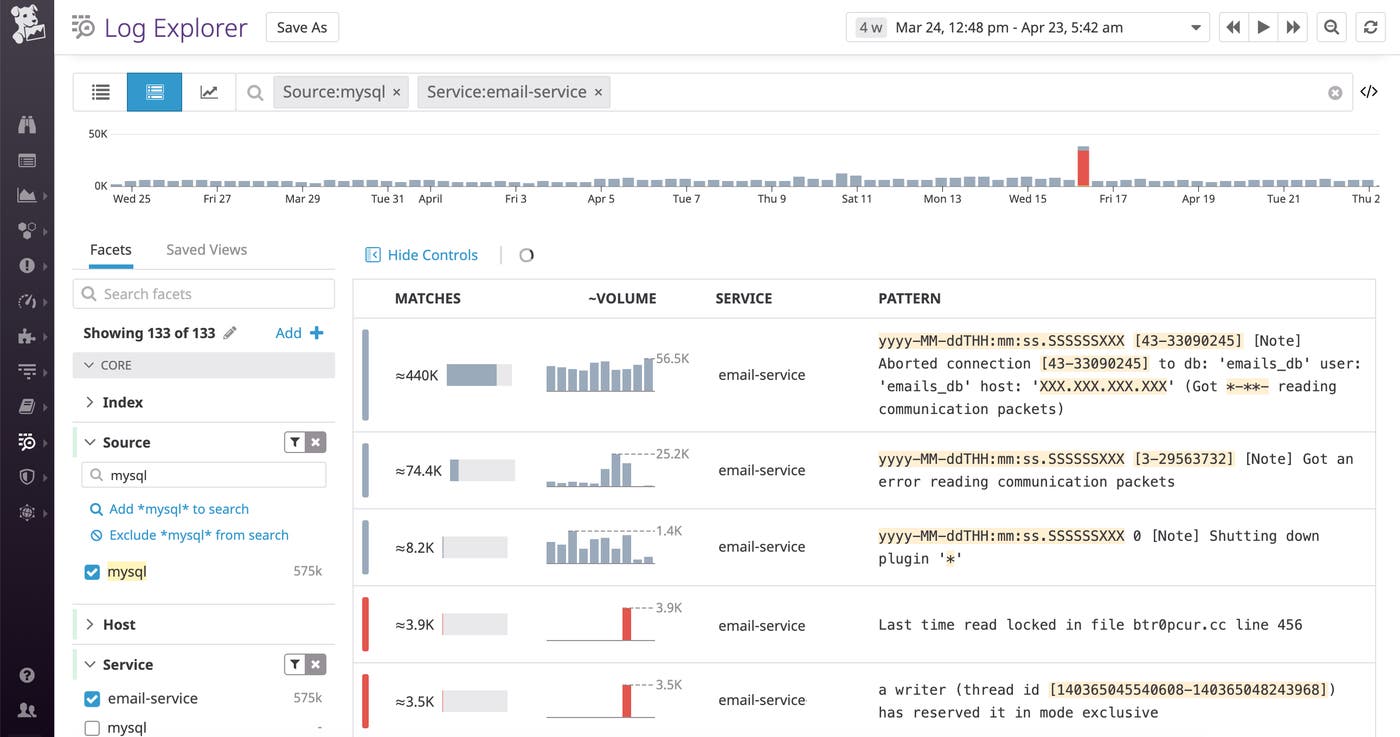
Clicking on any cluster shows you all the individual logs that match the pattern. From within a log, you can jump to a dashboard of the log’s host by clicking on the host name at the top of the log. You can also see related performance statistics and request traces by clicking on the service name and pivoting to APM.
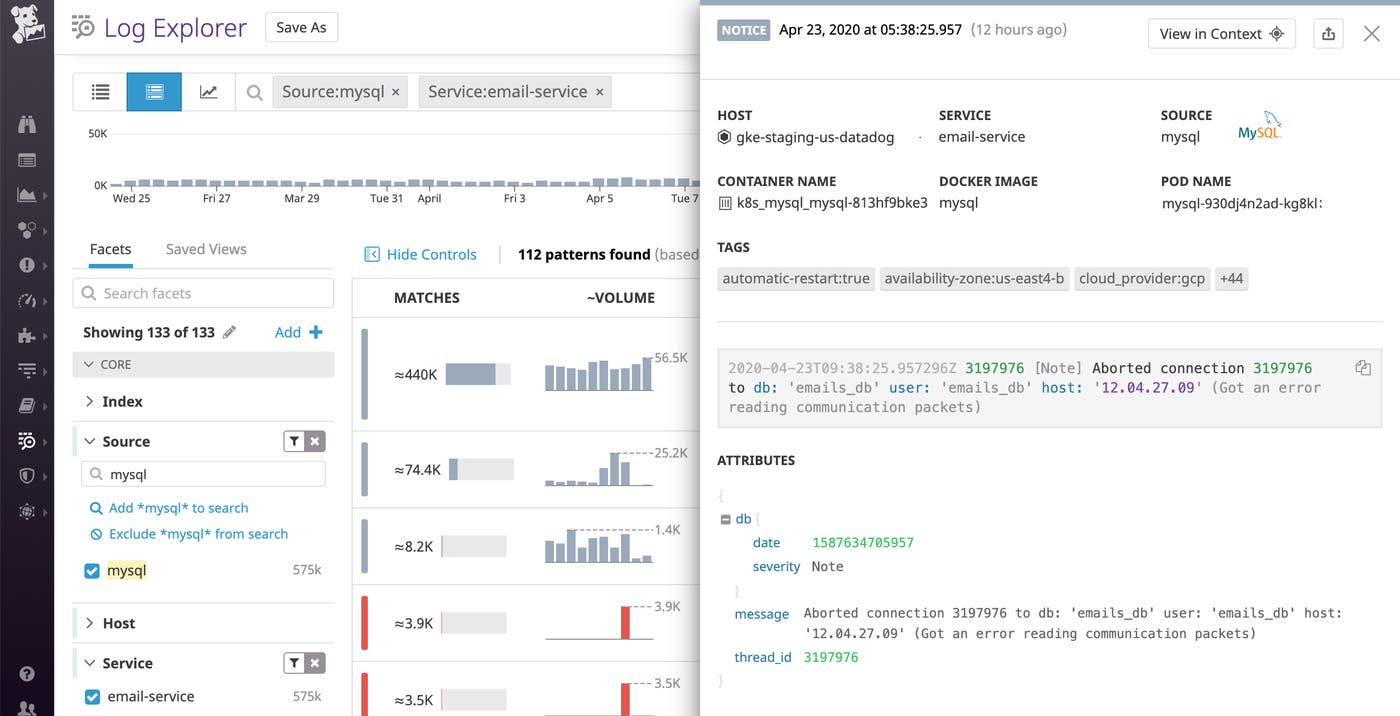
With metrics, traces, and logs all in one place, you now have the deep visibility you need to resolve any issues that arise.
In this post, we’ve walked you through integrating MySQL with Datadog so you can access all your database metrics in one place, whether standard metrics from MySQL, more detailed metrics from the InnoDB storage engine, or automatically computed metrics on query latency. In addition, we’ve shown you how you can collect distributed traces and logs to troubleshoot performance issues with even greater context.
Monitoring MySQL with Datadog gives you critical visibility into what’s happening with your database and the applications that depend on it. You can easily create automated alerts on any metric, with triggers tailored precisely to your infrastructure and your usage patterns.
If you don’t yet have a Datadog account, you can sign up for a free trial to start monitoring all your servers, applications, and services today.
此内容由惯性聚合(RSS阅读器)自动聚合整理,仅供阅读参考。 原文来自 — 版权归原作者所有。