


As serverless application architectures have gained popularity, AWS Lambda has become the best-known service for running code on demand without having to manage the underlying compute instances. From an ops perspective, running code in Lambda is fundamentally different than running a traditional application. Most significantly from an observability standpoint, you cannot inspect system-level metrics from your application servers. But you can—and should—closely monitor performance and usage metrics from your Lambda functions (the individual services or bits of code you run in Lambda).
In this post, we’ll walk through some of the ways that serverless monitoring diverges from traditional application monitoring. And we’ll present a concrete example of monitoring the performance and usage of a simple Lambda function with Datadog.
AWS Lambda is an event-driven compute service in the Amazon cloud that abstracts away the underlying physical computing infrastructure, allowing developers to focus on their code rather than the execution environment. A Lambda function can be triggered by AWS events, such as an object being deleted from an S3 bucket; API calls via AWS API Gateway; or through manual invocation in the AWS user interface. Lambda adoption has flourished since its introduction in 2014, and a rich ecosystem is developing around Lambda and other serverless technologies.
Lambda is well integrated with several AWS services you may already be using, such as ELB, SES, and S3.
Monitoring applications running in AWS Lambda presents unique challenges when compared to monitoring a traditional application server. For starters, there is no long-lived host you can monitor, which means there is no place to drop a monitoring agent to collect telemetry data.
“Serverless” does not mean that there is no computer executing code, however. Rather, it means that developers do not need to provision and maintain application servers to run their code. The burden of patching, securing, and maintaining the infrastructure behind a Lambda function falls to Amazon Web Services. Deploying serverless code is as simple as uploading your application (and dependencies) to AWS and configuring some runtime constraints, like maximum memory allocated and max execution time.
Because of this abstraction, in a serverless deployment you don’t have access to all of the traditional system metrics (like disk usage and RAM consumption) that could inform you of the health of your system. But with proper instrumentation of your applications and supporting services, you can ensure that your systems are observable, even in the absence of metrics on CPU, memory, and the like.
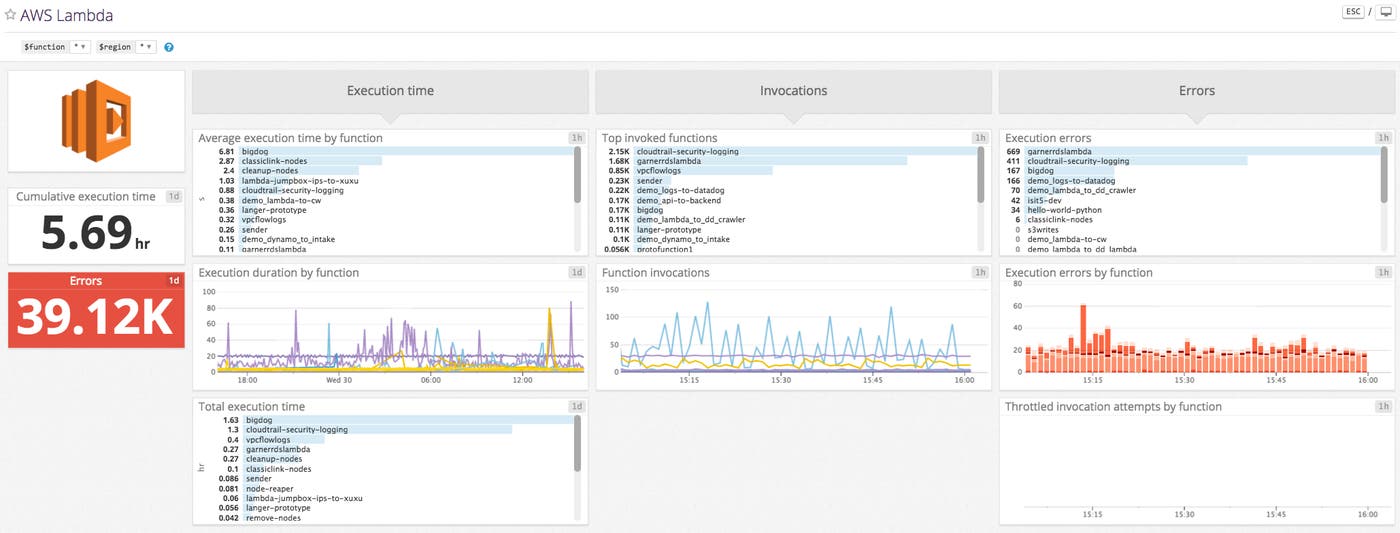
Lambda performance metrics can be broken out into two groups:
Standard metrics from AWS CloudWatch
Custom metrics from the application itself
We’ll tackle each in turn. Along the way, we’ll characterize metrics as “work” or “resource” metrics—for background on this distinction, refer to our Monitoring 101 posts on metric collection and alerting.
| Metric | Description | Metric Type |
|---|---|---|
| duration | Duration of a function’s execution in milliseconds | Work: Performance |
| invocations | Count of executions of a function | Work: Throughput |
| errors | Count of executions that resulted in an error | Work: Error |
| throttles | Count of throttled invocation attempts | Resource: Saturation |
These metrics are available through the AWS CloudWatch console and give you the raw data about the execution of your functions. With these metrics alone, you can estimate projected execution costs, identify trends in execution frequency, and quickly identify when errors start to pile up.
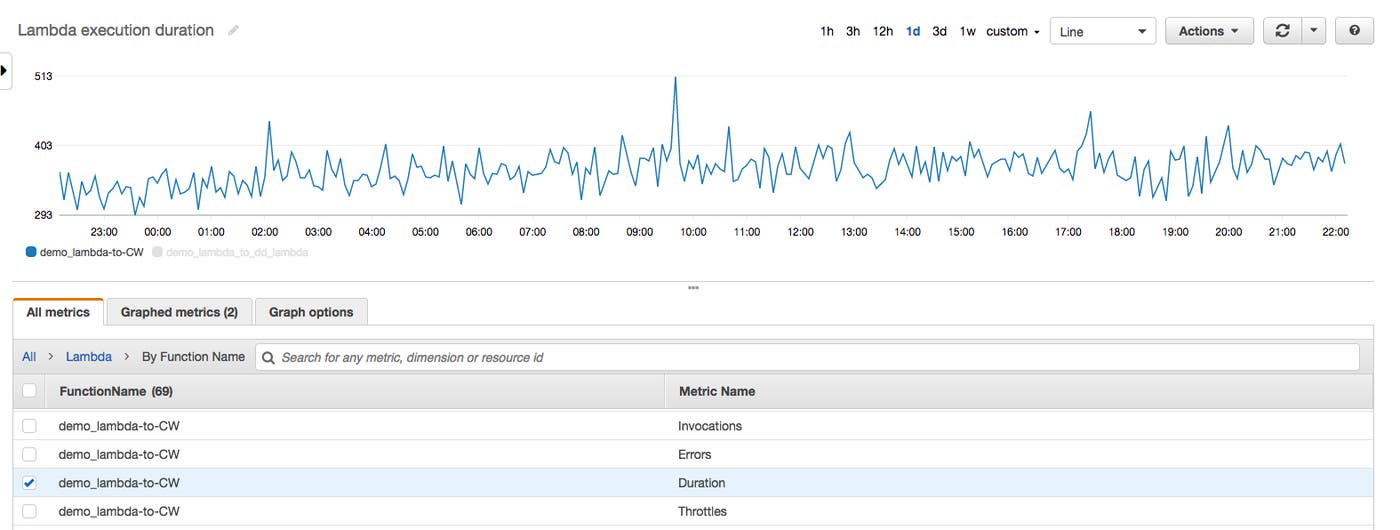
That being said, without additional metrics your insight into application performance will be somewhat limited. You can see, for example, that your function is executing slowly, but you won’t have much additional context to help you pinpoint the source of the slowdown.
As you will see, even minimal instrumentation of Lambda functions yields significant insight into application performance.
Beyond the out-of-the-box metrics provided by AWS, you will likely want to track custom metrics—performance and usage metrics that are unique to your use case and application. For example, if your function is interacting with an external API, you would likely want to track your API calls; likewise, if your Lambda function interacts with a database to manage state, you’d want to track reads and writes to that database.
In the context of web application performance monitoring, some of the metrics that are nearly universally valuable include:
requests (throughput)
responses (including specific error types)
latency
work done to service requests
Of course, choosing what to monitor will be largely dependent on your specific use case, your business, and any [SLAs] you may have in place.
To capture all of the above requires instrumenting the entry and exit points of your application, as well as instrumenting the code segments where the actual work is performed.
Consider a simple Lambda function hooked up to API Gateway that performs two kinds of work: accept a string and return the MD5 hash of the string to the caller, and accept an MD5 hash and return the original string.
From a high level, the application to be instrumented uses a Lambda request handler that is invoked each time a request comes in via Amazon API Gateway. The application logic is contained in four functions:
lambda_handler is the entry point for our application
read_s3 retrieves the data file from S3
hash_exists reads & searches the data file for a hash
response returns the requested string or hash, if the request is successful, along with an HTTP status code
To emit custom metrics with the Datadog Lambda Layer, we first add the ARN to the Lambda function in AWS console:
arn:aws:lambda:<AWS_REGION>:464622532012:layer:Datadog-<RUNTIME>:<VERSION>
Then we import the necessary Layer methods in the function code, add a wrapper around the function handler, and call the lambda_metric() function:
from datadog_lambda.metric import lambda_metric
from datadog_lambda.wrapper import datadog_lambda_wrapper
[...]
@datadog_lambda_wrapper
def lambda_handler(event, context):
lambda_metric(<METRIC_NAME>, <METRIC_VALUE>, tags=['<TAGS>'])
With the lambda_metric() function, instrumenting your application is as easy as calling a function whenever you want to emit a metric. Instrumentation examples for other programming languages such as Node.js, Go, Java, and Ruby are available in Datadog’s Lambda integration docs.
Metrics sent from the Datadog Lambda Layer are automatically aggregated into distributions, so you calculate aggregations on application performance in Datadog, such as count, median, min, max, and p95 latency.
With a Lambda metric function defined, you can start to think about what kinds of metrics would capture information that would help you measure and track the performance of your service. As previously mentioned, you typically will want to monitor application requests and responses, which provide a good starting point for placing instrumentation.
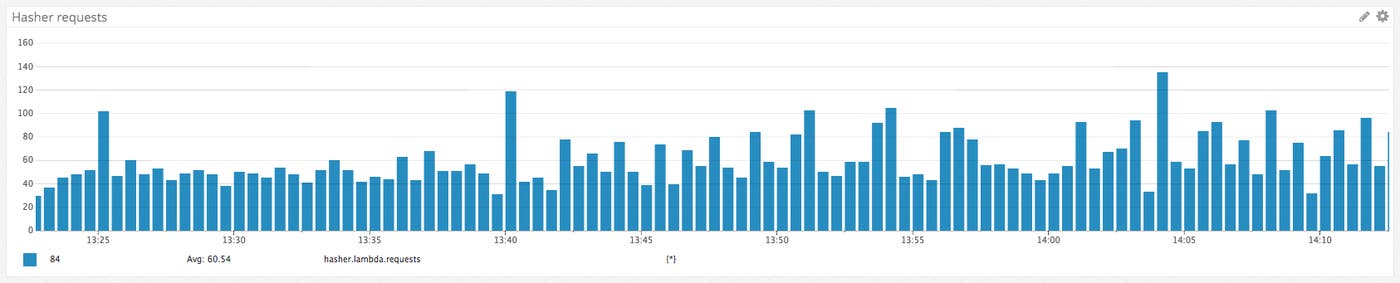
In our example application, capturing high-resolution metrics on the request rate would be very useful for understanding throughput, which is a key work metric for any application. The easiest way to capture the requests as they come in is to instrument the beginning of the request-handling code. The hasher service processes all requests via the lambda_handler() function, so capturing the count of requests is as simple as adding a call to lambda_metric() at the very beginning of that function.
A simple, clear name for this metric would be hasher.lambda.requests. We can start collecting the request metric simply by calling lambda_metric() within the lambda_handler() function:
def lambda_handler(event, context):
lambda_metric("hasher.lambda.requests", 1, tags=['service:hash-service'])
Note the hasher.lambda prefix; we’ll include this in every metric we send (e.g., hasher.lambda.requests or hasher.lambda.responses). Using a consistent metric prefix makes the metrics easy to find when we’re building metric graphs or alerts.
Now we have a metric tracking the request count for the Lambda function:
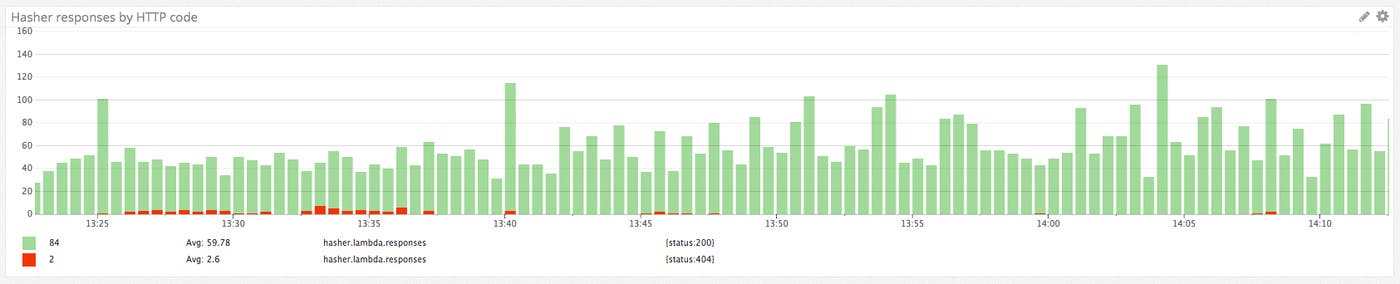
The next logical place to call lambda_metric() is wherever the Lambda function has a return statement (a response), since these are effectively the exit points of the Lambda function. So we can instrument our response() function to emit a custom metric every time a response is returned to the client. These response metrics are emitted under the catchall metric name hasher.lambda.responses, tagged with the specific status code associated with the response.
def response(statusCode, body):
lambda_metric('hasher.lambda.responses', 1, tags=['service:hash-service', 'status:' + statusCode])
By tagging the hasher.lambda.responses metric with the associated HTTP response code (e.g., status:404), we can break down our responses in Datadog to visualize successful requests alongside the count of specific error types:
You can use custom metrics to track your business KPIs and application health using other types of built-in aggregations. For example, we may want to track the duration of our hash_exists function, to make sure it doesn’t introduce unacceptable latency into our overall application. In the example script, we’ve calculated the latency of that function as function_duration and used lambda_metric() to send the real-time value to Datadog as a metric:
# subtract start-of-function timestamp from the current timestamp
function_duration = time.time() - function_start
lambda_metric('hasher.lambda.hash_exists.latency', function_duration, tags=['service:hash-service'])
Then you can visualize both the function’s median and p95 latency in Datadog.

Even with a fully instrumented Lambda function, supplemented with the standard service metrics emitted by AWS, there can still be gaps in visibility. A complete monitoring plan would also take into account any external system dependencies your application may have, such as load balancers and data stores. Combining and correlating metrics from all of these data sources provides a much more comprehensive view to help diagnose performance issues and monitor the overall health of your system.
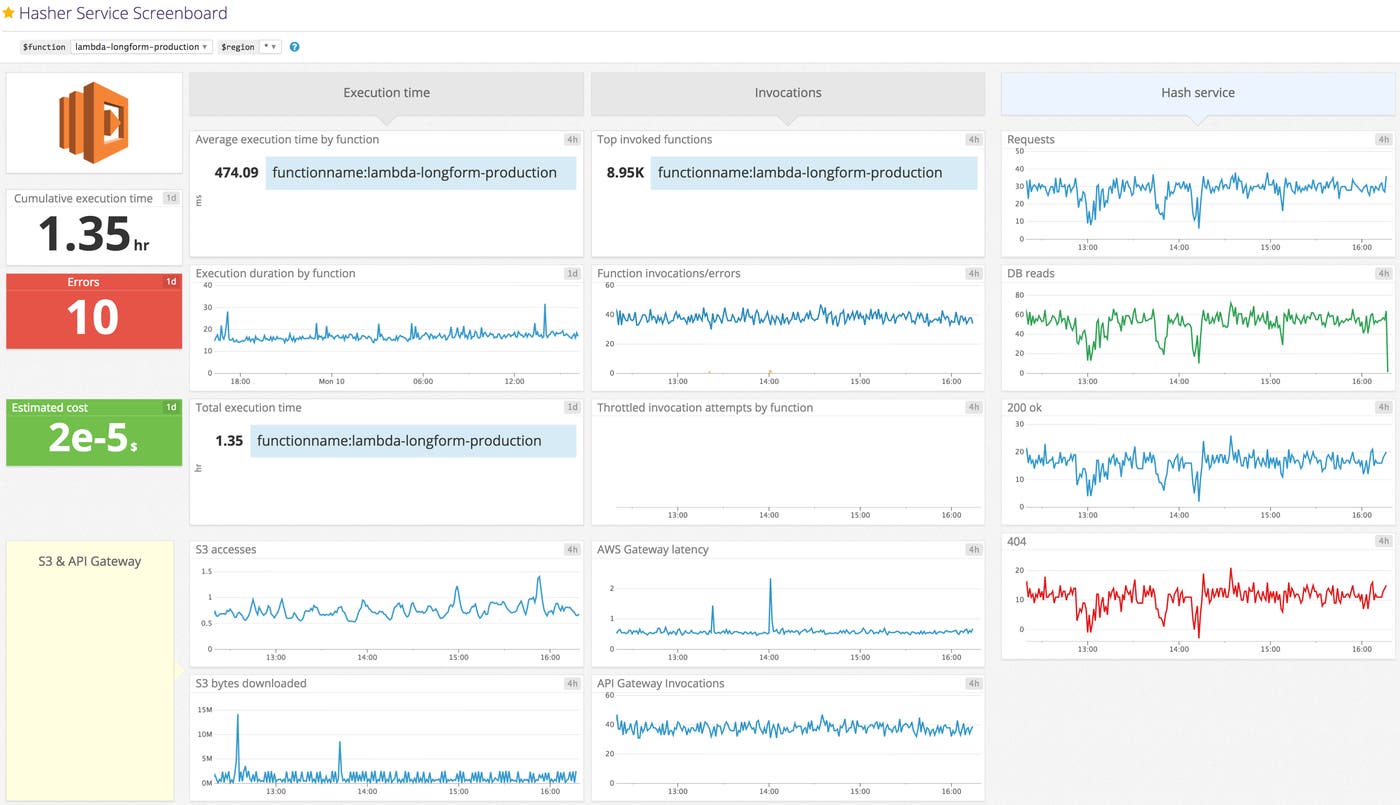
Combining relevant metrics from interconnected services into a single dashboard like the one above provides a ready-made starting point for troubleshooting the performance of a serverless application.
Once Datadog is deployed to capture and visualize metrics from your applications, Lambda functions, and infrastructure, you will likely want to configure a set of alerts to be notified of potential issues. Datadog’s machine learning–powered alerting features, such as outlier detection and anomaly detection, can automatically alert you to unexpected behavior. Datadog integrates seamlessly with communication tools like Slack, HipChat, PagerDuty, and OpsGenie, ensuring that you can alert the right person to issues when they arise.
We’ve now walked through how you can gather meaningful metrics from your functions with just a few lines of instrumentation. We then tied it all together with metrics from the rest of your systems.
If you don’t yet have a Datadog account, you can start monitoring your Lambda functions today with a 14-day trial. If you’re already up and running with a Datadog account, enable the Lambda integration to start enhancing the observability of your serverless applications today.
Many thanks to Datadog technical writing intern Rishabh Moudgil for his contributions to this article.
此内容由惯性聚合(RSS阅读器)自动聚合整理,仅供阅读参考。 原文来自 — 版权归原作者所有。