











The 2025 State of Containers and Serverless report found that 64% of organizations use the Kubernetes Horizontal Pod Autoscaler (HPA) to manage Kubernetes workload capacity. But only 20% of those deployments scale on custom metrics. The other four-fifths of organizations rely on resource metrics—CPU and memory utilized by their pods—to trigger autoscaling activity.
Resource metrics provide a low-friction way of configuring autoscaling, but they’re not always the most effective scaling signals. Many workloads are constrained by queue backlog, concurrency limits, or tail latency rather than raw CPU consumption. For these services, resource metrics don’t reflect demand accurately enough, and scaling on them can mean scaling too late.
In this post, we’ll identify workload patterns that scale more effectively based on Kubernetes custom metrics instead of resource metrics, and look at how teams currently implement custom metric scaling. We’ll also show you how Datadog Kubernetes Autoscaling (DKA) lets you trigger scaling based on application metrics to help ensure high performance, manage cloud costs, and simplify cluster management.
CPU and memory utilization are lagging indicators of upstream demand, making them an ineffective proxy for the work a service does. Although resource metrics measure consumption in real time, that reflects work that has already entered the system, not the volume of demand as it arrives.
For example, a workload constrained by connection limits or queue depth can report low CPU utilization even while its thread pool is exhausted and requests are queuing behind it. By the time the CPU metric climbs and triggers HPA, the service’s performance may have already degraded and caused user-facing latency.
Work metrics such as queue depth, request rate, and tail latency are leading indicators that reflect a workload’s real-time activity rather than the resulting infrastructure consumption. Because work metrics reflect demand as it arrives, they can be valuable signals for triggering autoscaling to provision capacity before users experience degradation. They surface relevant changes more quickly than lagging indicators, which may not trigger until after the workload is already under strain.
Several workload patterns share a common characteristic: Resource utilization is a poor proxy for the amount of work they actually do. In this section, we’ll look at specific patterns and explain why custom metrics produce better scaling outcomes in each case.
These workers process messages from a queue such as a Kafka topic, an SQS queue, or a Redis or RabbitMQ queue used as a Celery broker. Resource metrics are an ineffective scaling trigger in these cases because CPU utilization often stays low until the backlog is large enough to overwhelm the worker pool. Scaling on queue depth instead lets a horizontal autoscaler add workers in proportion to backlog before processing latency increases. While the ideal threshold depends on worker throughput, a scaling configuration based on queue depth can bypass the slowdowns and errors common with lagging resource metrics.
APIs that rely on database queries, external service calls, or cache lookups can saturate on request concurrency before CPU metrics register the pressure. If a service has a known concurrency limit, scaling on request rate gives a horizontal autoscaler a direct measure of load rather than waiting for CPU to reflect it.
Services with defined service level objectives (SLOs) benefit from scaling on tail latency directly, regardless of resource utilization. Proactively scaling out when p99 latency approaches an SLO threshold is more effective than waiting for lagging CPU metrics to catch up with the actual load. Latency metrics are especially prone to transient spikes, so you should configure stabilization carefully to avoid unnecessary scale events.
Here, the scaling constraint originates downstream rather than in the service itself. Each additional replica opens connections to a shared database, and most databases enforce a hard limit on total concurrent connections. Scaling on CPU or request rate alone can push the replica count past this limit, causing database errors that affect all running replicas. Scaling instead on connection pool utilization turns available database capacity into a throttle—when connections are exhausted, the autoscaler pauses. For example, you can track MySQL’s Threads_running metric or PostgreSQL’s numbackends metric to trigger scaling based on active connections to those databases. This approach can introduce latency or errors across the existing replicas, but it protects against database-wide failure.
Certain workloads generate operational pressure that is better measured by business-specific activities than by standard infrastructure metrics. This pattern applies where load is best expressed in domain terms, whether that’s the number of active WebSocket connections, open checkout sessions, or connected devices. For example, a WebSocket server handling a large number of persistent connections carries load that CPU utilization may not reflect. Scaling on connection count ensures that the server gains the additional resources it needs to remain performant when activity increases.
Connecting a custom metric to HPA requires bridging a metric source to the Kubernetes External Metrics API. Two approaches are in common use today.
The native HPA path exposes custom metrics to HPA through the Kubernetes Custom Metrics API by using a deployed adapter. The Prometheus adapter, deployed as a standard Kubernetes workload alongside the application stack, is one widely recognized example that uses this pattern. This approach is flexible but offers limited visibility into adapter health, and to debug effectively requires correlating HPA event logs with adapter logs and API server responses.
Kubernetes Event-Driven Autoscaling (KEDA) is a CNCF project that exposes external metric sources to HPA through the Kubernetes External Metrics API. Its library of prebuilt scalers—connectors for sources including Kafka, SQS, Redis, and Prometheus—replaces per-source adapter code with declarative configuration. This removes most of the custom adapter overhead and adds production-ready support for scaling to zero. (Note that native HPA’s equivalent mechanism remains in alpha and is disabled by default in many managed Kubernetes offerings.) The trade-off is a new control plane component with its own versioning life cycle, and diagnosing unexpected behavior requires tracing through both KEDA’s trigger layer and HPA’s scaling execution.
The native HPA path and KEDA both enable scaling via custom metrics, but they come with implementation challenges. Teams often need to carefully tune HPA behavior (stabilization windows and scaling policies) to avoid oscillation when metrics fluctuate. In addition, because custom metrics typically flow through external adapters and data pipelines, delays or outages can leave HPA without a reliable signal unless you build safeguards, such as alerting and fallback behavior that uses local resource metrics (for example, CPU). Finally, verifying scaling logic requires independent checks of HPA conditions, the adapter or scaler, and the metric source.
Datadog Kubernetes Autoscaling (DKA) consolidates metrics, observability, and autoscaling into a single platform that eliminates the need to coordinate separate tools. The Datadog Cluster Agent powers DKA by implementing the Kubernetes External Metrics API, which makes any collected metric available as a scaling signal. As a managed autoscaling layer, DKA provides scaling observability in the same platform where your teams already monitor their services and infrastructure.
DKA’s custom query scaling lets teams define scaling signals by using the same Datadog query language used for dashboards and monitors. Any metric that Datadog collects can drive autoscaling. For example, a worker pool can scale on rabbitmq.queue.messages or kafka.request.channel.queue.size, and a web tier can scale on nginx.net.request_per_s. A built-in query builder displays historical metric behavior against the target threshold, helping teams identify the right signal and tune its value before deploying.
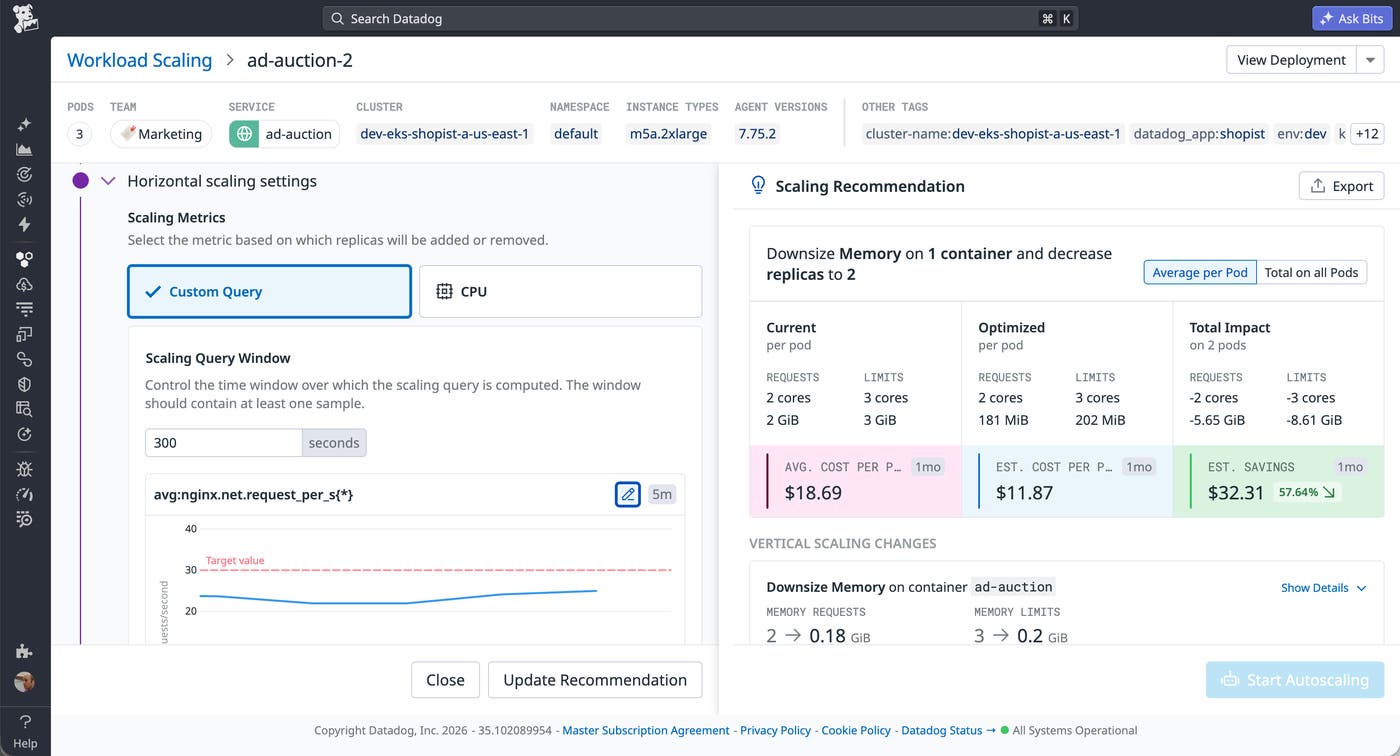
Metrics like request rate and queue depth naturally fluctuate, and scaling against a single target value turns that fluctuation into unnecessary pod churn. DKA helps you scale on custom metrics safely by letting you explicitly tune how quickly workloads scale in and out. This helps you respond quickly to real demand while avoiding instability during normal metric variance.
DKA also protects availability if custom metrics are delayed or temporarily unavailable. When external signals can’t be evaluated reliably, DKA automatically falls back to local CPU-based scaling behavior. This can help ensure that your workloads continue to scale and remain responsive even during custom metric interruptions.
Resource metrics are the right signal for horizontally scaling CPU-bound workloads and memory-constrained services. But for event-driven workers, high-throughput APIs, latency-sensitive services, database-backed services, and business-logic workloads, the gap between resource utilization and actual demand is where performance falters and capacity is wasted on overprovisioning. Custom metrics can help by aligning your capacity with business logic rather than hardware side effects. You can build a responsive scaling strategy around custom metrics, but you should assess whether your current tooling makes the additional complexity practical to act on.
See the Datadog Kubernetes Autoscaling documentation for more information about using custom metrics to effectively scale your workloads. If you don’t already have an account, you can sign up for a 14-day free trial.
此内容由惯性聚合(RSS阅读器)自动聚合整理,仅供阅读参考。 原文来自 — 版权归原作者所有。