





Azure Managed Redis is a Microsoft first-party, fully managed in-memory data store, replacing Azure Cache for Redis tiers. It includes Redis Enterprise features such as RediSearch for vector search and full-text search, in addition to RedisJSON, RedisTimeSeries, and Active Geo-Replication. As Azure Cache for Redis reaches end of life, more teams are planning migrations to Azure Managed Redis in search of better performance, lower cost, and modern capabilities for AI and real-time workloads.
Cache migrations are deceptively risky. Redis often handles latency-sensitive user requests, so an undersized cache, a misconfigured client, or a forgotten dependent service can result in immediate user-visible slowness or outages. Two things make the difference between a clean migration and an unsuccessful one: a single observability layer covering both sides of the cutover, and a reliable way to move data and traffic. Together, Datadog and Eden meet both requirements.
Datadog provides unified observability across the legacy cache and the new Managed Redis deployment, helping teams capture premigration performance, monitor the cutover, and validate performance after migration. Eden provides the app-aware execution layer for data replication, traffic routing, dual-write consistency, and instant rollback.
In this post, we’ll explore how you can use Datadog and Eden to:
Establish performance baselines for the legacy cache before you migrate
Move the data and shift traffic with zero downtime
Monitor the cutover with side-by-side dashboards
Validate parity between the legacy cache and the new cache
Keep your Azure Managed Redis cache healthy after the migration
The first migration question is also the hardest: Which Managed Redis configuration should you choose, and how many shards do you actually need? Guessing can lead to an underprovisioned cache that regresses application latency or an overprovisioned cache that wastes the cost savings the migration was supposed to deliver.
Datadog’s existing Azure Cache for Redis integration and Redis integration capture the data needed to size the new cache. Use the out-of-the-box (OOTB) dashboards to extract baselines from a representative window, ideally one that includes a peak traffic event. Focus on the following metrics:
Peak operations per second: indicates the throughput tier you need
p99 cache latency: establishes the latency target that the new cache should match or improve on
Working set size (used memory at steady state): tells you the minimum memory configuration for the new instance
Hit rate: confirms how dependent your application is on cache effectiveness, which sets the bar for postmigration validation
Connection counts and connection churn: guide cluster sizing and reveal client pools that might need tuning before cutover
Save the baselines as Datadog notebooks so that you can refer back to them during and after the migration. You can use the same numbers to size the new instance and choose the right migration strategy. For example, a high-traffic, customer-facing system often benefits from a gradual rollout rather than a quick cutover.
You also should create an anomaly-based monitor on the legacy cache during the planning phase. If a load test or a misbehaving deployment spikes traffic in a way that would invalidate your sizing assumptions, you want to know before you begin the migration.
With your baselines captured, the next step is to use Eden to handle the data-movement aspect of the migration. Eden’s migration layer, Exodus, sits in front of both caches. You don’t need to write replication code, modify your applications, or schedule a maintenance window, so you can migrate with zero downtime. With Exodus, you can:
Replicate data from the legacy cache to the new Managed Redis instance so that the new cache is ready to serve traffic
Choose a cutover strategy (canary, blue/green, tenant-by-tenant, or big bang) and let Exodus shift traffic on your schedule
Mirror writes to both caches during cutover so that they stay in sync
Throttle adaptively so that neither the legacy cache nor the new cache is overwhelmed during peak load
Compare responses in replicated read mode to catch feature or module incompatibilities before users notice them
Roll back instantly at any stage if a regression occurs
While Exodus runs the cutover, you can use Datadog to catch regressions early and confirm that dependent services stay healthy as traffic shifts. Exodus runs both caches in parallel and shifts traffic from the legacy cache to the new Managed Redis instance gradually, so you can watch the new cache pick up real production traffic before you fully commit to it.
The risk in this stage is not the data movement; it’s the applications that depend on the cache. In a microservices environment, dozens of services often share a single cache. A forgotten configuration change can leave one service pointed at the legacy endpoint while everything else has shifted to the new cache, producing inconsistent behavior that is difficult to diagnose later.
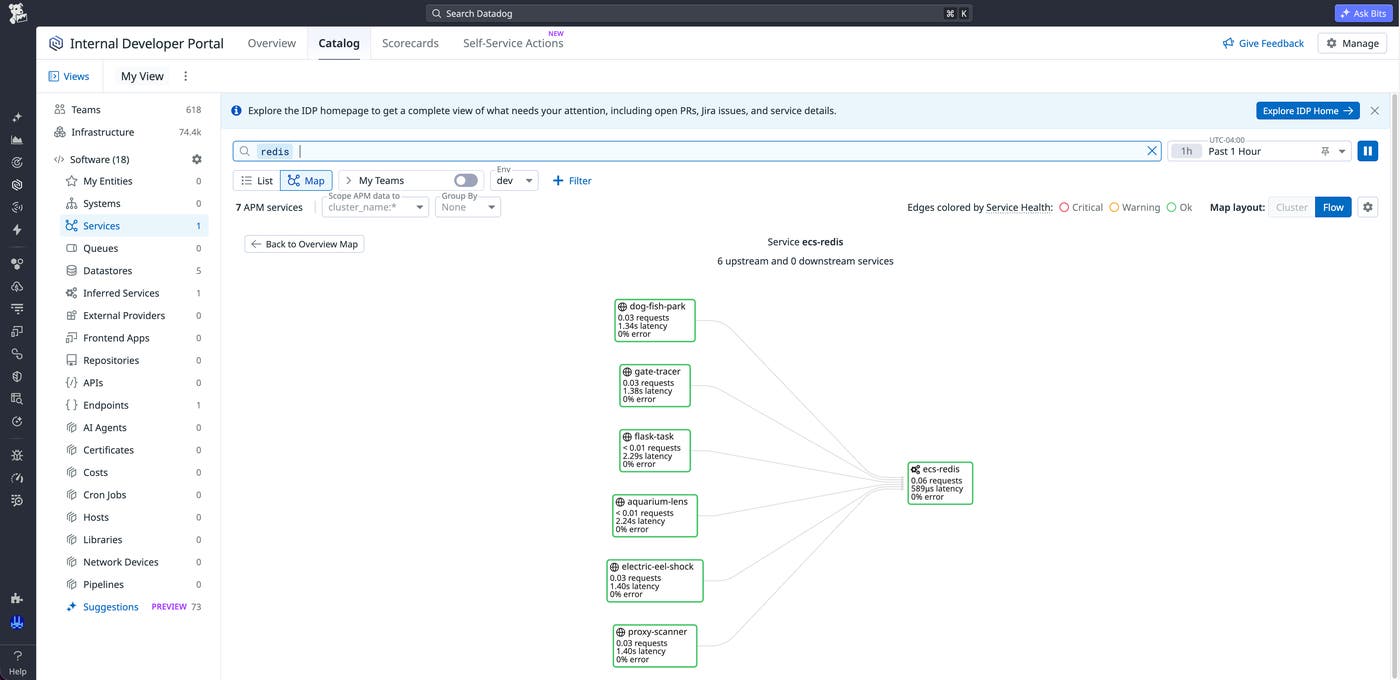
Datadog’s Software Catalog and APM traces help you identify dependent services and verify that each one migrates correctly. Filter the Software Catalog by your existing cache resources to see the upstream and downstream services that connect to it, along with the request volume that each service generates. Use this list as your cutover checklist. As you point each service to the new Managed Redis endpoint, watch for trace metrics from the new cache resource to appear in APM. Confirm that the legacy resource’s traffic drains toward zero.
During cutover, display the metrics from both caches side by side in the same Datadog dashboard. Tag each environment clearly (for example, cache:legacy and cache:managed-redis) so that a single widget can show the new cache’s hit rate climbing as the legacy cache’s traffic drains. If the new cache begins to diverge from the legacy cache’s baselines during cutover, the side-by-side view helps you identify regressions quickly and decide whether to roll back the migration.
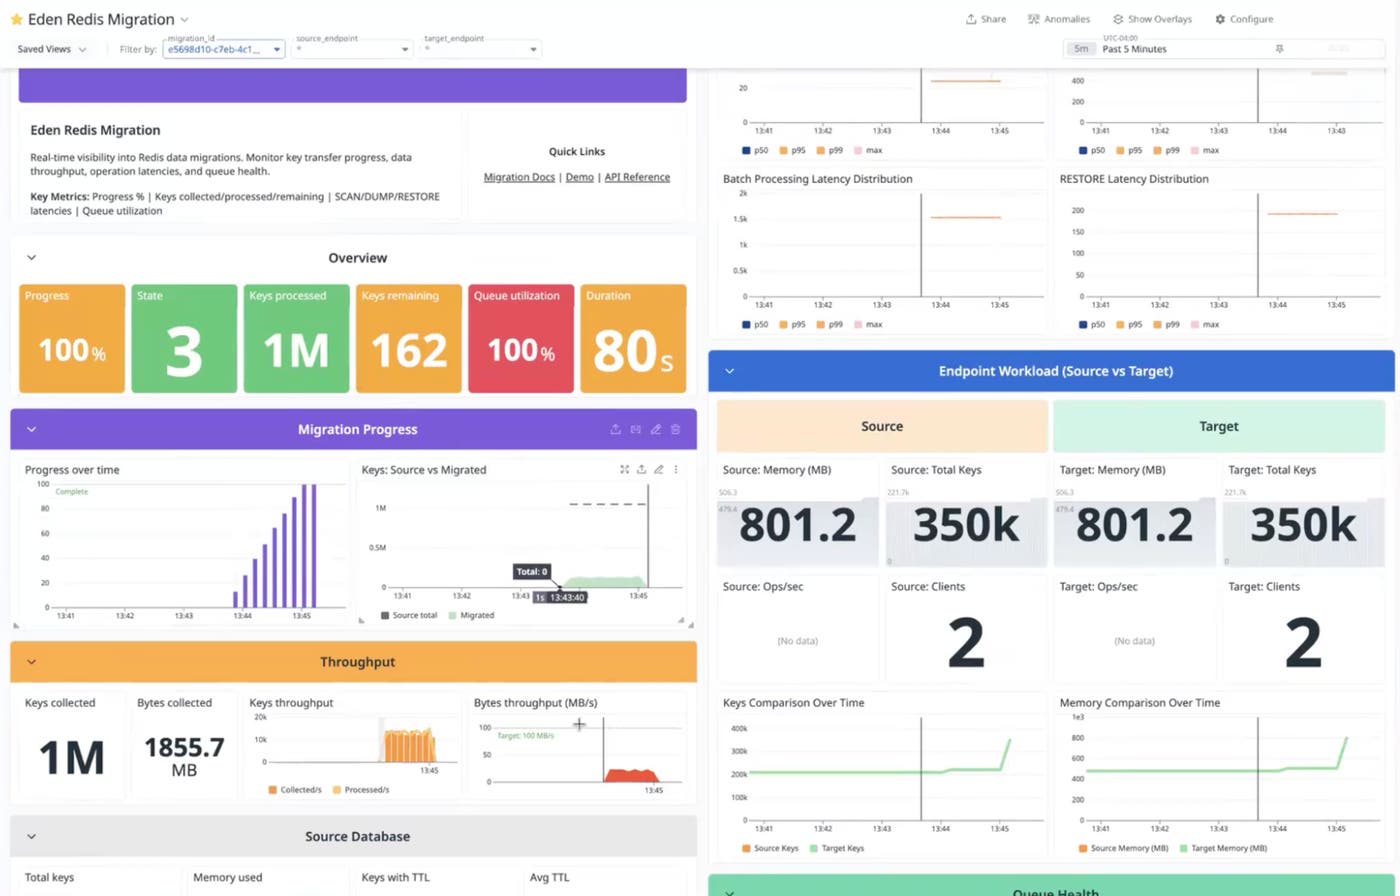
To make rollback decisions automatic, configure short-lived cutover monitors specifically for the migration window:
Latency divergence monitor: Alert if p99 latency on the new cache trends meaningfully higher than the legacy baseline. Catches sizing or networking issues early enough to roll back.
Error-rate divergence monitor: Alert if the new cache’s error rate exceeds the legacy cache’s error rate by more than a small margin. Often signals a client compatibility issue.
Hit-rate divergence monitor: Alert if the new cache’s hit rate falls materially below the legacy baseline after a representative volume of traffic has shifted. Catches working-set or time-to-live (TTL) drift before users feel it.
Delete these monitors after the cutover is complete.
The migration is not finished the moment that traffic shifts. The real test is whether the new cache holds up across a full traffic cycle, including peak hours, batch jobs, and any usage patterns that the legacy cache was tuned for.
Compare the metrics from the Azure Managed Redis Overview dashboard against the baseline values that you captured in the planning stage:
Latency at p95 and p99 should match or improve on the legacy baselines. If it regresses, check server_load and percent_processor_time to confirm whether the gap is saturation or configuration.
Hit rate should be at or above the baseline after the new cache has warmed for one or two traffic cycles. A persistent gap usually means that TTL values need tuning or that a working set has grown beyond the cache configuration.
Used memory percentage and eviction rate should both be well below the legacy baselines if you sized the new cache correctly. A high eviction rate is the clearest sign that you need to scale up before regressions cascade.
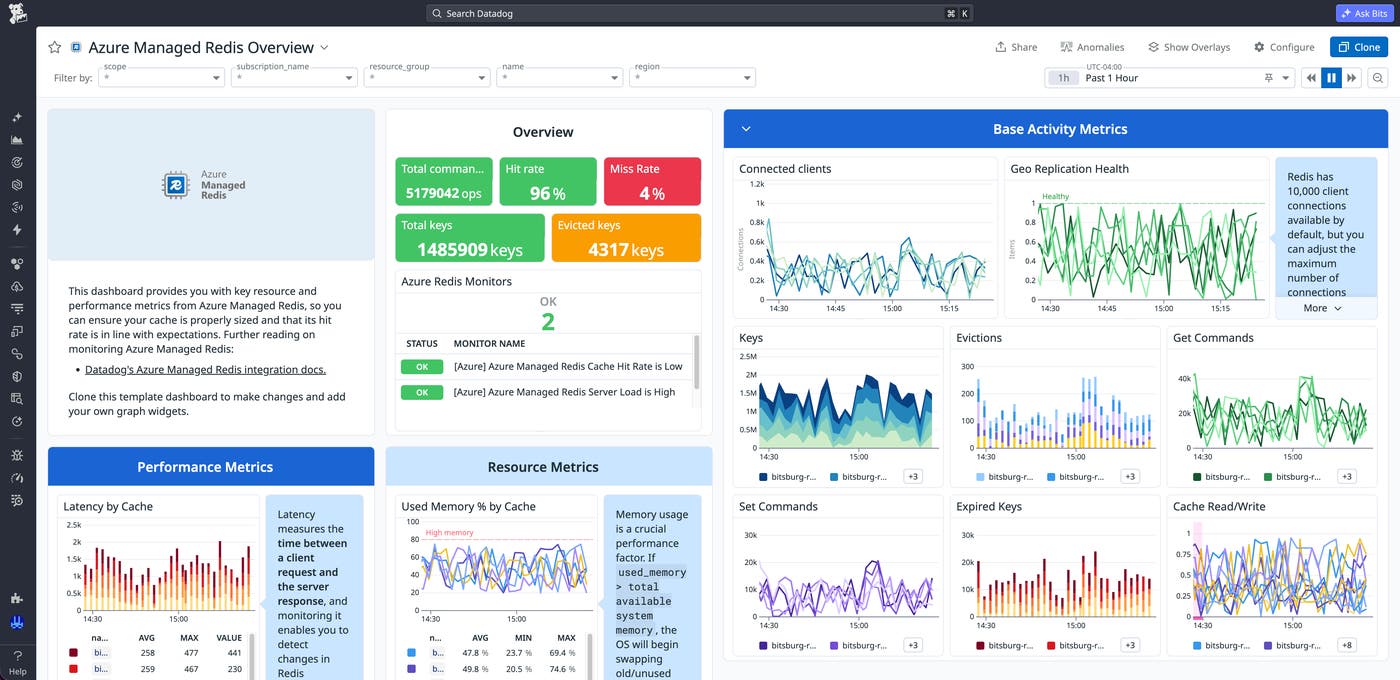
Once you validate that the new cache matches the legacy deployment in performance and behavior, you can decommission the legacy cache. If you want a final side-by-side check before you decommission the cache, Datadog dashboards show both of the cache environments and their dependent applications in the same view throughout the validation window.
With the migration complete, the focus shifts to keeping the new cache healthy as it absorbs the full weight of production traffic. Dashboards are useful while a human is watching them, but monitors protect the cache the rest of the time. Configure monitors that cover the four most common issues that affect Redis cache performance:
Saturation: Alert on sustained high server load or CPU utilization, the clearest leading indicator of latency regressions.
Efficiency: Alert when the hit-to-miss ratio drops below your target, which usually means that TTL values need tuning or a working set has outgrown the cache configuration.
Memory pressure: Alert when memory utilization climbs and evictions begin so that you can investigate before the cache evicts frequently accessed data.
Availability: Alert on geo-replication health for any cache in an Active Geo-Replication group so that you can address issues before a failover exposes them.
When an alert fires, Datadog provides the troubleshooting surface to resolve it. The Managed Redis dashboard, APM traces from the applications calling the cache, and logs from surrounding services all live in the same workspace. As a result, you can cross-reference a saturation alert against the deployments, traffic spikes, or upstream issues that might have caused it.
For teams moving from Azure Cache for Redis to Azure Managed Redis, Datadog and Eden together support the full migration process. Datadog provides observability across the legacy cache, the new instance, and the applications that depend on either. Eden, meanwhile, moves the data and the traffic with zero downtime. As an official Microsoft Cloud Adoption Framework partner, Datadog supports the full Azure migration life cycle by helping teams apply consistent observability practices across Redis, compute, storage, and other Azure services.
To learn more, read Datadog’s Azure Managed Redis integration documentation. To start a Redis migration with Eden, see Eden’s Redis migration page.
If you’re new to Datadog, you can sign up for a 14-day free trial to start monitoring your Azure Managed Redis caches.
此内容由惯性聚合(RSS阅读器)自动聚合整理,仅供阅读参考。 原文来自 — 版权归原作者所有。