






Regardless of how much effort teams put into developing, training, and evaluating ML models before they deploy, their functionality inevitably degrades over time due to several factors. Unlike with conventional applications, even subtle trends in the production environment a model operates in can radically alter its behavior. This is especially true of more advanced models that use deep learning and other non-deterministic techniques. It’s not enough to track the health and throughput of your deployed ML service alone. In order to maintain the accuracy and effectiveness of your model, you need to continuously evaluate its performance and identify regressions so that you can retrain, fine-tune, and redeploy at an optimal cadence.
In this post, we’ll discuss key metrics and strategies for monitoring the functional performance of your ML models in production, including:
Identifying key evaluation metrics
Monitoring proxy metrics like data and prediction drift
Detect data processing pipeline issues
But first, we’ll highlight some of the most common issues that can affect these models in production.
In this section, we’ll discuss the main problems inherent in running ML services in production by first illustrating the system you can use to evaluate your model. To monitor your model’s performance in production, you’ll need to set up a system that can look at both the data being fed to the model as well as its predictions. Effective model monitoring requires a service sitting alongside the prediction service that can ingest samples of input data and prediction logs, use them to calculate metrics, and forward these metrics to observability and monitoring platforms for alerting and analysis. The following diagram shows the flow of data in a typical model monitoring system, traveling from the ML pipeline to the monitoring service so that calculated metrics can be forwarded to observability and visualization tools:
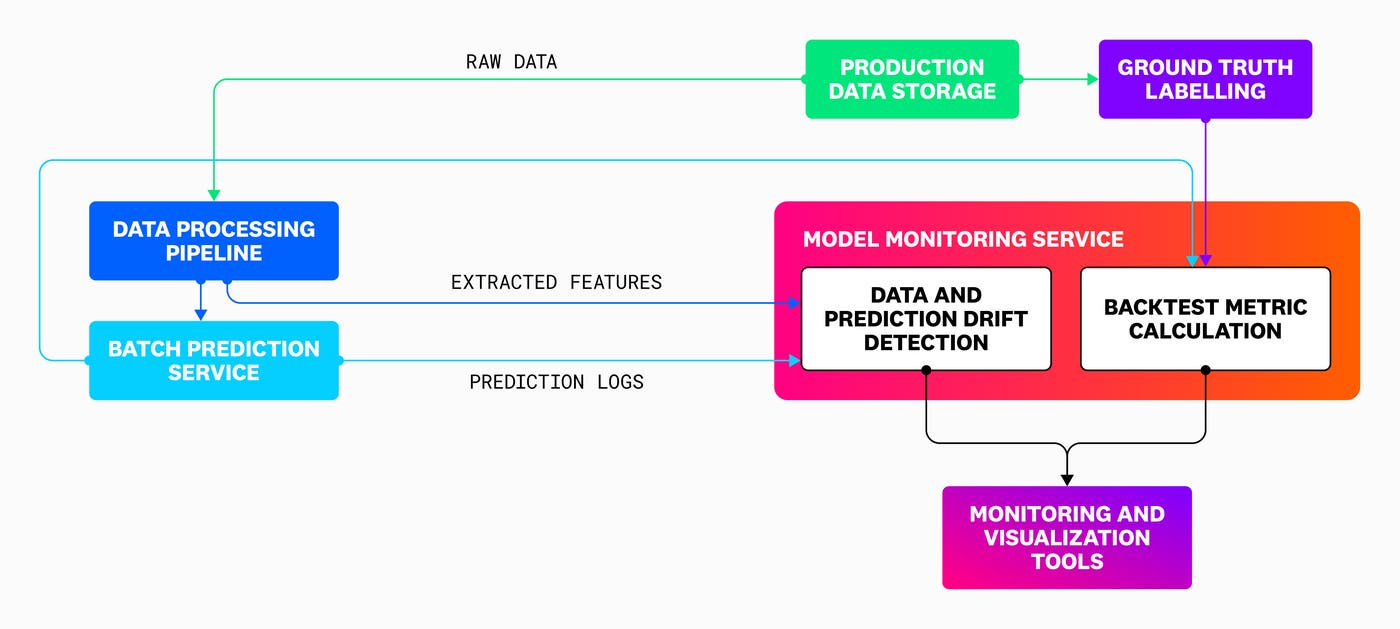
Where possible, the monitoring service should be able to calculate data and prediction drift metrics, as well as backtest metrics that directly evaluate the accuracy of predictions using historical data. By using this service, along with tools for monitoring the data processing pipelines being used for feature extraction, you can spot key issues that may be affecting the performance of your model. These include:
Training-serving skew
Data and concept drift
Data pipeline issues
Training-serving skew occurs when there is a significant difference between training and production conditions, causing the model to make incorrect or unexpected predictions. ML models have to be trained precisely with data that’s similar in structure and distribution to what they’ll see in production—while avoiding overfitting, which happens when the model is too closely fit to the training data so that it cannot generalize to the data it sees in production.
Production conditions can cause unpredictable changes in the data your model is working with. Drift refers to when these changes cause the model’s inputs and outputs to deviate in similarity to those that happened during training, which likely indicates a decrease in predictive accuracy and general reliability. To cope with drift, ML models generally have to be retrained at a set cadence. There are a few different kinds of drift that can occur.
Data drift refers to changes in the input data fed to the model during inference. It can manifest as changes in the overall distribution of possible input values, as well as the emergence of new patterns in data that weren’t present in the training set. Significant data drift can occur when real world events lead to changes in user preferences, economic figures, or other data sources, as in the COVID-19 pandemic’s effect on financial markets and consumer behavior. Data drift can be a leading indicator of reduced prediction accuracy, since a model will tend to lose its ability to interpret data that’s too dissimilar to what it was trained on.
Prediction drift refers to changes in the model’s predictions. If the distribution of prediction values changes a lot over time, this can indicate that either the data is changing, predictions are getting worse, or both. For example, a credit-lending model being used to evaluate users in a neighborhood with lower median income and different average household demographics from the training data might start making significantly different predictions. Further evaluation would be needed to determine whether these predictions remain accurate and are merely accommodating the input data shift, or whether the model’s quality has degraded.
Concept drift refers to that latter case, when the relationship between the model’s input and output changes so that the ground truth the model previously learned is no longer valid. Concept drift tends to imply that the training data needs to be expired and replaced with a new set.
Issues in the data processing pipelines feeding your production model can lead to errors or incorrect predictions. These issues can look like unexpected changes in the source data schema (such as a schema change made by the database admin that edits a feature column in a way that the model isn’t set up to handle) or errors in the source data (such as missing or syntactically invalid features).
Next, we’ll discuss how model monitoring can help you track and address each of these issues.
Where possible, you should use backtest metrics to track the quality of your model’s predictions in production. These metrics directly evaluate the model by comparing prediction results with ground truth values that are collected after inference. Backtesting can only be performed in cases where the ground truth can be captured quickly, and authoritatively used to label data. This is simple for models that use supervised learning, where the training data is labeled. It’s more difficult for unsupervised problems, such as clustering or ranking, and these use cases often must be monitored without backtesting.
In production, the ground truth needs to be obtained using historical data ingested at some feedback delay after inference. In order to calculate the evaluation metric, each prediction needs to be labeled with its associated ground truth value. Depending on your use case, you’ll either have to create these labels manually or pull them in from existing telemetry, such as RUM data. For example, let’s say you have a classification model that predicts whether a user who was referred to your application’s homepage will purchase a subscription. The ground truth data for this model would be the new signups that actually occurred.
In order to prepare your prediction data for backtesting, it’s ideal to first archive prediction logs in a simple object store (such as an Amazon S3 bucket or Azure Blob Storage instance). This way, you can choose to roll up logs at a desired time interval and then forward them to a processing pipeline that assigns the ground truth labels. Then, the labeled data can be ingested into an analytics tool that calculates the final metric for reporting to your dashboards and monitors. When generating the evaluation metric, it’s important to choose a rollup frequency both for the metric calculation and for its ingestion into your observability tools that balances granularity and frequent reporting with accounting for seasonality in the prediction trend. For example, you might choose to calculate the metric on a daily cadence and visualize it in your dashboards with a 15-day rollup.
Different evaluation metrics apply to different types of models. For example, classification models have discrete output, so their evaluation metrics work by comparing discrete classes. Classification evaluations like precision, recall, accuracy, and AU-ROC target different qualities of the model’s performance, so you should pick the ones that matter the most for your use case. If, say, your use case places a high cost on false positives (such as a model evaluating loan applicants), you’ll want to optimize for precision. On the other hand, if your use case places a high cost on missed true positives (such as an email spam filter), you’ll want to optimize for recall. If your model doesn’t favor precision, recall, or accuracy, and you want a single metric to evaluate its performance, you can use AU-ROC.
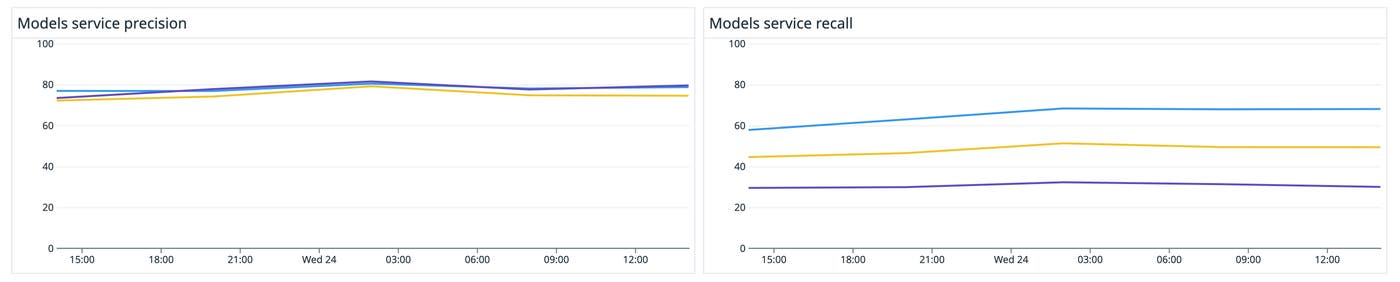
Because precision, recall, and accuracy are calculated using simple algebraic formulas, you can also easily use a dashboarding tool to calculate and compare each of them from labeled predictions. The following screenshot shows a dashboard that compares precision and recall across three different model versions.
For models with continuous decimal outputs (such as a regression model), you should use a metric that can compare continuous prediction and ground truth values. One frequently used metric for evaluating these kinds of models is root mean squared error (RMSE), which takes the square root of the average squared difference between ground truth and prediction.
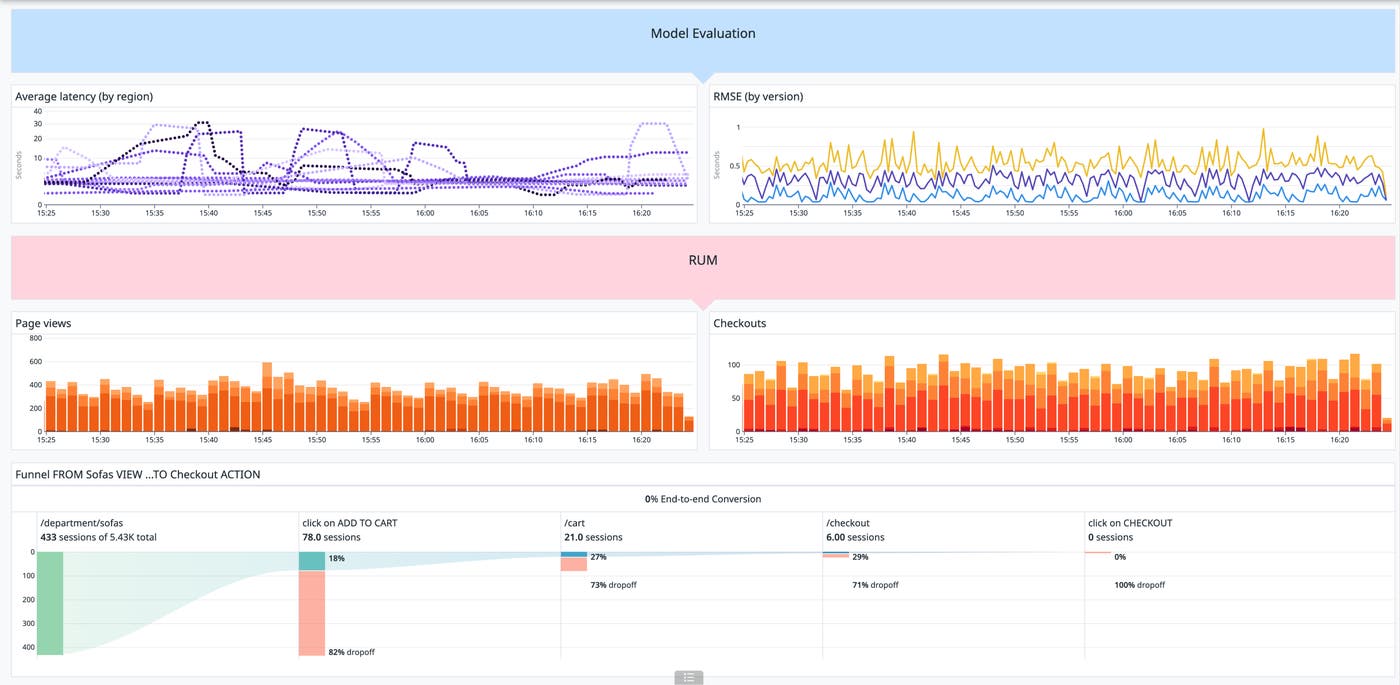
In order to understand not only whether your predictions are accurate relative to the ground truth but also whether or not the model is facilitating the overall performance of your application, you can correlate evaluation metrics with business KPIs. For example, taking the previous recommendation-ranking regression model, these KPIs might come from RUM data and track user engagement rates and intended business outcomes (such as signups or purchases) on the recommended pages.
Because your model relies on upstream and downstream services managed by disparate teams, it is helpful to have a central place for all stakeholders to report their analysis of the model and learn about its performance. By forwarding your calculated evaluation metrics to the same monitoring or visualization tool you’re using to track KPIs, you can form dashboards that establish a holistic view of your ML application. If your organization is testing multiple model versions simultaneously, this also makes it easier to build visualizations that track and break down model performance data and business analytics by those versions.
Ground truth evaluation metrics are the most accurate and direct way to monitor model performance, but are often difficult—if not impossible—to obtain within a reasonable feedback delay. Next, we’ll discuss how drift metrics can be collected as proxies to determine whether or not your model is performing similarly in production to how it performed on the test dataset used during training.
Even when ground truth is unavailable, delayed, or difficult to obtain, you can still use drift metrics to identify trends in your model’s behavior. Prediction drift metrics track the changes in the distributions of model outputs (i.e., prediction values) over time. This is based on the notion that if your model behaves similarly to how it acted in training, it’s probably of a similar quality. Data drift metrics detect changes in the input data distributions for your model. They can be early indicators of concept drift, because if the model is getting significantly different data from what it was trained on, it’s likely that prediction accuracy will suffer. By spotting data drift early, you can retrain your model before significant prediction drift sets in.
Managed ML platforms like Vertex AI and Sagemaker provide tailored drift detection tools. If you’re deploying your own custom model, you can use a data analytics tool like Evidently to intake predictions and input data, calculate the metrics, and then report them to your monitoring and visualization tools. Depending on the size of your data and the type of model, you’ll use different statistics to calculate drift, such as the Jensen Shannon divergence, Kolmogorov-Smirnov (K-S) test, or Population Stability Index (PSI).
For example, let’s say you want to detect data drift for a recommendation model that scores product pages according to the likelihood that a given user will add the product to their shopping cart. You can detect drift in this categorical model by finding the Jensen Shannon divergence between samples of the most recent input data and test data that was used during training.
To get a stable metric that isn’t too sensitive to local seasonal variations and that can detect changes with reasonable lag, you must choose an optimal rollup range. Your monitoring service should load each data set into arrays to use as inputs in the calculation of the final metric. Your service should then send the metric to a monitoring tool, so you can alert on it and track it in dashboards alongside other signals.
Feature drift and feature attribution drift on retrains break down data drift by looking at the distributions of the individual feature values and their attributions—a decimal value that changes how feature values are weighted in the calculation of the final prediction. While feature drift is typically caused by changes in the production data, feature attribution drift is typically the result of repeated retrains. Both of these metrics can help you find specific issues that may be related to changes in a subset of the data. For example, if a model’s predictions are drifting significantly while data drift looks normal, it may be that feature attribution drift is causing the final feature values to deviate. By monitoring feature attribution drift, you can spot these changing attributions that may be affecting predictions even as feature distributions remain consistent. This kind of case tends to imply that the feature drift was caused by frequent retraining, rather than changes in the input data.
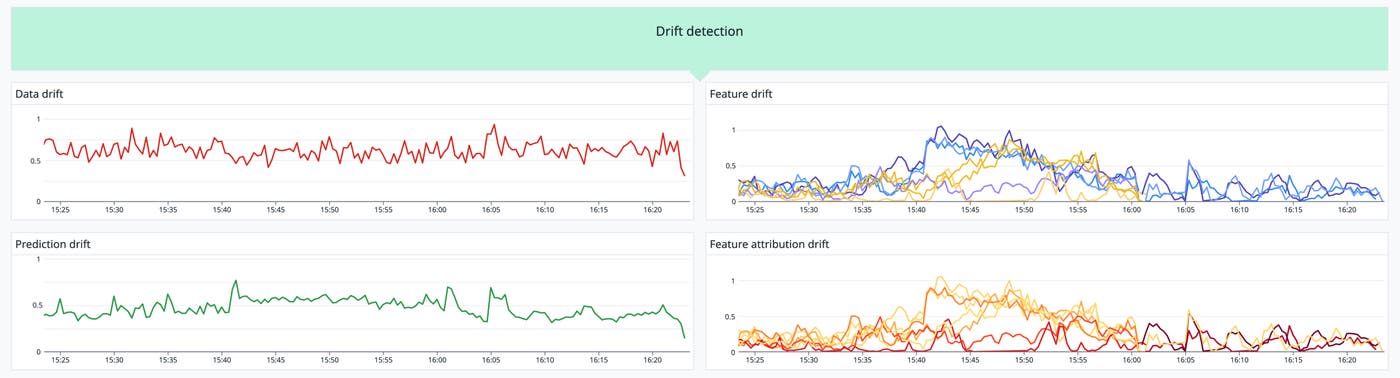
As you break down your model’s prediction trends to detect feature and feature attribution drift, it’s also helpful to consider how features interact with each other, as well as which features have the largest impact on the end prediction. The more features you have in your model, the more difficult it becomes to set up, track, and interpret drift metrics for all of them. For image and text based models with thousands to millions of features, you might have to zoom out and look only at prediction drift, or find proxy metrics that represent feature groups.
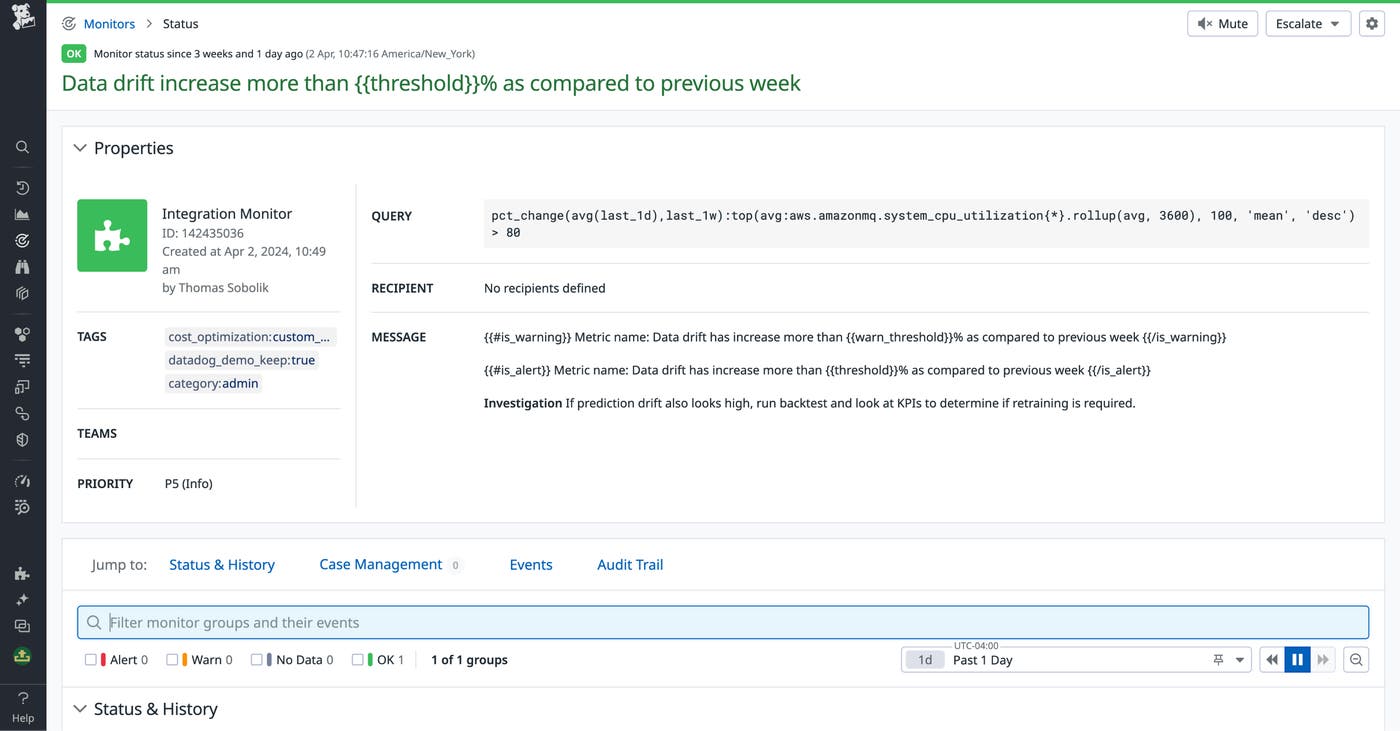
For any of these drift metrics, you should set alerts with thresholds that make sense for your particular use case. To avoid alert fatigue, you need to pick a subset of metrics that report quickly and are easy to interpret. The frequency of drift detection will determine how often you retrain your model, and you need to figure out a cadence for this that accounts for the computational cost and development overhead of training while ensuring that your model sticks to its SLOs. As you retrain, you must closely monitor for new feature and feature attribution drift, and where possible, evaluate predictions to validate whether or not retraining has improved model performance. For example, the following alert fires a warning when data drift increases by 50% week over week.
Failures in the data processing pipelines that convert raw production data into features for your model are a common cause of data drift and degraded model quality. If these pipelines change the data schema or process data differently from what your model was trained on, your model’s accuracy will suffer. Data quality issues can stem from issues like:
Changes in processing jobs that cause fields to be renamed or mapped incorrectly
Changes to the source data schema that cause processing jobs to fail
Data loss or corruption before or during processing
These issues often arise when multiple models that are addressing unique use cases all leverage the same data. Input data processing can also be compromised by misconfigurations, such as:
A pipeline points to an older version of a database table that was recently updated
Permissions are not updated following a migration, so that pipelines lose access to the data
Errors in feature computation code
You can establish a bellwether for these kinds of data processing issues by alerting on unexpected drops in the quantity of successful predictions. To help prevent them from cropping up in the first place, you can add data validation tests to your processing pipelines, and alert on failures to check whether the input data for predictions is valid. To accommodate the continual retraining and iteration of your production model, it’s best to automate these tests using a workflow manager like Airflow. This way, you can ingest task successes and failures into your monitoring solution and create alerts for them.
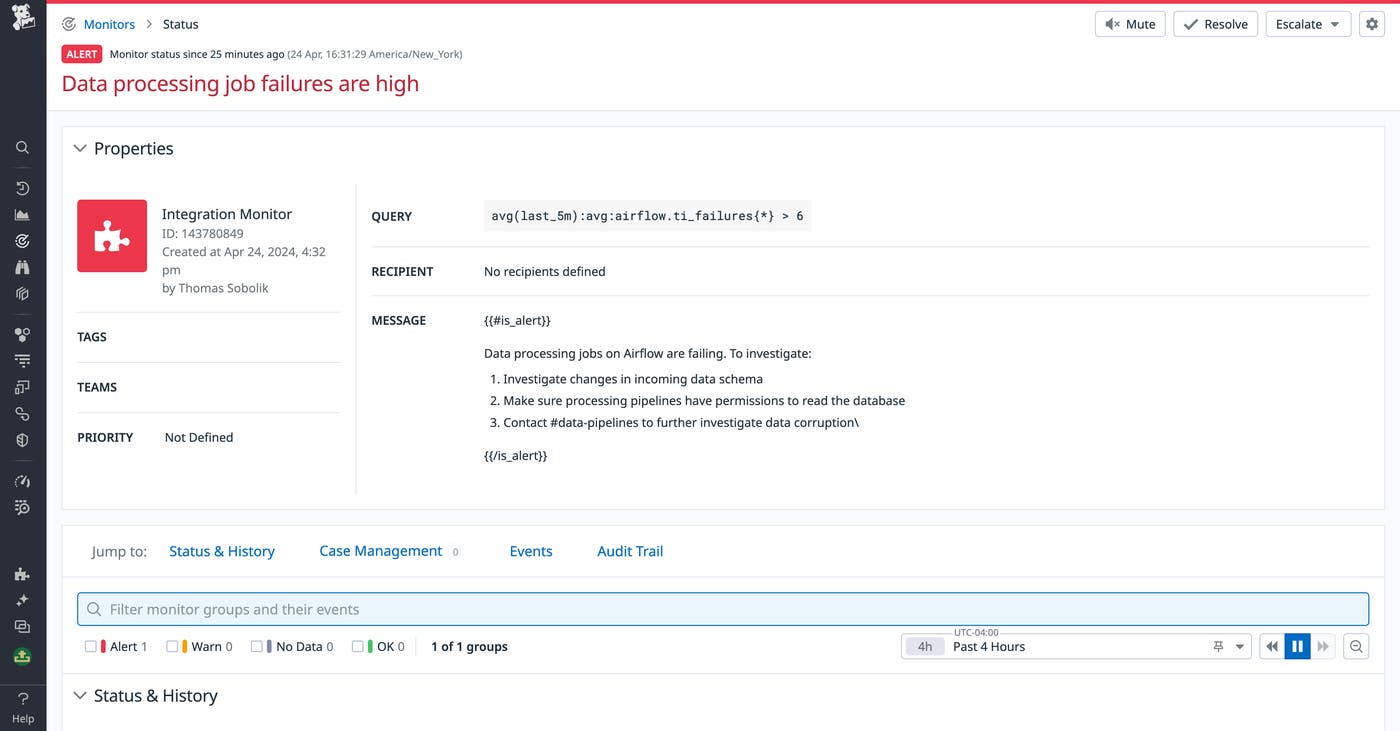
By tracking database schema changes and other user activity, you can help your team members ensure that their pipelines are updated accordingly before they can break. If you’re using a managed data warehouse like Google Cloud BigQuery, Apache Snowflake, or Amazon RedShift, you can query for schema change data, audit logs, and other context to create alerts in your monitoring tool.
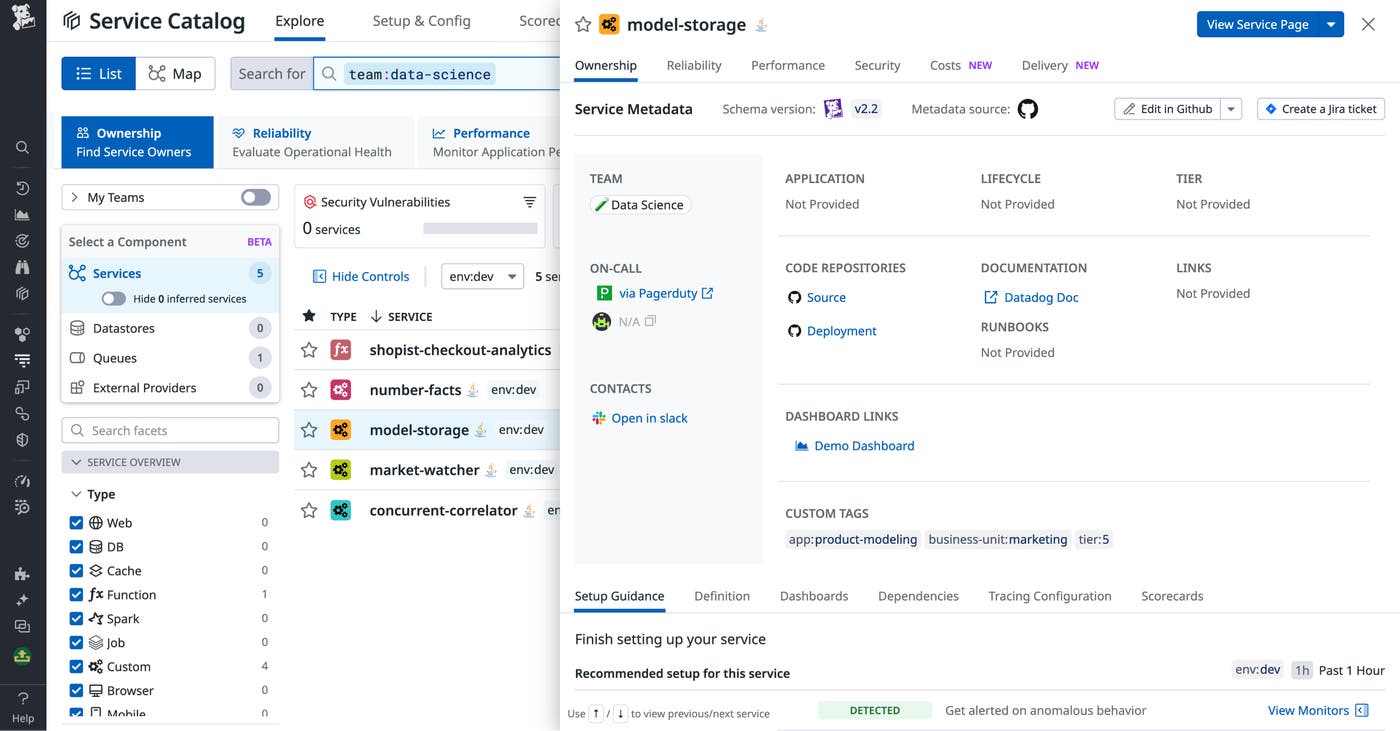
Finally, by using service management tools to centralize knowledge about data sources and data processing, you can help ensure that model owners and other stakeholders are aware of data pipeline changes and the potential impacts on dependencies. For example, you might have one team in your organization pulling data from a feature store to train their recommendation model while another team is managing that database and a third team starts pulling it for business analytics. A service catalog enables the database owners to centralize the docs detailing its schema and make it easier to contact them to request a change, while also mapping the dependent services owned by the other two teams.
While it’s not always possible to directly evaluate the performance of your ML model the way you can with a conventional service, it’s paramount to collect as much data as you can to interpret its behavior effectively. Rather than flying blind once you’ve trained, evaluated, and deployed a new model, you must find ways to continuously monitor it in production in a manner that suits your use case and business needs. Direct evaluation metrics, drift detection, and data pipeline monitoring are three of the most powerful tools at your disposal to ensure that your ML-powered service remains stable and performant over time.
Datadog includes products and features such as Log Management, Event Management, custom metrics, alerts, dashboards, and more to help you centralize ML observability data and form more powerful insights. Datadog also helps you achieve full-stack ML platform observability with integrations not only for ML services like Vertex AI and Sagemaker but also for the most popular databases, workflow tools, and compute engines. By forwarding your ML model performance metrics to Datadog, you can track and alert on them alongside telemetry from the rest of your system, including RUM data to help interpret your model’s business impact. To get started with Datadog, sign up for a free trial.
此内容由惯性聚合(RSS阅读器)自动聚合整理,仅供阅读参考。 原文来自 — 版权归原作者所有。