





The Windows operating system exposes metrics such as CPU, memory, and disk usage as built-in performance counters, which provide a unified way to observe performance, state, and other high-level facets of Windows subsystems, components, and native or third-party applications. As such, Windows Performance Counters can be invaluable for monitoring resource usage and the health of your infrastructure, as well as systems your services are using. For example, a system administrator can monitor performance counters to ensure that infrastructure resources are sufficiently provisioned, stay ahead of bottlenecks in the system, perform root-cause analysis, and troubleshoot issues. Additionally, DevOps engineers and developers might use performance counters to better understand resource usage of the services they own in order to make changes to optimize efficiency, reduce costs, and improve end-user experience.
While Windows Performance Counters can be monitored with the built-in GUI utility, users may want to view and analyze these performance counters remotely, alongside other key metrics and telemetry from across the stack that they are already monitoring.
It’s useful to view these metrics within the context of a unified monitoring solution like Datadog, which seamlessly maps the broad selection of Windows native telemetry to Datadog metrics, which you can slice and dice, sort, filter, and aggregate. Datadog’s Windows Performance Counters check is a configuration included in the Datadog Agent package that monitors Windows Performance Counters and streams them into Datadog.
In this post, we’ll show you how to:
Conceptualize Windows Performance Counters to more effectively monitor them
Use the check to start collecting Windows Performance Counters in Datadog
Determine which Windows Performance Counters to monitor
Conceptually speaking, Windows Performance Counters are metrics, but for users who have never monitored them, their terminology can be confusing. Therefore, before explaining how to monitor Windows Performance Counters, it will be useful to break them down into their conceptual building blocks.
Each individual performance counter can be expressed as a path, with the path separator \ (e.g., \LogicalDisk(*)\% Disk Read Time). This path maps to the logical categories that Windows Performance Counters can be broken down into: countersets, counters, and instances.
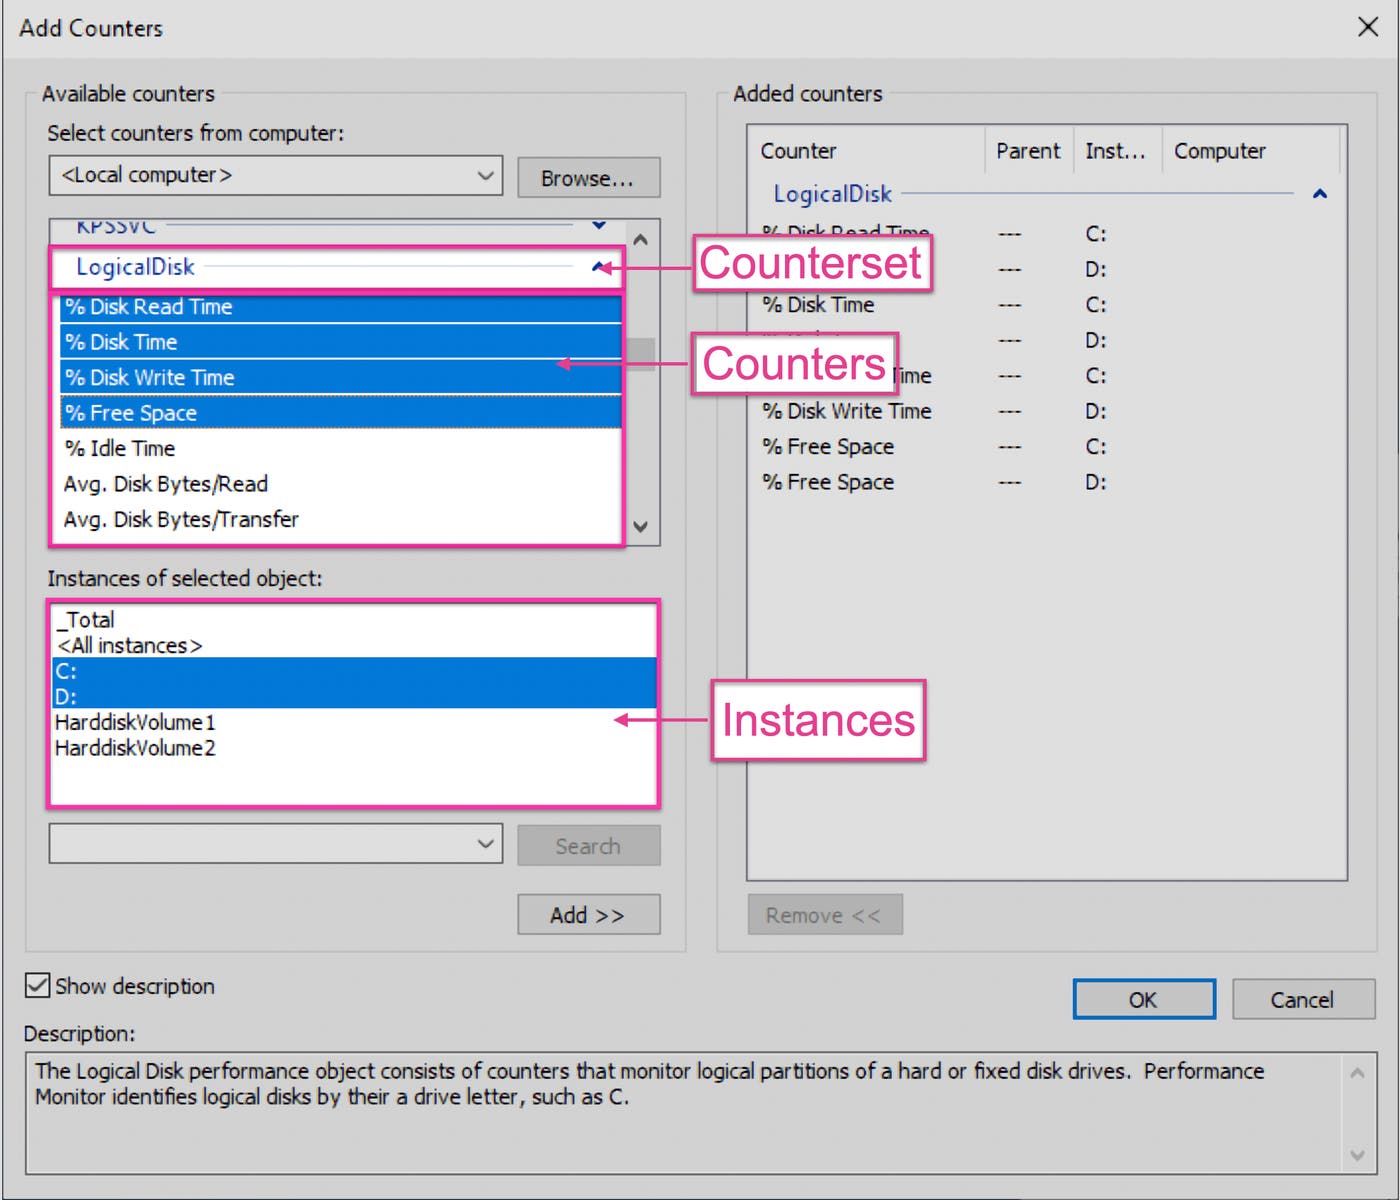
Think of a counterset (also called a performance object) as a table that logically groups metrics (e.g., % Disk Read Time, % Disk Write Time) under an umbrella (in this case LogicalDisk) for each instance (e.g., C:, D:). Using this analogy, a counter can be understood as one of the table’s columns, and an instance as one of its rows. Accordingly, a performance counter value can be thought of as a cell in the table.
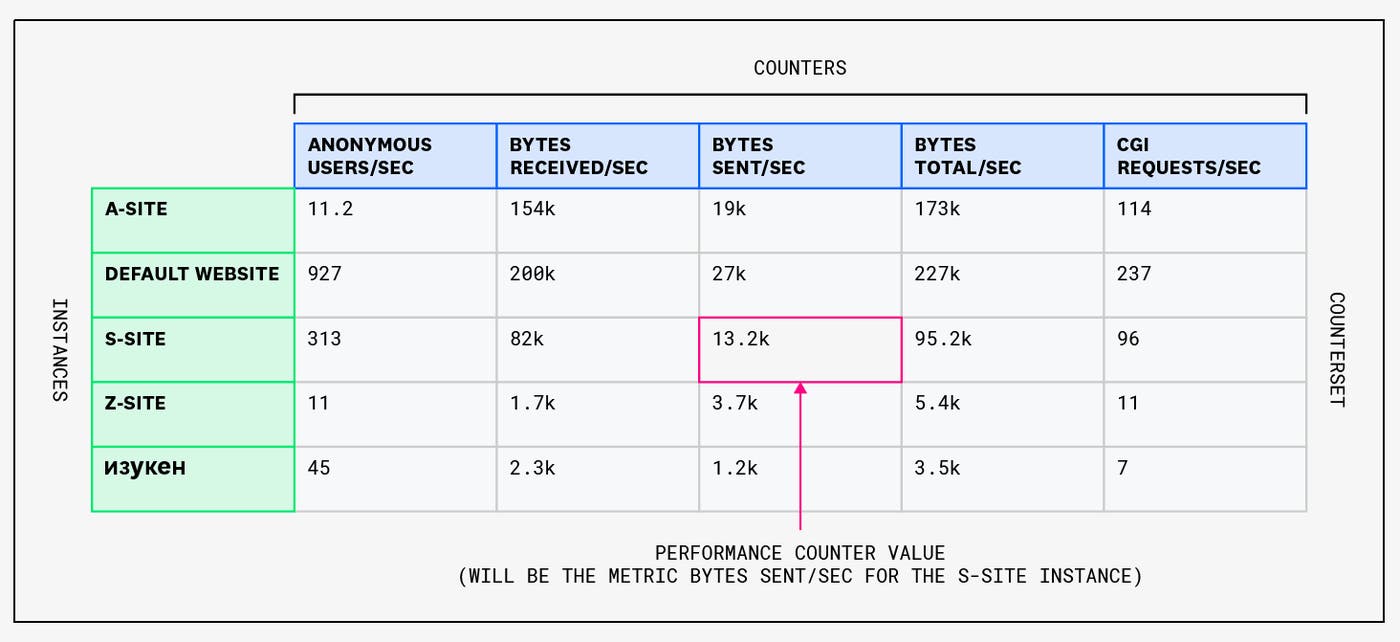
Out of the box, Windows provides built-in performance counters for many dozens of features (we use this term to encompass the many layers, components, services, and applications that have embedded performance counters). A single feature may use one or more countersets (e.g., IIS may be using about six countersets), and some third-party applications expose their own countersets (e.g., Oracle Client or VMWare vSphere). These countersets provide a great window—sometimes the only window—into how a feature is performing.
Now that we’ve explained Windows Performance Counters at the conceptual level, let’s see how to leverage them in practice to better monitor your Windows applications.
Say you’re a system administrator of a fintech application that runs on a distributed microservice architecture. A crucial part of your responsibility involves monitoring the golden metrics (throughput, error rate, and latency) for the services you own, so you can quickly respond to any performance issues and ensure a positive end-user experience. To achieve this, you want to track Windows Performance Counters for metrics like logical disk usage across all Windows machines hosting your service that are also monitored by the Datadog agent.
To configure the Windows Performance Counters check in Datadog, edit the windows_performance_counters.d/conf.yaml file, in the conf.d/ folder at the root of your Agent’s configuration directory to start collecting your windows_performance_counters. See the sample file for all configuration options.
Once you’ve chosen one or more Windows Performance Counters to map into corresponding Datadog metrics, you can list the counters under countersets, as in the example below.
## The top-level keys are the names of the desired performance objects:
##
## metrics:
## System:
## <OPTION_1>: ...
## <OPTION_2>: ...
## LogicalDisk:
## <OPTION_1>: ...
## <OPTION_2>: ...
For each counterset, you must list the counters that you want to track. (The counters available for each counterset will vary depending on your system. You can find the list of available counters using the built-in perfmon.exe GUI tool, the typeperf CLI tool, or the Get-Counter powershell CLI command.) For example, let’s say you want to report metrics for the LogicalDisk counterset. You would configure the configuration file as in the example below.
init_config:
instances:
- metrics:
LogicalDisk:
name: logicaldisk
tag_name: disk
counters:
- '% Disk Read Time': percent_disk_read_time
- '% Disk Time': percent_disk_time
- '% Disk Write Time': percent_disk_write_time
- '% Free Space': free_space
- 'Avg. Disk Bytes/Read': avgerage_disk_bytes_read
enable_health_service_check: true
namespace: performance
min_collection_interval: 15
empty_default_hostname: false
The configuration above maps these Windows Performance Counters:
\LogicalDisk(*)\% Disk Read Time
\LogicalDisk(*)\% Disk Time
\LogicalDisk(*)\% Disk Write Time
\LogicalDisk(*)\% Free Space
\LogicalDisk(*)\Avg. Disk Bytes/Read
To these Datadog metrics:
performance.logicaldisk.percent_disk_read_time
performance.logicaldisk.percent_disk_time
performance.logicaldisk.percent_disk_write_time
performance.logicaldisk.free_space
performance.logicaldisk.avgerage_disk_bytes_read
Once you’ve configured the Agent file, Windows Performance Counter metrics will stream into Datadog, and you will be able to view them in the Metrics Explorer.
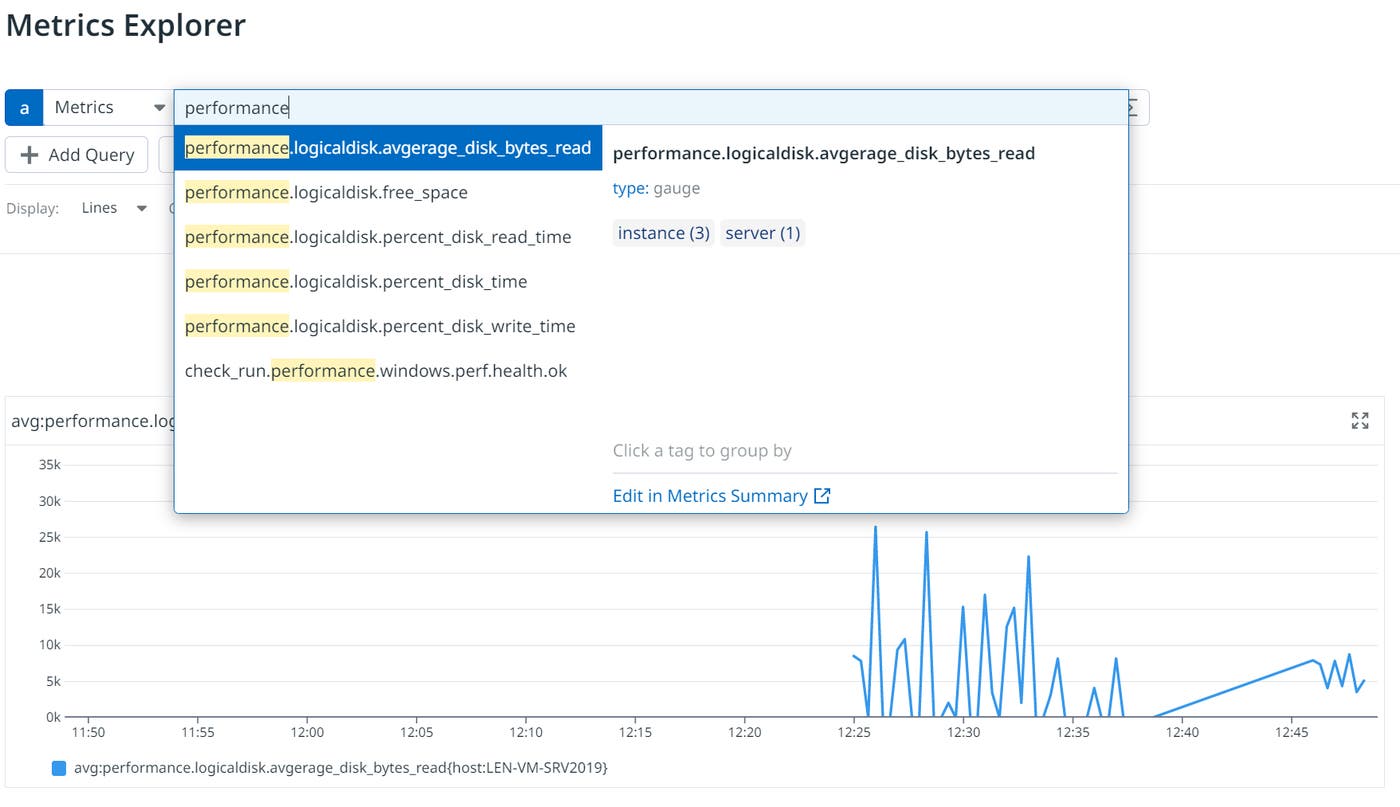
The above configuration is the minimum needed to begin tracking Windows Performance Counters in Datadog, but there are other optional facets to the configuration that provide additional data and granularity to your monitoring.
For instance, say you’re a software engineer working on a payment service for the same fintech application we mentioned above, and you want to map multi-instance counters to Datadog metrics to filter for only the performance counters coming from the instance running your service. In Datadog, single and multi-instance counters do not appear as different metrics, because all instance values for a counter are added together, and the total value is reported as a single metric. However, you can see all the instance’s individual counters by using a group by aggregation (e.g., avg by, sum by, etc) for the tag called instance.
To continue our example of the LogicalDisk counterset, the illustration below shows two instances, C: and D:

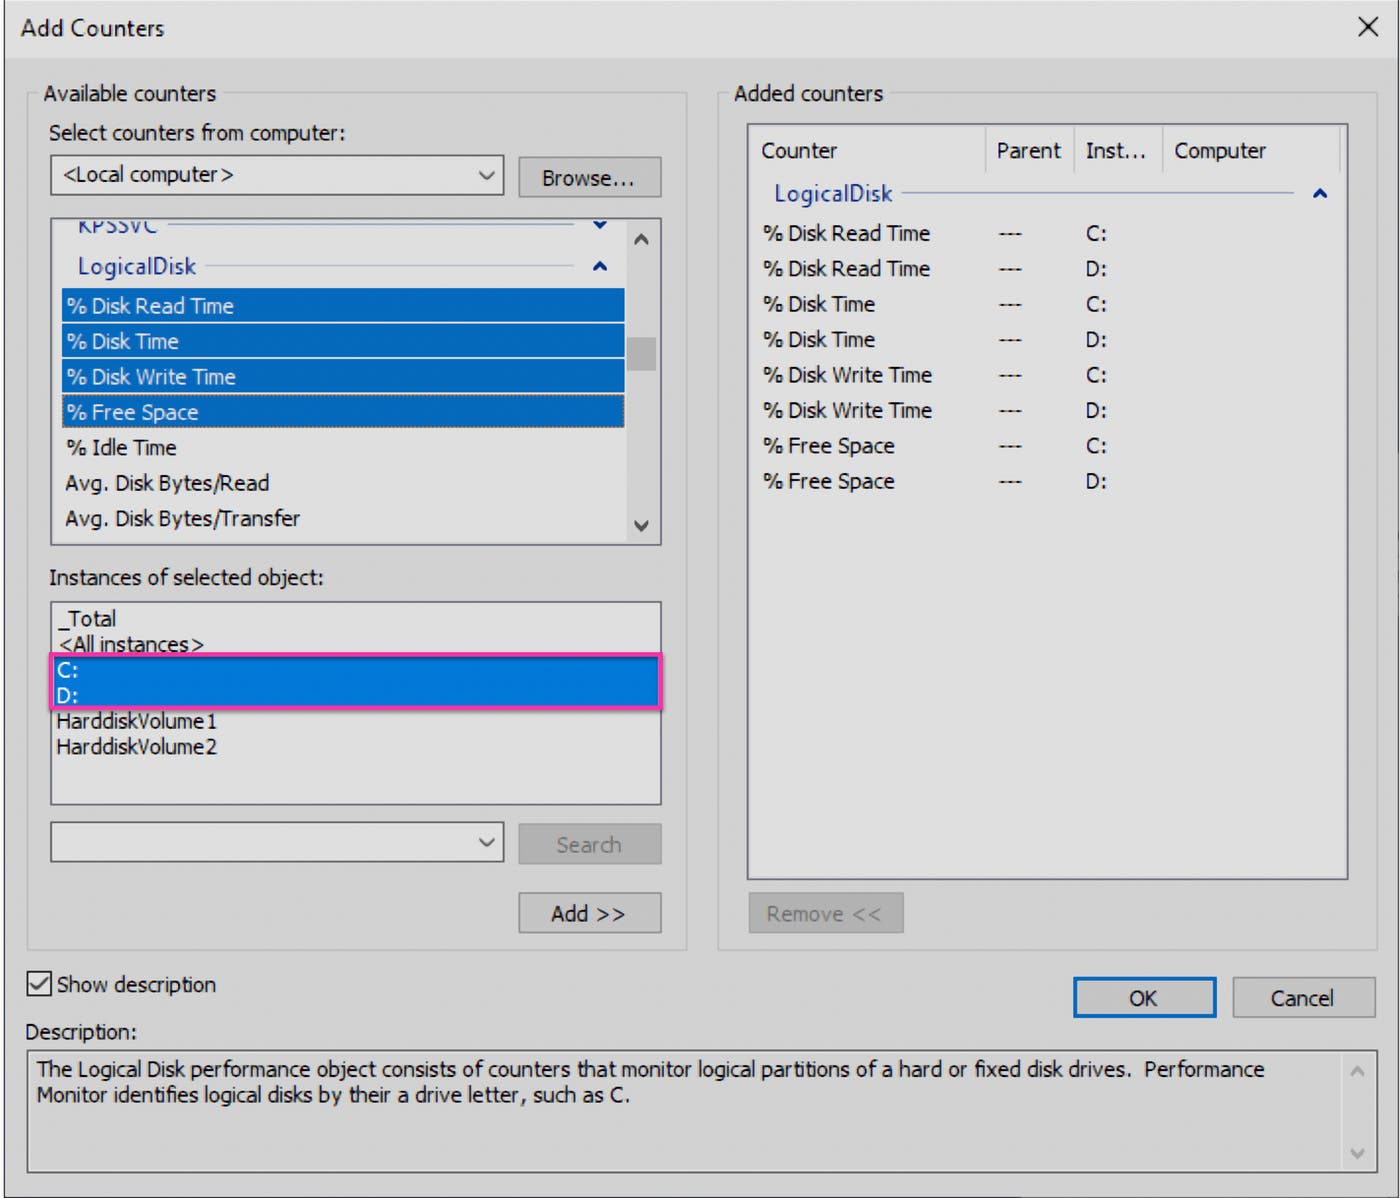
If you’ve configured the Windows Performance Counter check with the minimal settings above, querying a metric such as performance.logicaldisk.percent_disk_write_time will yield a timeseries without any instances, as in the illustration below.
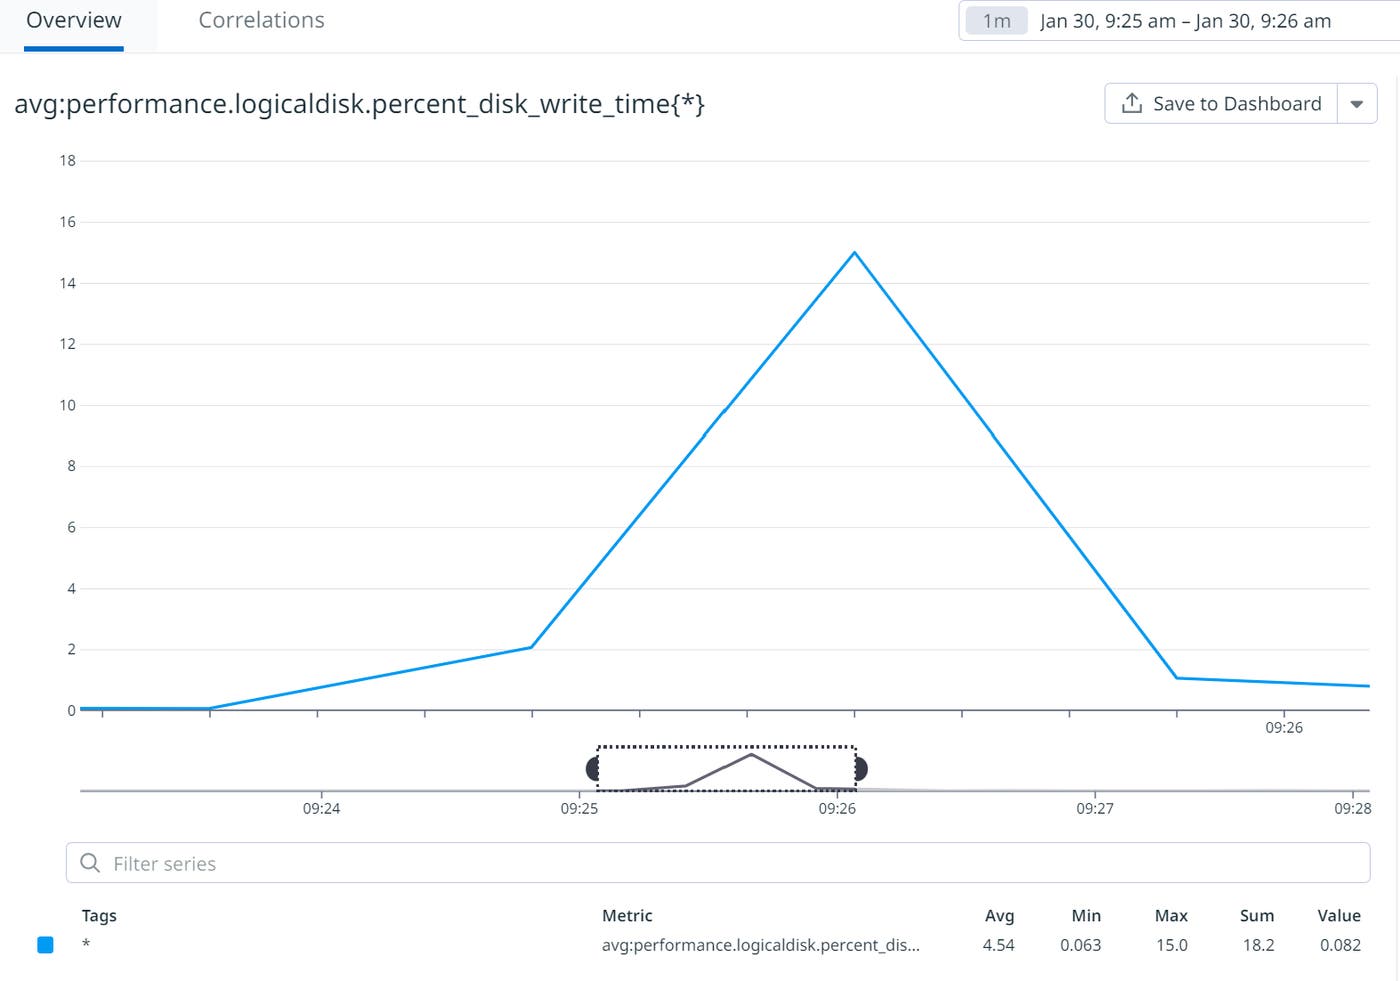
However, the instances (in our case, disk C: and disk D:) are tracked as Datadog tags, which can be used to give additional context to performance counter metrics, allowing you more granularity when querying them. In this example, we can use the average by aggregation to surface the instance tags.
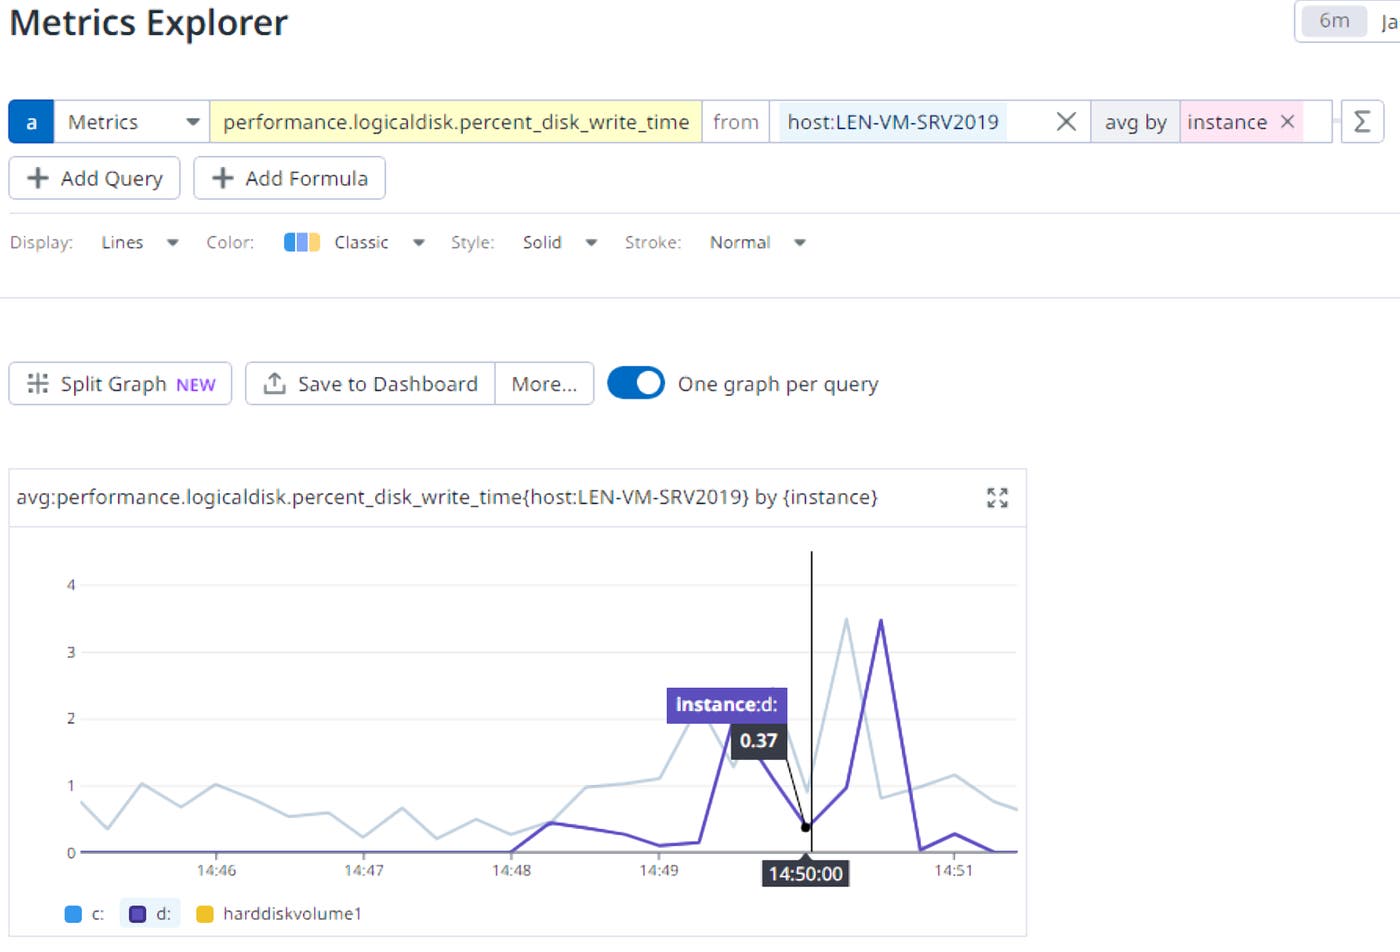
You can manually override the instance tag (e.g., to replace a general instance tag with the more suitable name disk) by using the tag_name field in the config file, as Datadog automatically tags instances.
init_config:
instances:
- metrics:
LogicalDisk:
name: logicaldisk
tag_name: disk
counters:
- '% Disk Read Time':
name: percent_disk_read_time
- '% Disk Time':
name: percent_disk_time
- '% Disk Write Time':
name: percent_disk_write_time
- '% Free Space':
name: free_space
- 'Avg. Disk Bytes/Read':
name: avgerage_disk_bytes_read
enable_health_service_check: true
namespace: performance
min_collection_interval: 15
empty_default_hostname: false
Windows Performance Counters offer a high-level view into the health and resources in your operating system that can be used to identify performance issues, monitor resource usage, and understand how applications are running on their systems.
For example, monitoring resource metrics such as CPU, memory, and disk can help DevOps teams prevent issues from arising downstream from infrastructure. Monitoring network metrics can help developers spot issues that manifest as traffic spikes, drops, or latency between different endpoints.
You can use Microsoft’s documentation to learn more about which performance counters to monitor for specific technologies, including IIS, AD FS, ADO.NET, BizTalk, Failover Clustering, Exchange, SQL Server, and WCF.
Windows Performance Counters offer deep visibility into the internal state of an application in a production environment, as well as the health and performance of your Windows operating system. This visibility enables teams to track resource usage and design performant, effective apps that will satisfy customers.
Datadog increases the potential of monitoring Windows Performance Counters by offering you visibility into multiple machines; the ability to sort, aggregate, slice, and dice metrics; tag metrics by facets like service or host; and much more.
Additionally, Datadog customers can easily view Windows Performance Counters alongside service data from other operating systems, distributed tracing to see how incidents propagate across your system, security metrics, and telemetry from across the stack, helping break down silos between teams.
Check out our documentation to start sending your Windows Performance Counters metrics to Datadog. If you’re new to Datadog, sign up for a 14-day free trial.
此内容由惯性聚合(RSS阅读器)自动聚合整理,仅供阅读参考。 原文来自 — 版权归原作者所有。