








David M. Lentz
In Part 1 of this series, we saw how Amazon MQ routes messages between services in a distributed application, and we looked at some of the key metrics that describe the performance of the message broker and its destinations. Now that we’ve introduced the metrics and their meaning, we’ll look at some tools you can use to collect and query metrics from Amazon MQ:
Amazon CloudWatch is the built-in monitoring solution that you can use to collect metrics and logs from Amazon MQ and any other AWS services you’re using. If your messaging clients are running on EC2 instances, you can view their metrics in CloudWatch alongside metrics and logs from your Amazon MQ brokers and destinations. In this section, we’ll look at how you can monitor Amazon MQ using the CloudWatch console, the CloudWatch CLI, and the CloudWatch SDK. To access these services, you’ll need to have the appropriate permissions. Before proceeding, use AWS Identity and Access Management to apply the permissions necessary to access the CloudWatch console and API.
The CloudWatch console is a web UI you can use to visualize metrics and analyze logs from AWS services, including your Amazon MQ brokers and destinations. In this section, we’ll show you how you can use the CloudWatch console to view Amazon MQ metrics and logs, and create alarms to notify you of potential issues with the performance of your brokers and destinations.
CloudWatch automatically collects metrics from your Amazon MQ deployment, including all of the broker and destination metrics we covered in Part 1 of this series. CloudWatch has a built-in dashboard that helps you visualize several Amazon MQ metrics:
CloudWatch also makes it easy to create your own graphs and dashboards. To create a graph, first click the Metrics link on the CloudWatch console, then click the name of an AWS service (e.g., Amazon MQ) to see a list of metrics available for that service. You can also type a metric name into the search field.
CloudWatch displays three categories of Amazon MQ metrics: Queue Metrics by Broker, Topic Metrics by Broker, and Broker Metrics. (In Part 1 of this series, we placed queue metrics and topic metrics together as Destination metrics.) In the screenshot below, we’re graphing the HeapUsage metric from the TestBrokerA-1 broker.
You can visualize metrics from different Amazon MQ categories and even different AWS services on a single graph to easily correlate data from different sources. In the screenshot below, a graph shows the HeapUsage metric from the TestBrokerA-1 broker, the MemoryUsage metric from that broker’s testqueue1 queue, and the CPUUtilization metrics from two EC2 instances that host producers that send messages to the broker.
After you’ve selected metrics to add to your graph, you can save the graph to a dashboard where you can combine it with other visualizations.
You can also use CloudWatch to collect and analyze your Amazon MQ logs to get context around questions that arise as you view the metrics. For example, a graph that shows a drop in a destination’s EnqueueCount metric can draw your attention to a potential issue, but if you can correlate that spike with an Amazon MQ log, you’ll have further information to understand the problem.
You can use CloudFormation, the AWS CLI, or the Amazon MQ console to configure your broker to send logs to CloudWatch. (Once you’ve changed your broker’s configuration, you’ll need to reboot the broker to apply the change and start collecting logs.) You can collect Audit logs, which record changes made to your Amazon MQ service (for example via the API), and General logs, which describe events such as when a broker starts up or when producer flow control is activated.
To see your Amazon MQ logs in CloudWatch Logs, click the Logs link on the main page of the CloudWatch console. You’ll see a log group listed for each Amazon MQ broker that’s configured to send logs to CloudWatch; click the name of a log group to see that broker’s logs. The screenshot below shows the log stream that was automatically created when we launched an Amazon MQ broker.
You can easily define alarms in CloudWatch to notify you automatically if the value of any of the Amazon MQ metrics you’re monitoring strays above or below a threshold you identify. You can also base your alarms on your log data by creating a log filter to extract your desired metrics.
The example below shows how you can create a CloudWatch alarm that will trigger if your broker’s TotalMessageCount metric—the number of messages across all of your destinations—breaches a specific upper threshold of 15,000. If the alarm triggers, it can indicate that your consumers are slow and your broker may run out of resources.
You can configure CloudWatch to publish alarm notifications to an SNS topic so you’ll receive an email if the alarm is triggered. If your consumers are running on EC2 instances, you could also configure the same CloudWatch alarm to trigger an Auto Scaling action and automatically scale out your fleet.
We’ve seen how the CloudWatch console allows you to create graphs, dashboards, and alarms to monitor Amazon MQ. But you may also need to add monitoring to your shell scripts or other automated processes. For this, you can use the AWS command-line interface (CLI) to programmatically query the CloudWatch API and retrieve Amazon MQ metrics. In this section, we’ll show some examples of how to use the AWS CLI to collect some of the metrics we introduced in Part 1 of this series.
To start using the AWS CLI, follow the installation steps provided for your platform in the documentation. Then use the aws configure command to provide your AWS account information and set your preferred region and output format.
Once you have installed and configured the CLI, you can issue commands to interact with the APIs of the different AWS services. In this section, we will use the aws cloudwatch command to query CloudWatch metrics. In the get-metric-statistics subcommand, include the following required arguments:
namespace: The AWS service from which to retrieve metrics. For Amazon MQ metrics, use AWS/AmazonMQ.metric-name: We named some key metrics in Part 1 of this series. For a complete list of available broker and destination metrics, see the AWS documentation.start-time: The date and time of the start of your requested metrics, specified in UTC format.end-time: The date and time of the end of your requested metrics, specified in UTC format.period: This is the length of time over which the metric will be aggregated, specified in seconds. For example, a query with a period value of 60 will aggregate and apply the designated statistic operation (see below) to all datapoints within each 60-second period. The period argument only allows certain values, depending on the time range and the resolution of the metrics being queried. See the documentation for guidance.statistics or extended-statistics: One of these two arguments must be present in each query. You can use statistics to tell CloudWatch how to process the datapoints to return a single value (e.g., Average or Sum) for each period. Use extended-statistics to get CloudWatch to return percentile values like p50 or p99.The CloudWatch API will return an error if your query results comprise more than 1,440 datapoints. You can avoid this error by adjusting your start-time, end-time, and period values to request a smaller batch of metrics. See the get-metric-statistics documentation for more information on refining your query.
The get-metric-statistics subcommand also accepts several optional arguments you can use to focus your query:
region: By default, your query will search within the AWS region you specified when you initially configured the CLI. (To review and update the defaults you’ve configured, type aws configure and enter new values as appropriate.) You can override this default by including the region argument in your query.dimensions: Specify dimensions as key-value pairs in your query to limit the scope of the metrics returned. For collecting the key Amazon MQ metrics we identified in Part 1 of this series, your queries must specify values for the broker dimension and, in some cases, also the destination dimension.Destination metrics, like MemoryUsage, ConsumerCount, and QueueSize, are scoped to individual destinations, and the values of these metrics on each destination are independent of other destinations. Other key metrics are broker metrics, like StorePercentUsage and TotalMessageCount, which describe resource usage across the broker regardless of the resource usage of any single destination.
The sample query below fetches the average QueueSize of the testqueue destination on the broker named MyBroker in the us-west-2 region:
aws cloudwatch get-metric-statistics --namespace "AWS/AmazonMQ" --metric-name QueueSize --statistics Average --start-time 2019-07-17T18:30:00Z --end-time 2019-07-17T19:00:00Z --period 600 --region us-west-2 --dimensions Name="Broker",Value="MyBroker" Name="Queue",Value="testqueue"
Because the query specifies a 10-minute granularity (period) and a 30-minute time span, it returns three records, each showing the average of all the QueueSize datapoints within the period:
{
"Label": "QueueSize",
"Datapoints": [
{
"Timestamp": "2019-07-17T18:40:00Z",
"Average": 20.0,
"Unit": "Count"
},
{
"Timestamp": "2019-07-17T18:50:00Z",
"Average": 20.0,
"Unit": "Count"
},
{
"Timestamp": "2019-07-17T18:30:00Z",
"Average": 20.0,
"Unit": "Count"
}
]
}
You can also use the AWS SDKs to build a custom solution to programmatically collect Amazon MQ metrics and logs from CloudWatch. AWS supports many languages—including Node.js, Python, and Go—that you can use to build applications that access the CloudWatch API.
In this section, we’ve looked at different ways CloudWatch makes Amazon MQ metrics and logs available. For complete visibility into your messaging infrastructure, you should adopt a platform that regularly queries the CloudWatch API and allows you to view, analyze, and alert on your Amazon MQ metrics and logs. In Part 3 of this series, we’ll show you how you can use Datadog to get deep visibility into Amazon MQ.
The ActiveMQ Web Console is a web-based tool that gives you an easy way to view some of the metrics emitted by Amazon MQ, such as queue sizes and storage space in use. The Web Console is installed automatically when you create an Amazon MQ broker instance, but you need to create a user that has permission to access it. You can use CloudFormation, the AWS CLI, or the Amazon MQ console to configure a user to access the ActiveMQ Web Console.
The screenshot below illustrates using the Amazon MQ console to create a user with ActiveMQ Web Console access:
Once your Amazon MQ broker is up and running, choose it from your list of brokers in the Amazon MQ console, then scroll down to the ActiveMQ Web Console section of the page and click the link. You’ll be directed to that broker’s ActiveMQ Web Console.
When you click the “Manage ActiveMQ broker” link, you’ll be prompted to log in as a user with console access permission, like the consoleuser we created in the example above.
The main page of the ActiveMQ Web Console displays information about the broker’s memory usage (MemoryPercentUsage), as well as disk space used for the persistent message store (StorePercentUsage) and for the temp store (TempPercentUsage).
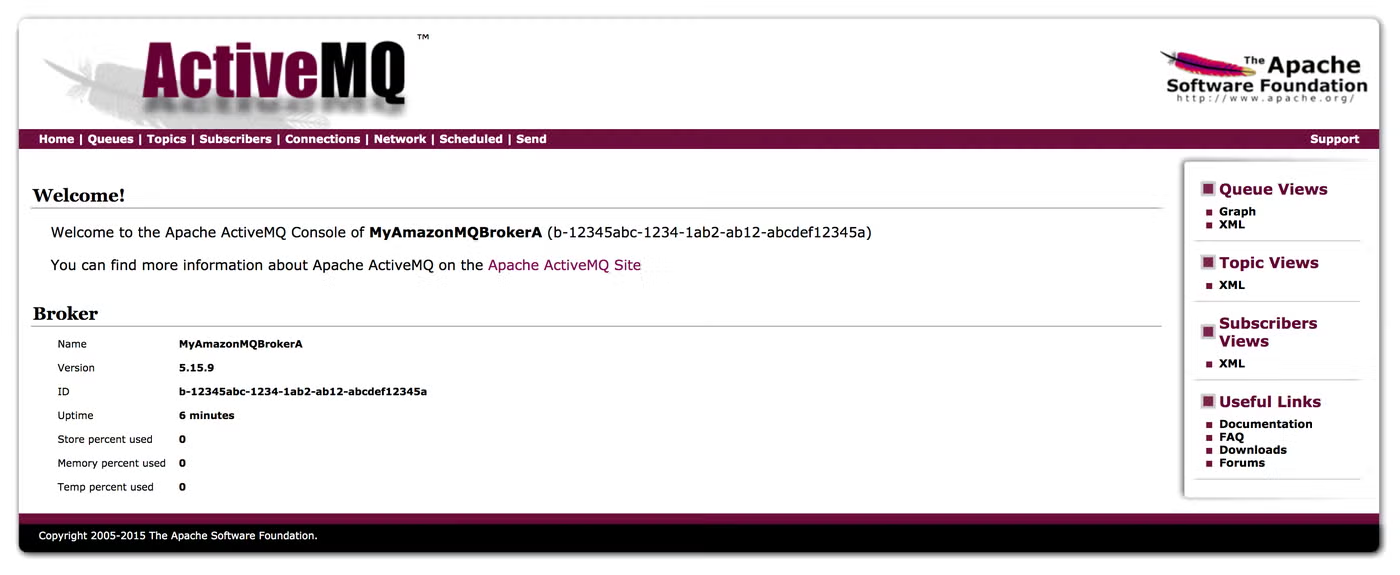
Note that the TempPercentUsage metric is visible on the ActiveMQ Web Console (as Temp percent used, shown in the screenshot above), but isn’t available in CloudWatch. This means you can only see the amount of space your broker uses to store non-persistent messages if you log in to view it in the ActiveMQ Web Console.
You can use the top navigation bar to view pages that list data from your queues and topics. These pages show many (but not all) of the destination metrics we highlighted in Part 1 of this series. The screenshot below shows metrics from two queues, including the number of pending messages (QueueSize) and the number of consumers (ConsumerCount).
The ActiveMQ console makes it easy to see the current value of some basic metrics from your broker and its destinations. It doesn’t allow you to graph metrics to visualize trends over time. You also can’t use it to create alerts to inform you of changes that could indicate a problem with your messaging infrastructure.
In Part 1 of this series, we explained some Amazon MQ metrics you should monitor to understand the resource usage and performance of your broker and destinations. In this post, we’ve given an overview of two tools you can use to monitor Amazon MQ.
CloudWatch is a full-featured service you can use to visualize and alert on Amazon MQ metrics and view Amazon MQ logs. The ActiveMQ Web Console is built in to each Amazon MQ broker you create, but only shows current values of a few metrics, and lacks features for creating graphs and alerts or collecting logs.
For complete visibility into your brokers, destinations, and clients, you need a monitoring platform that allows you to visualize and alert on metrics and logs from Amazon MQ, other AWS services, and the infrastructure that runs it all. In Part 3 of this series, we’ll show you how you can use Datadog to collect and analyze metrics and logs from your entire messaging infrastructure.
Source Markdown for this post is available on GitHub. Questions, corrections, additions, etc.? Please let us know.
We wish to thank Ram Dileepan and Rick Michaud at AWS for their technical review of this post.
此内容由惯性聚合(RSS阅读器)自动聚合整理,仅供阅读参考。 原文来自 — 版权归原作者所有。