








Collaboration and communication are critical to the successful implementation of service level objectives. Development and operational teams need to evaluate the impact of their work against established service reliability targets in order to improve their end user experience. Datadog simplifies cross-team collaboration by enabling everyone in your organization to track, manage, and monitor the status of all of their SLOs and error budgets in one place. Teams can visualize their SLOs alongside relevant services and infrastructure components on dashboards—and share the real-time status of those SLOs with any stakeholders that depend on them.
In this post, we will discuss some best practices for managing your SLOs in Datadog, and show you how to: - Choose the best SLO for each use case - Add names, descriptions, and tags to your SLOs - Group your SLOs with tags - Visualize your SLOs on dashboards
In Datadog, you can create three types of SLOs: - A metric-based SLO, which uses your metrics in Datadog to calculate its SLI. The SLI is defined as the number of good requests over the total number of valid requests. - A time slice SLO, which allows you to define an uptime using a condition over a metric timeseries. The SLI is defined as the proportion of time your system exhibits good behavior. - A monitor-based SLO, which uses one or more monitors in Datadog to calculate its SLI. The SLI is defined as the proportion of time your service exhibits good behavior (as tracked by the underlying monitor(s) being in non-alerting state).
In order to select the SLO type that is best for your specific use case, consider whether you want the SLI calculation to be count-based or time-based. Metric-based SLOs will have a count-based SLI calculation, while time slice and monitor-based SLOs will have time-based SLI calculations. When choosing between a time slice and a monitor-based SLO, consider the following:
Time slice SLOs can measure uptime without an underlying monitor. This means that you only have to create and maintain the SLO itself without worrying about maintaining any underlying monitors.
Some use cases may not be covered by time slice SLOs. In these instances, you can use monitor-based SLOs to measure reliability based on non-metric monitors (such as Synthetics and service checks) or multiple monitors at once.
If you’re looking to track that your payments endpoint is successfully processing requests, you could define a metric-based SLO that uses count-based data (i.e., the number of good events compared to the total number of valid events) for its SLI. One way you can approach this is by dividing the number of HTTP responses with 2xx status codes (which we’ll consider to be the number of good events) by the total number of HTTP responses with 2xx and 5xx status codes (the total number of valid events).
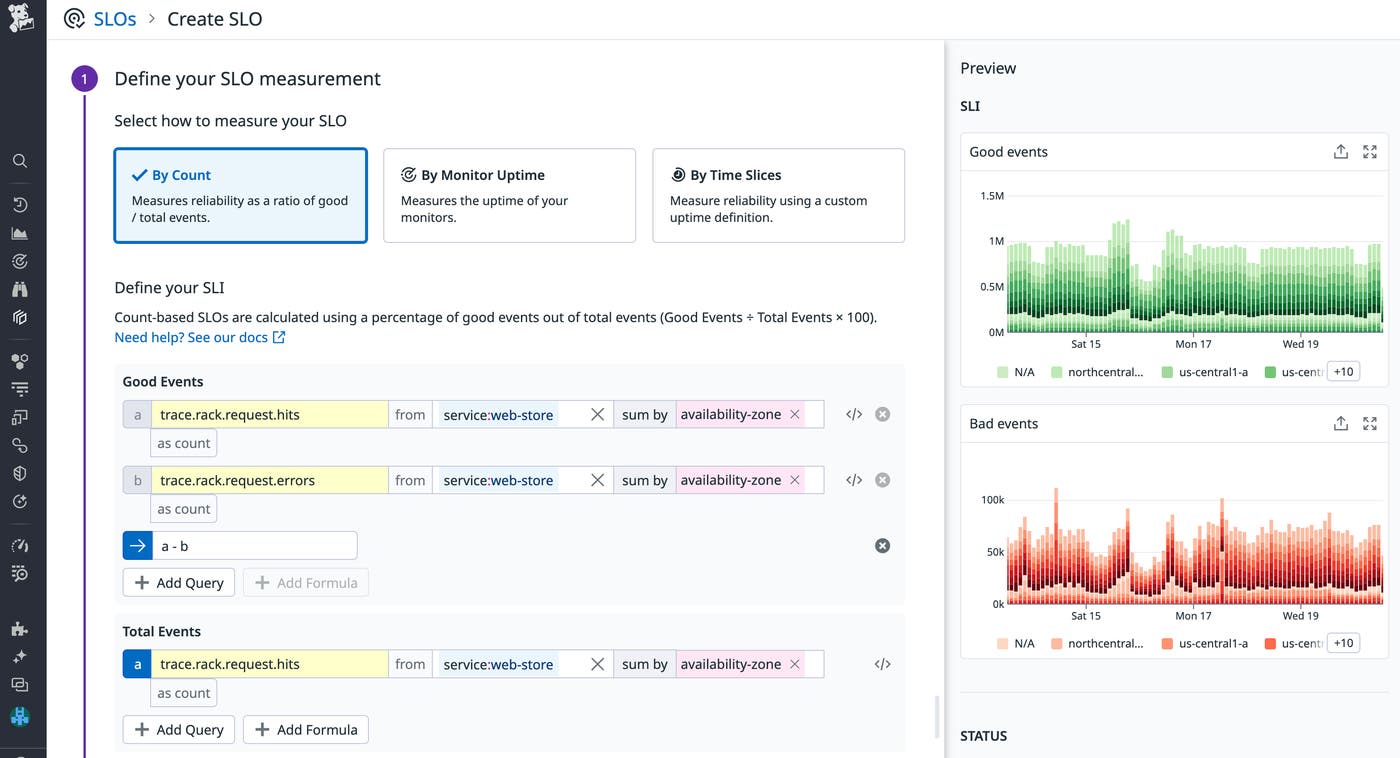
Another way is to use your trace metrics from APM to track how often a request hits the endpoint—and when they’re successful. But say that in this case, we don’t have a metric that directly corresponds to good events. You can use the Advanced option in the metric query editor to build queries based on the metrics you already have. As shown in the example below, if you only have bad events (trace.rack.request.errors) and total events (trace.rack.request.hits), you can define good events as (total events - bad events).

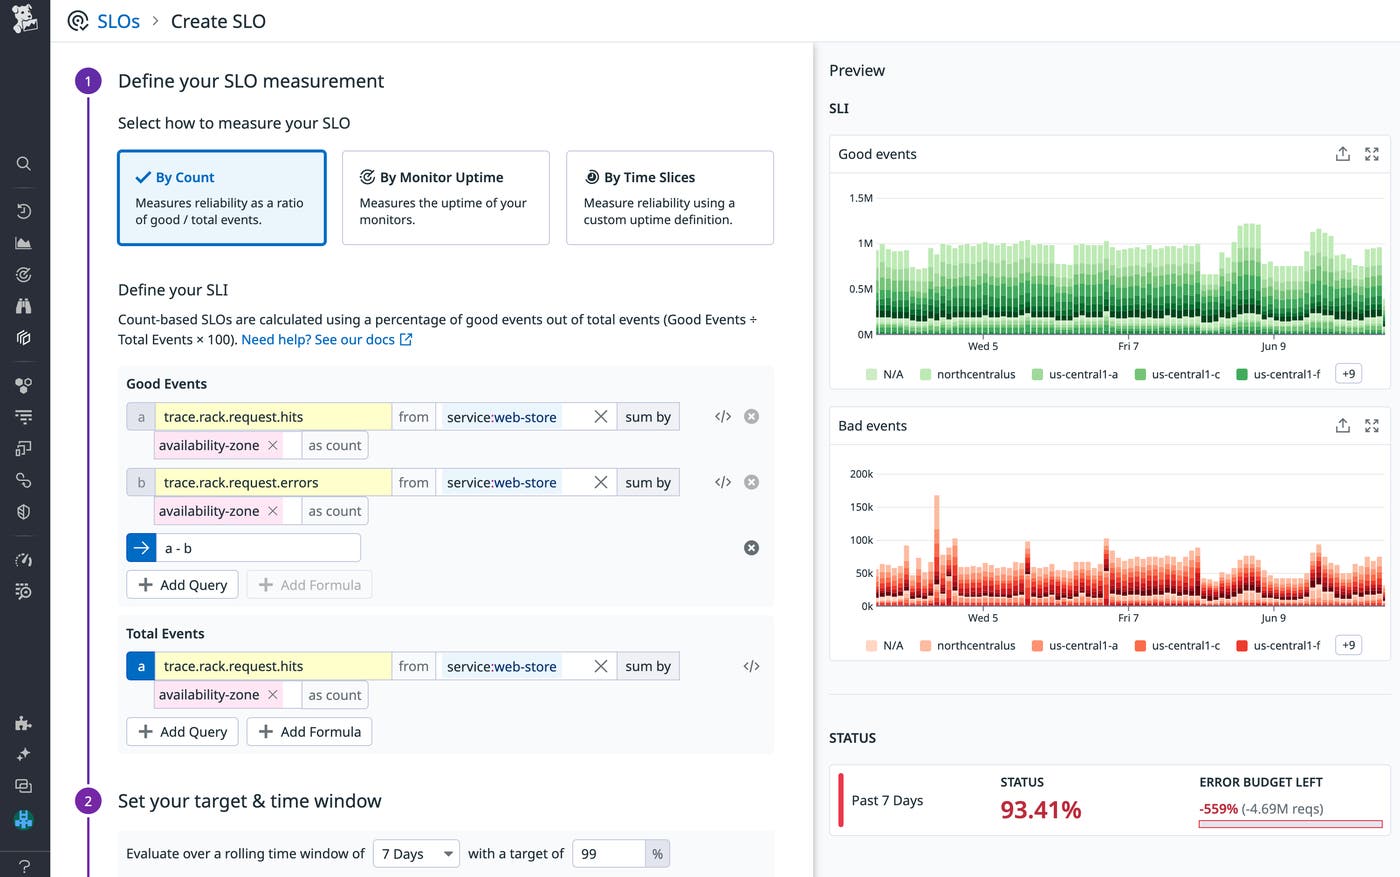
The resulting availability SLO can be written as “99 percent of all requests to the payments endpoint should be processed successfully over a 30-day time window.” In Datadog, you can visualize the status, good request count, and error budget of each metric-based SLO with a bar graph and table.
On the other hand, if you’re looking to track the latency of requests to your payments endpoint, you can create a time slice SLO that uses a time-based SLI calculation (i.e., it calculates the percentage of time the endpoint exhibits good behavior). In the example below, we are using the trace.rack.request.duration metric to define uptime as whenever the p95 latency of requests to our payment endpoint falls under the 5s threshold.

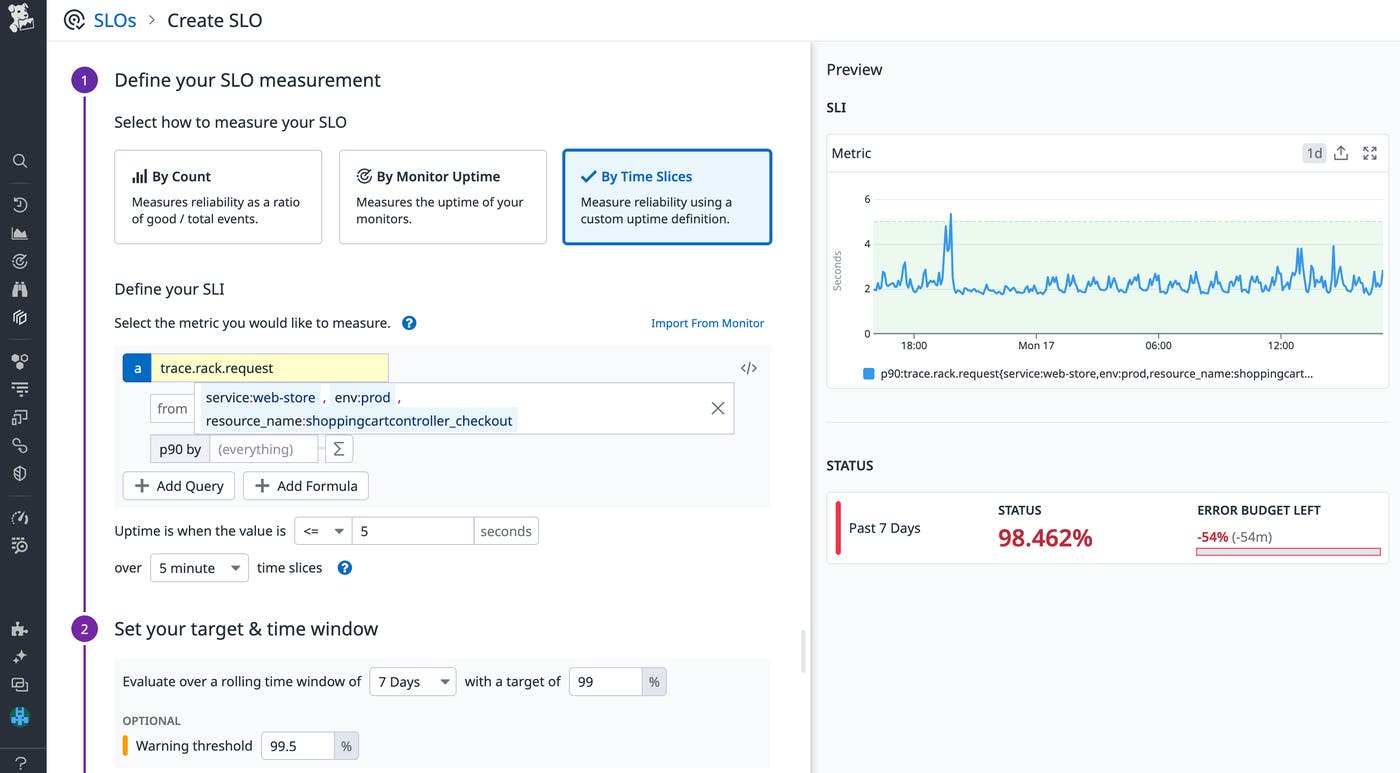
This SLO can be read as the following: For 99 percent of the time, requests should be processed faster than 5 seconds over a 7-day time window. If the performance of your service endpoints change over time, you can easily update your SLO’s uptime definitions to maintain functional reliability targets.
Finally, you might want to create an SLO based on multiple monitors or based on non-metric monitors (such as Synthetics). In such cases, you can use a monitor-based SLO. If you have a Synthetic test to monitor your user checkout flow, you could then create an SLO to track your website’s uptime based on the Synthetic test result.

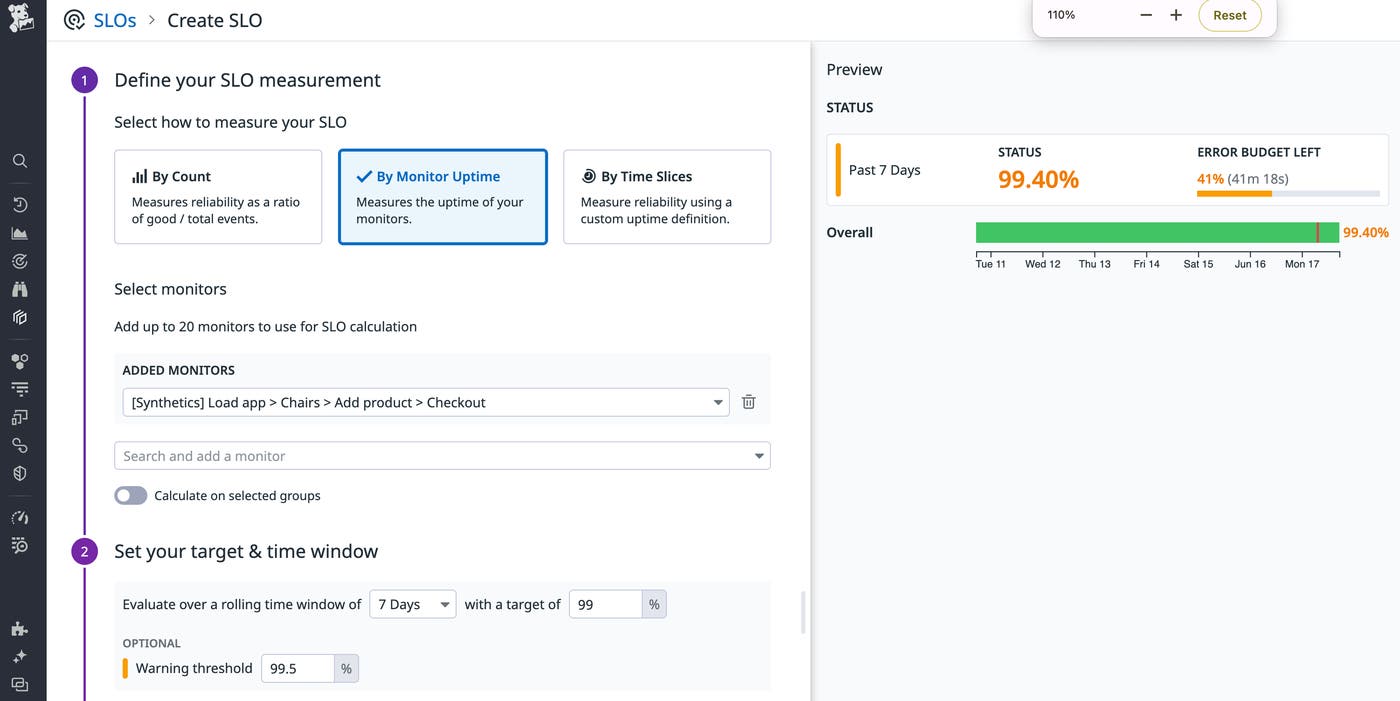
For example, the monitor-based SLO above evaluates a Synthetics monitor that tests a customer’s mobile checkout flow to purchase chairs from a web store. The SLO tracks whether you are meeting a 99 percent uptime target over 7-day time window.
Your SLOs track the performance of your services, and any disruption of a service’s availability or performance can lead to an SLO breach. But you don’t want planned operations, such as deployments and scheduled maintenance windows, to affect your SLO status.
To ensure that your SLO status information is accurate, you can use SLO status corrections to define blocks of time that should not be included in the SLO’s calculation. The screenshot below shows one status correction for a scheduled maintenance and identifies two correction periods outside business hours.

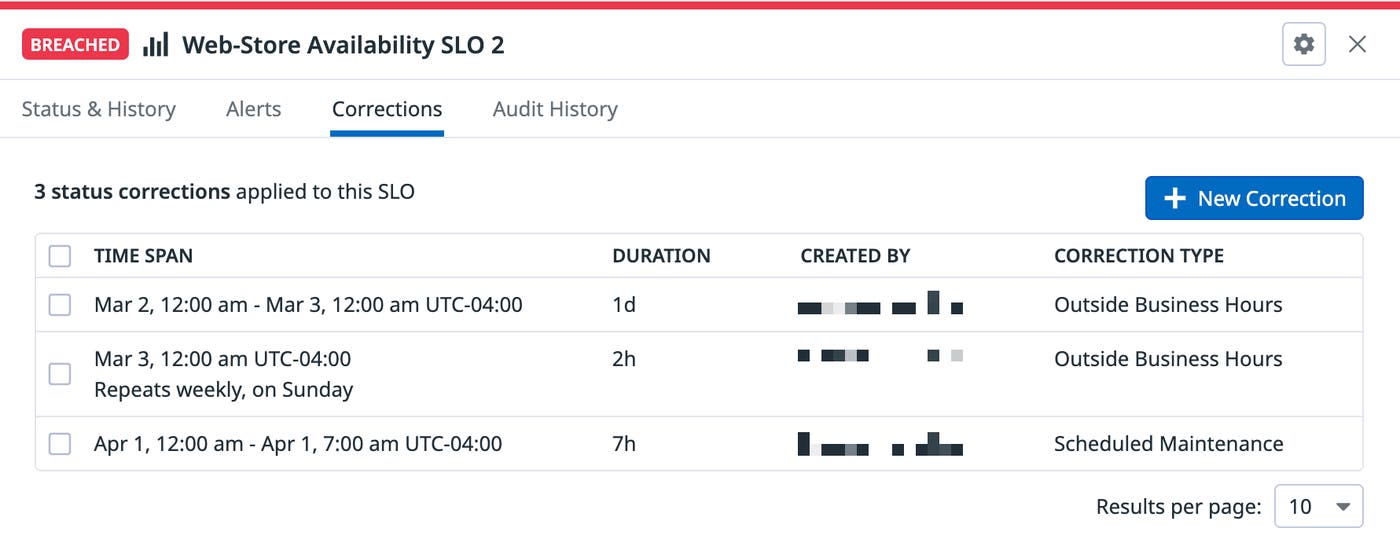
You can use SLO status corrections with all three SLO types. If you create a correction for a Time Slice SLO, the correction window is treated as uptime. For metric-based and monitor-based SLOs, all events that occur during a correction window are excluded from the calculation of the SLO’s status.
SLOs are used by multiple teams across an organization, which means that developing an effective naming and tagging strategy is crucial for streamlining communication and keeping your SLOs organized. First, each SLO should have a short but meaningful name that lets anyone understand what it is measuring at a glance. As you create more SLOs, establishing a clear and consistent naming convention also makes it easier to navigate the SLO list view and pick out relevant SLOs.
In addition, we highly recommend adding a description that explains what the SLO measures, why it’s important, and how it relates to a critical aspect of the end user journey. SLO descriptions in Datadog include support for Markdown, so you can easily link to resources that are relevant to the SLO (e.g., related dashboards, workflow tools, and documentation).

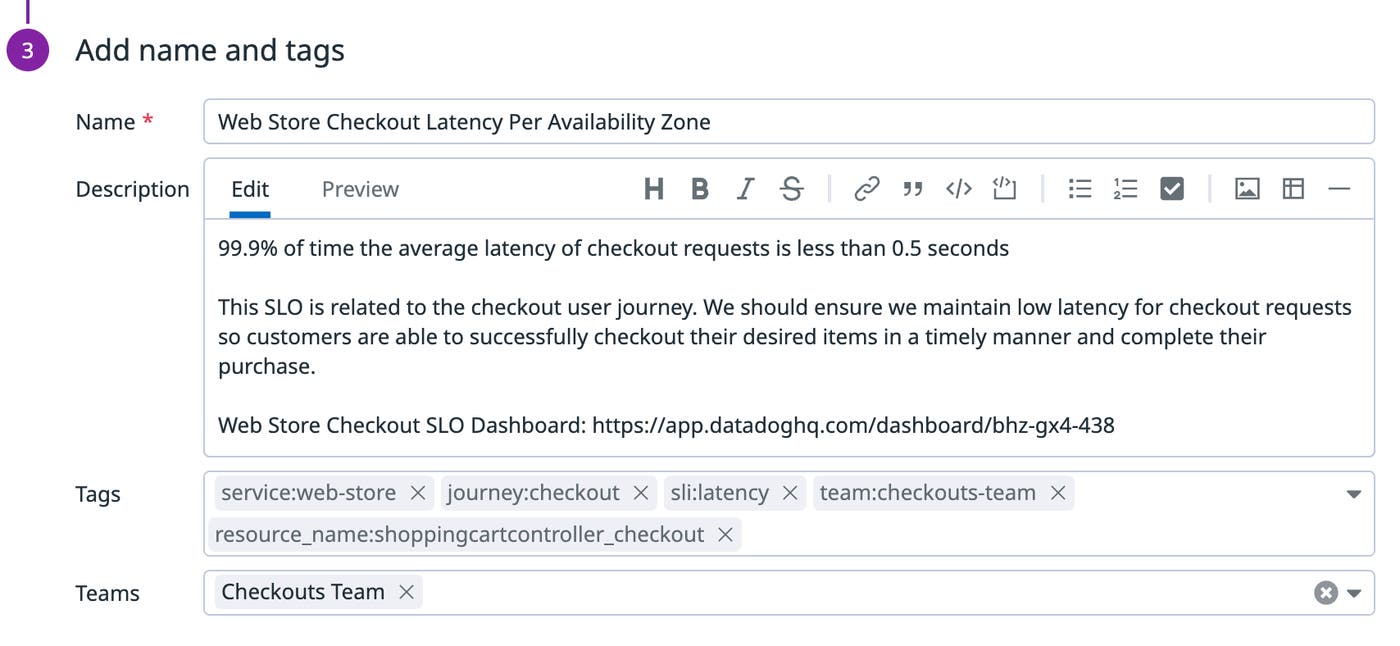
Besides names and descriptions, tags help you effectively organize and manage your SLOs. With tags, you can easily pivot from a breached SLO to the metrics, logs, and traces of the relevant services to investigate the root cause of the issue. At a minimum, we recommend that you tag your SLOs with: - journey:<JOURNEY_NAME> to state the critical user journey that the SLO is related to - team:<TEAM_NAME> to indicate the team responsible for the SLO - service:<SERVICE_NAME>, env:<ENVIRONMENT_NAME>, or any other system-related tags that indicate the system components the SLO is tracking - sli:<SLI_TYPE> to indicate the type of SLI the SLO is based on (e.g., latency, availability)
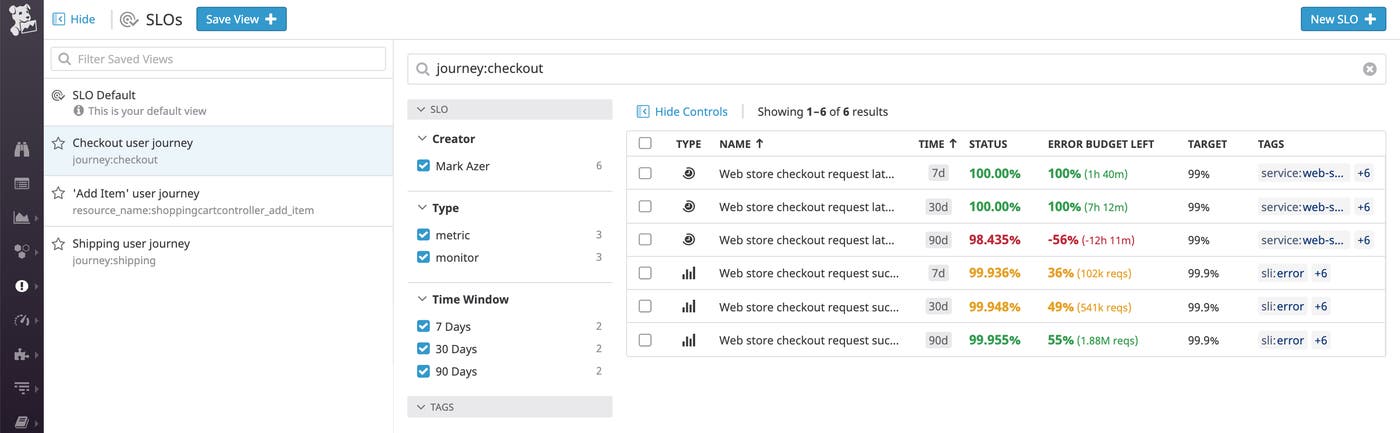
Tagging your SLOs allows you to take advantage of Saved Views, which help you easily find your most frequently used SLOs. Simply use tags to slice and dice your SLOs and save that query as a view that you can access from the sidebar with just a single click. You can also leverage SLO tags to gain a high-level summary view of your SLOs by group.

Grouping your SLOs with tags enables you to track the status of each SLO across individual clusters, availability zones, or data centers in context with the overall status. This lets you quickly zero in on problematic segments of your infrastructure, so you can investigate and resolve the underlying issue before you fall out of compliance with your SLO.
To group your metric-based SLOs or time slice SLOs, simply add one or more tags to the sum by aggregator in the metric query editor.

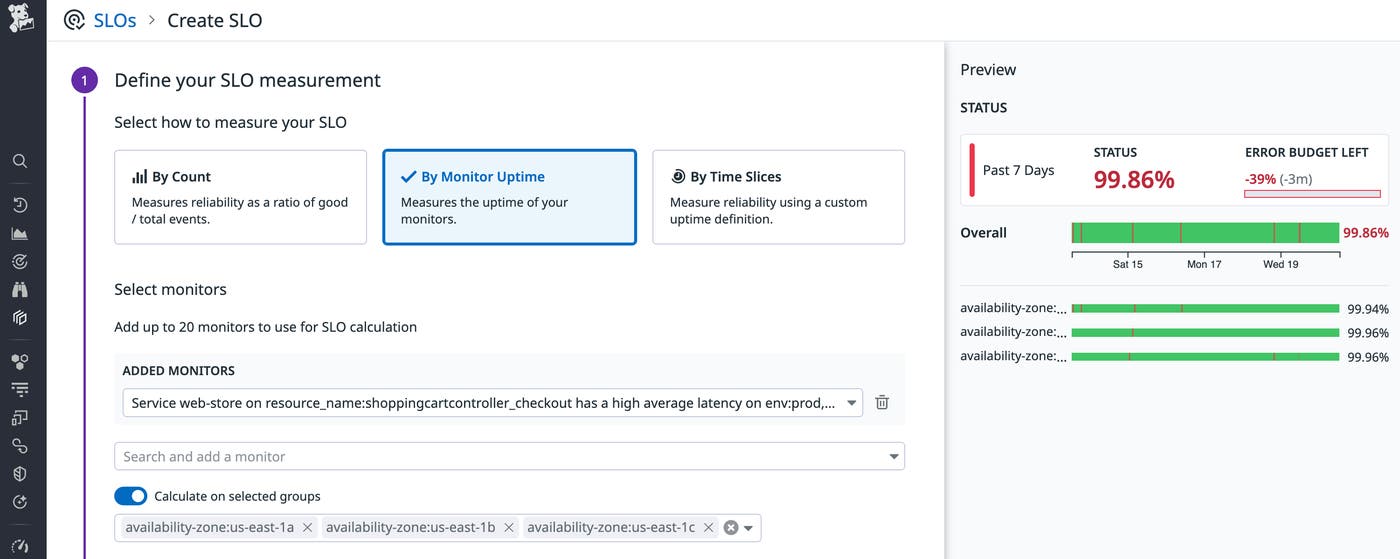
For monitor-based SLOs, you will need to first ensure that the monitor you want to use is grouped by one or more tags. By default, all groups will be included in the SLO status calculation. You can also enable Calculate on selected groups and select up to 20 groups. In the example below, we have broken down the monitor by availability zone, and selected three different groups (e.g., availability-zone:us-east-1a, availability-zone:us-east-1b, availability-zone:us-east-1c) to visualize in the SLO.

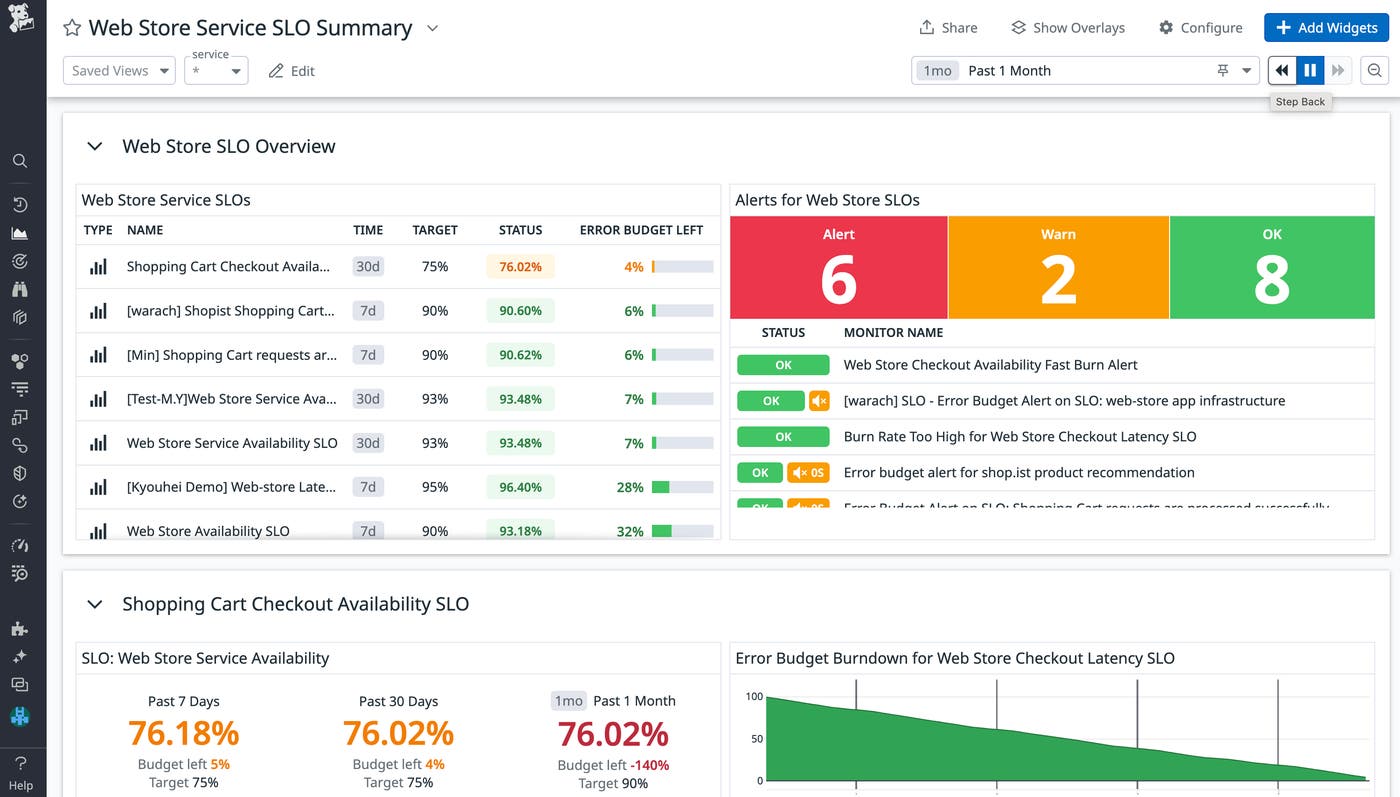
You’re likely already using dashboards to visualize key performance metrics from your infrastructure and applications. You can enhance these dashboards by adding the following widgets and visualizations of your SLOs:
The SLO widget displays details for an individual SLO over multiple time frames, including the SLO status, remaining error budget, and target. The widget can also include information about the underlying groups in your SLO.
The SLO List widget displays the current information for a set of SLOs, including the SLO status, remaining error budget, and target.
The SLO data source gives you access to a variety of measures for your SLOs (such as good and bad events or minutes, burn rate, and remaining error budget) that you can graph in timeseries or query value widgets.

In this post, we’ve looked at some useful tips that will help you get the most value from your service level objectives in Datadog. Together with your infrastructure metrics, distributed traces, logs, synthetic tests, and network data, SLOs help you ensure that you’re delivering the best possible end user experience.
Datadog’s built-in collaboration features make it easy not only to define SLOs, but also to share insights with stakeholders within and outside the organization. And you can proactively monitor the status of your SLOs by creating SLO alerts that automatically notify you if your service’s performance might result in an SLO breach. Check out our documentation to get started with defining and managing your SLOs. If you aren’t yet using Datadog, you can start with a 14-day free trial today.
此内容由惯性聚合(RSS阅读器)自动聚合整理,仅供阅读参考。 原文来自 — 版权归原作者所有。