







Profiling Python extensions has not been a pleasant experience for me, so I made my own package to do the job. Existing alternatives were either hard to use, forcing you to recompile with custom flags like gprofile or desperately slow like valgrind/callgrind. The package I'll talk about is called YEP and is designed to be:
- Unobtrusive: no recompiling, no custom linking. Just lauch & profile.
- Fast: waiting sucks.
- Easy to use.
Basic usage
YEP is distributed as a python module and can be downloaded from the pypi. After installation, it is executed by giving the -m yep flags to the interpreter. Without any arguments, it will just print a help message:
$ python -m yep Usage: python -m yep [options] scriptfile [arg] ... ...
Say you want to profile a script called my_script.py, then the way to quickly get a profiler report is to execute:
$ python -m yep -v my_script.py
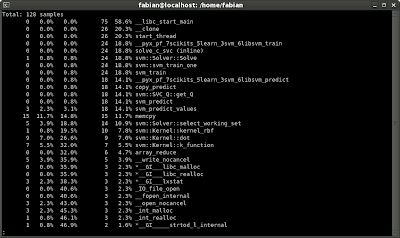
For example, running YEP on this example that makes use of libsvm, a C++ library for Support Vector Machines, outputs
 |
| From Screenshots |
The last column prints the name of the functions, so just looking at those that start with svm:: gives you an overview of how our libsvm is spending its time.
Other usages
Calling YEP without the -v will create a my_script.py.prof file that can be analyzed with pprof (google-pprof on some systems). pprof has a huge range of options, letting you to filter on some funtions, output to ghostview or print a line-by-line profiling, to mention a few. For example, you can generate a call graph with the command: [cc] $ pprof --gv /usr/bin/python my_script.py.prof [/cc]
More control
If you would like to manually start/stop the profiler rather than profile the whole script, you can use the functions yep.start() and yep.stop() inside a python script. This will write the profile to a given filename, so make sure the directory is writable: [cc lang="python"] import yep yep.start('out.prof') # will create an out.prof file # do something ... yep.stop() [/cc]
Future work
The -v option showed at the beginning is just a dirty hack that launches pprof and pipes the output into less. A more robust approach would be to read the resulting profile from python and manipulate it from there, either to std or to pstats format. This shouldn't be too difficult as the pprof format is described here
Acknowledgment
The original idea to use google-perftools to profile Python extensions was given on this Stack overflow question