





Afternoon all,
Hopefully the presence of this email in your inbox on a Thursday renders it an honorary Friday, to help you ring in the long weekend.
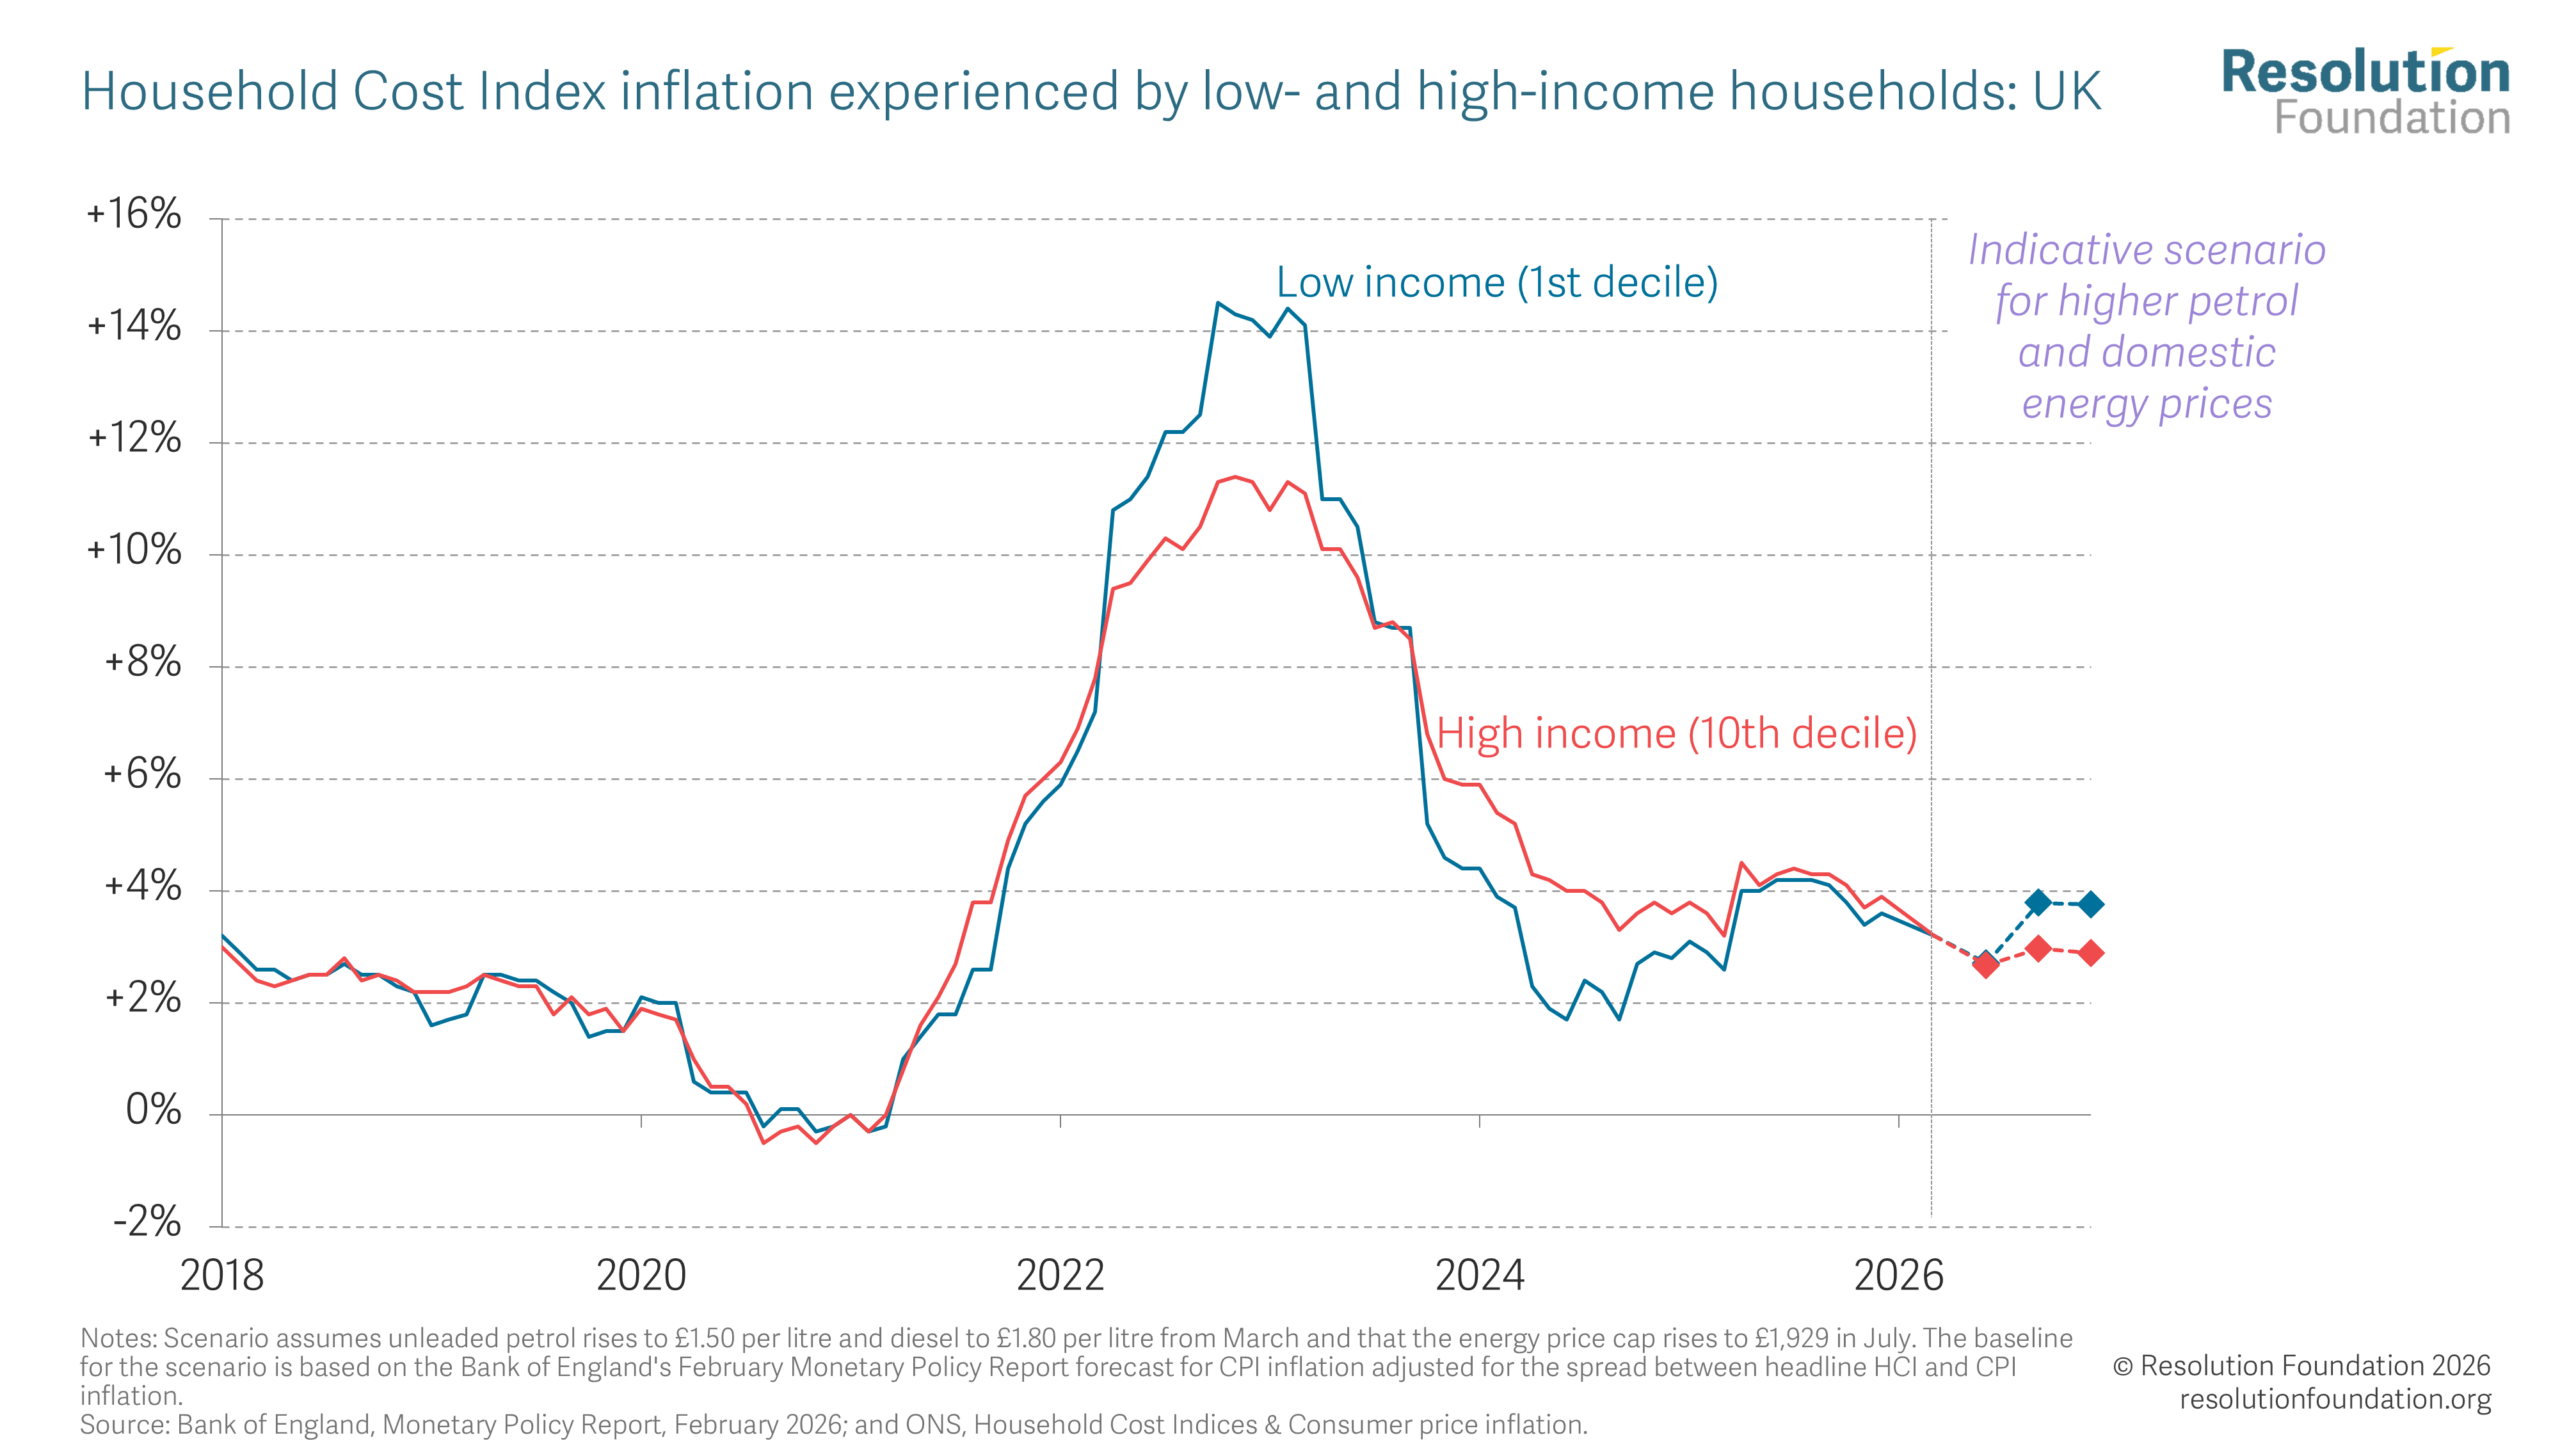
Energy bills are still in the news, and this week’s Chart of the week shows exactly who will pay the steepest price when the next shock hits. Spoiler: it’s not the people who can most afford it. Happily, the Chancellor has signalled that she plans to target support where it’s needed.
We’ve also got the lowdown on what the new tax year brings with it from Monday, plus we’re considering whether firms can foresee inflation, exploring the ancient roots of NIMBYism, and trying to get kids to vote.
Have a great Easter break – we’ll be back in a fortnight.
Ruth
Chief Executive
Resolution Foundation
Anchors aweigh. How good are firms at reading the inflation tea leaves? A Bank of England survey finds that businesses can gauge today’s inflation, but can’t really predict where it’s heading. The average error for current CPI tracking is only 0.31 percentage points, but one-year-ahead forecasts are much shakier, missing by 1.55 points. Bigger and more productive businesses tend to be better plugged into macro signals and consequently more on the money. Worryingly for our benevolent interest rate overlords, the link between short- and long-run expectations has recently strengthened, meaning that firms’ beliefs are more responsive to current inflation than before. And no surprise: firms that expect higher inflation plan bigger price rises. Economists worry about whether inflation expectations are anchored. As the MPC judge whether a short-term price shock will feed through to persistent inflation, it’s a pretty bad time to conclude the anchor is lighter than it used to be.
Greensleevesbelt. Apparently, NIMBYism is a storied British tradition. Jonn Elledge’s blog post finds a proto-green belt in Elizabeth I’s land use policy from the 1580s. She banned construction within three miles of the City or Westminster, creating an exclusion over most of Zones One and Two in modern London: no Soho, no Bloomsbury, no Brixton. The motivations are murky: plague prevention, aesthetic conservation, or moral panic about a city that had tripled in size in living memory. Whatever the reason, it didn’t work. Ambitious provincials kept beelining for the capital (plus ça change) and the Crown cheerfully sold exemptions from its own rules. More housing development, more workers in cities, and more tax revenue for the state – a rare win-win-win policy reform. Perhaps something for our current rulers to consider…
Meh-jority rule. With Parliament about to enfranchise a million 16-17-year-olds, three academics ask the obvious follow up question: will they actually vote? Youth turnout in 2024 fell 17 percentage points from its 2017 peak among 18-24-year-olds. Parties were campaigning on immigration and fiscal competence while younger voters cared about housing, mental health, Gaza and climate change. The collapse was sharpest along wealth lines: turnout among social grade C2DE youth fell off a cliff compared to ABC1, widening an already troubling participation gap. Reversing this trend, the authors argue, requires two things parties have historically been bad at: a genuine policy offer built around young people’s priorities, and a communication style that doesn’t make young people cringe. Has anyone tried a weekly newsletter yet?
Rational numbers. Just in time for Easter – this analysis exploits the natural experiment of the end of rationing in Britain to see how childhood food environment can affect obesity. After over a decade of restriction, the sugar floodgates were finally opened in September 1953, and the authors compare 47,000 UK Biobank participants born before and after the deluge of sweet treats. Early rationing reduced obesity rates by 30 per cent overall, but the gains were almost entirely concentrated among the genetically susceptible, leaving those with low genetic risk largely unaffected. RF does not endorse ‘Blitz Spirit’ as a dieting strategy, but the clever folks over at Nesta have been doing some modelling what an unhealthy food tax might look like. No ration books required.
Something for the weekend | New year new you
This week we saw Minimum Wage and Council Tax rises, and on Monday we’ll get another host of changes rolling in with the new year tax year. Here’s what you need to know:
Energy bills – and where they’re likely to go – has been the biggest story in town this week. Understandable: we all have to pay them, everyone is reeling from the last war-induced shock, and there is simply no way to know yet exactly how steep this one will be. But we can be certain of one thing – it will hit the poorest hardest. The second income decile spends 11 per cent of its budget on energy bills, compared to just 6 per cent for those in the ninth. For Chart of the week, we’ve modelled what that looks like in terms of inflation rates across the income distribution. Under the latest Cornwall Insight forecasts for energy bill rises of £288 a year in July, and assuming those persist, the gap could reach 0.9 percentage points by Q4 2026, with the poorest decile facing inflation of 3.8 per cent against 2.9 per cent for the richest. But this is likely an underestimate, leaving out knock-on effects on food and other goods. The Bank of England forecasts 3.5 per cent by Q3 2026; the OECD puts it at 4 per cent for the year. Buckle up.
此内容由惯性聚合(RSS阅读器)自动聚合整理,仅供阅读参考。 原文来自 — 版权归原作者所有。