






Your engineering team is working on new ways to apply AI for the good of the company and your customers. New use cases means new projects and more engineers interacting with the Pinecone vector database. As the team lead, you want to enable your team to continue innovating on new use cases without breaking the bank.
With new usage dashboards, you can now easily view usage and spend for your entire team — all without leaving the console. Knowledge is power, and the usage dashboard gives you the power to:
Access to these dashboards is currently limited to Organization Admins, who can view total usage and average daily usage across all projects within an Organization.
Navigate to “Usage” within the “Organization” tab. From there, you can view total cost and usage over different time periods, and filter by pod type or project.
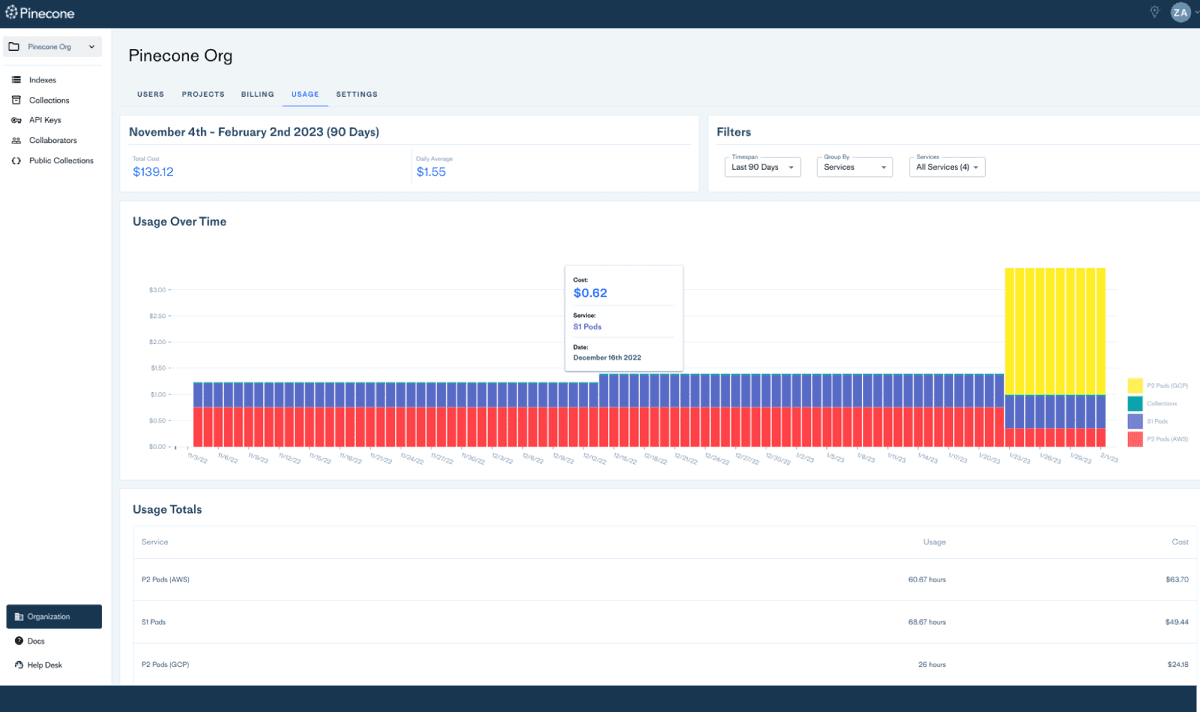
Usage dashboards are now available for Standard, Enterprise, and Enterprise Dedicated accounts. Check out our documentation to learn more.
此内容由惯性聚合(RSS阅读器)自动聚合整理,仅供阅读参考。 原文来自 — 版权归原作者所有。