








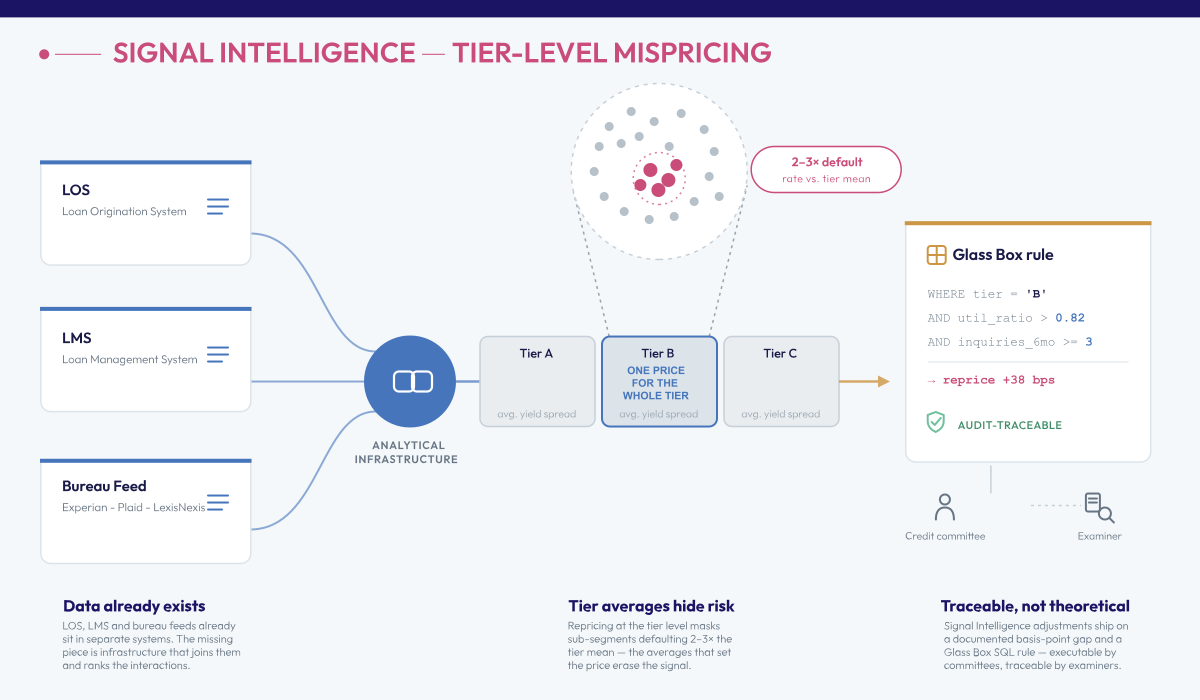
The yield spread on car and auto loans has become the most actively managed variable in today’s auto finance market. The Dealertrack Credit Availability Index reported an 18-basis-point compression in the yield spread in December 2025 alone, with yield-spread adjustments accounting for 18% of the annual improvement in credit availability. This is not the result of passive market fluctuations; lenders and other financial institutions are deliberately manipulating prices to remain competitive. The issue is that most lenders are making these adjustments at the tier level, based on averages and loss assumptions that reflect the previous cycle. Within each credit tier, there are distinct sub-segments in which the actual default probability is two to three times the tier mean — accounts that are systematically underpriced at any rate the broader tier can support.
The five steps below are not a theoretical framework. Each produces a specific output — a documented basis-point gap, a stacked segment profile, a Glass Box SQL rule — that the credit committee can act on and the examiner can trace. For a broader view of how auto loan pricing optimization within credit decisioning software fits into the full risk architecture, the hub piece covers the landscape in which these steps operate.
The data the process needs is already in your LOS, LMS, and bureau feeds. What has been missing is an analysis infrastructure capable of joining those tables, ranking the interactions, and expressing the output as a rule, which is precisely what each step below is designed to do.
The baseline step is to match current rate-tier assignments against realized loss rates — not modeled loss rates — by segment over the past four to six quarters. Where realized 90 DPD and net charge-off rates for a specific tier, vehicle type, or origination channel consistently exceed the loss assumption baked into the rate, that gap in basis points is the pricing misalignment the optimization process must correct. It is the starting inventory for every step that follows.
While most lenders know the Net Charge-Off (NCO) rate at the portfolio level, it’s not nearly as straightforward to determine whether pricing tiers reflect actual realized losses by sub-segment over a specific period, such as 12 months. The reason for the complexity is that a sub-segment analysis requires using LOS origination data, Loan Management System performance data, and bureau tradeline history in a way that analytics teams simply cannot accomplish. Given the organization’s other reporting needs, the process is simply too time-consuming. Rate tiers are calibrated based on historical averages that predate the deterioration in recent years across the 2022 to 2025 vintage.
Recent data from the New York Fed show that the borrower’s credit tier and ability to repay heavily influence auto loan performance, loan vintage, and vehicle type. In Q1 2026, the 90+ DPD rate reached 5.6%, well above the long-term average of 3.59%. Used-vehicle loans tend to be a heavier burden on borrowers than new-vehicle loans, and originations in 2024 and 2025 show early delinquency rates above pre-pandemic averages. If pricing models do not account for loss performance based on these variables, you are likely to miss important signals needed for accurate pricing.
Through automation, dotData’s Signal Intelligence platform automatically finds the necessary baseline by joining LOS, LMS, bureau, and third-party data without manual pre-flattening. With the data sources ingested, dotData computes realized loss rates by specific segment combinations that matter. The output is a ranked list of Driver Signals that indicate which combinations of account levels are underpriced relative to actual performance, expressed in basis points of excess loss above the rate-based assumption, directly impacting the true cost of risk.
Pull actual 90 DPD and NCO rates for the past six quarters, segmented by FICO tier, vehicle type, origination channel, and loan term. Intersections where realized losses exceed the rate tier’s assumption by more than 50 basis points are mispriced segments. With that list, move to step 2.

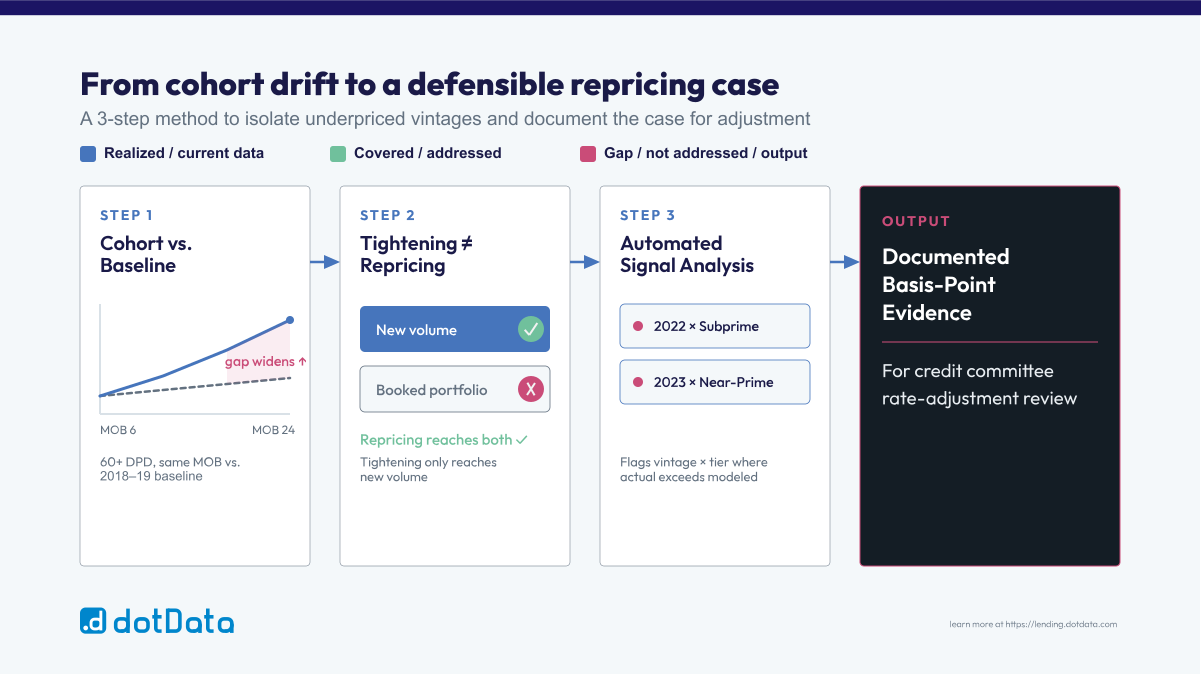
Vintage divergence analysis evaluates the delinquency trends of each origination cohort in comparison to pre-pandemic baseline cohorts at the same months-on-book. If a cohort from 2022 or 2023 exhibits 60+ DPD rates significantly exceeding those of the 2018–2019 baseline at the same seasoning point, it indicates that the risk associated with that vintage was not accurately priced at the time of origination. This repricing gap continues to widen with each passing quarter that the misalignment remains.
A change in approval rates does not necessarily mean pricing strategies should be changed. As reported by Dealertrack, the subprime auto loan sector experienced a 230-basis-point year-over-year increase until subprime lenders began pulling back to limit exposure, resulting in a 20-basis-point month-over-month decline in subprime share in December 2025. That type of targeted tightening shows a reaction across the entire credit framework. When a lender tightens approval standards without analyzing pricing for the accounts it approves, it only solves part of the problem: it reduces adverse selection at the margin while continuing to allow systematic underpricing among approved accounts.
dotData’s Signal Intelligence platform isolates vintage divergence automatically across the full origination history — computing months-on-book delinquency curves by cohort quarter and flagging the specific vintage-and-tier combinations where actual performance has diverged most from the rate-embedded loss assumption. The output is the input the credit committee needs to defend a tier adjustment: a documented divergence in basis points between modeled and realized loss, expressed by cohort, not a judgment call.
Create a vintage cohort delinquency curve for the years 2021, 2022, 2023, and 2024, organized by credit tier. Chart the 60+ DPD rate for each cohort at the 6-, 12-, 18-, and 24-month points, relative to the 2019 baseline. A cohort that runs over 75 basis points higher than the 2019 equivalent at the same months-on-book has been systematically underpriced. This differential is the minimum repricing gap that Step 5 must close.
Standard tier analysis segments by FICO band, income, DTI, or LTV — variables that the origination system already carries. The mispriced sub-segments that produce the largest basis-point gap between embedded and realized loss live in the interactions between those variables and multi-table behavioral data. These underlying risk trends can vary significantly across borrower profiles; how a specific tradeline composition combines with a payment method flag in the LMS and a vehicle type to produce a default rate two to three times above the tier average, while appearing within tolerance in any single-variable view.
Credit unions face this problem at a structural level right now. Credit union vehicle loans fell $6.5 billion, or 1.3%, in Q2 2025 to $483.5 billion, per NCUA data — a volume contraction that removes the growth lever entirely. At the same time, credit union NIM recovered to 3.39% of average assets in 2025, up 27 basis points from 2024, driven by higher loan pricing. Sustaining that NIM recovery and overall institutional profitability requires pricing the specific sub-segments that carry above-average risk at rates that reflect actual default probabilities — not broad-tier averages calibrated to a borrower pool that no longer matches the current portfolio composition.
dotData’s Signal Intelligence platform runs this discovery programmatically — evaluating millions of cross-table relational combinations from the LOS, LMS, and bureau data simultaneously to surface the Driver Signals that identify which account-level combinations are producing above-tier default rates. The output is not a credit box recommendation. It is a ranked list of specific conditions that indicate where pricing is misaligned with risk, expressed as population-match volume, directional lift above baseline, and the basis-point gap between the current rate and the risk-adjusted rate.
Identify the top 10 Driver Signals, ranked by excess default rate above the tier baseline, from the Signal Discovery run. For each, calculate the basis-point premium the current rate sheet would need to add to make that sub-segment risk-neutral — the difference between the embedded loss assumption and the realized loss rate the discovery run identified. That premium list is the input to Step 4.

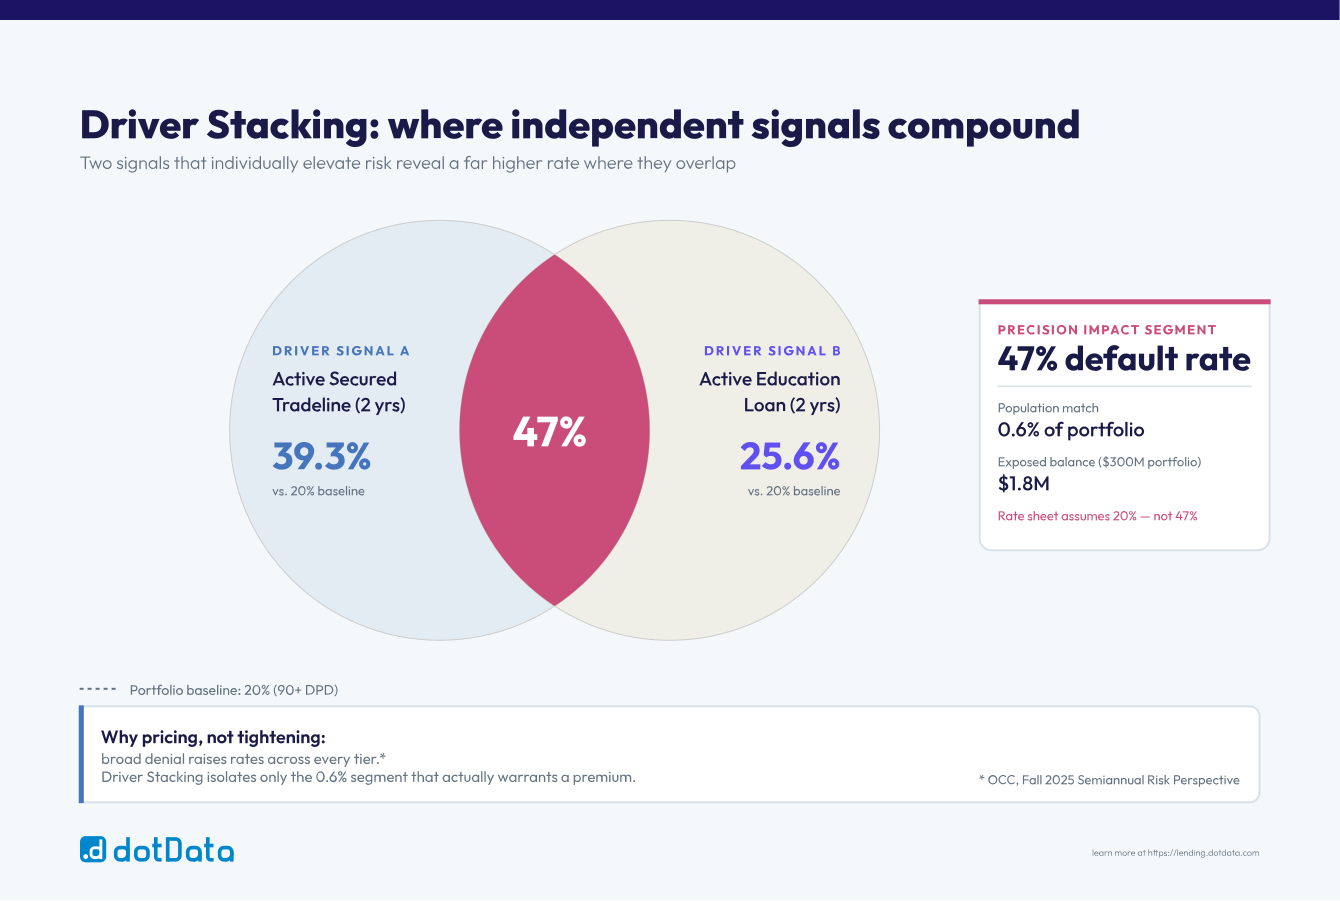
“Driver Stacking” combines multiple Driver Signals — each of which independently elevates the default probability above baseline — to identify the specific account combinations in which compounding interactions produce default rates far above what any single signal predicts. The compounded rate, expressed against population match volume, becomes the Precision Impact Segment: the specific borrower profile for which a basis-point pricing premium is both justified and documentable to a credit committee, a board, or an examiner conducting an ECOA fair lending review.
In response to macroeconomic uncertainty, adopting tighter underwriting standards is a different strategy from adjusting targeted pricing — and it is often the wrong one. According to the OCC’s Fall 2025 Semiannual Risk Perspective, lenders that reported stricter underwriting standards cited a more uncertain economic outlook as the main factor. Economic uncertainty is a judgment made at the portfolio level; it raises denial rates across all tiers without clarifying which sub-segments warrant a rate premium — rather than a denial — as the appropriate and fair response. The credit committee must utilize Driver Stacking calculations to accurately differentiate this, rather than applying a blunt policy approach.
dotData Signal Intelligence makes the compounding interaction explicit and quantifiable. For example, a Driver Signal identifying accounts with an active secured credit card in tradelines within the past two years elevates 90 DPD risk from a 20% portfolio baseline to 39.3%. A second Driver Signal — an active education loan in the same two-year window — independently raises it to 25.6%. Stack the two signals, and the resulting Precision Impact Segment might represent only 0.6% of portfolio volume but might have a 47% default rate, a nearly 30 percentage point surge above average. On a $300 million indirect used-vehicle portfolio, that 0.6% segment represents $1.8 million in outstanding balance, with the current rate sheet embedding a 20% loss assumption against an actual 47% default trajectory.
Stack the top three Driver Signals from Step 3 in the dotData. For the resulting Precision Impact Segment, document four items: population-match volume as a percentage of the total portfolio, the compounded default rate vs. the tier baseline, the basis-point premium required to make the segment risk-neutral, and a plain-language description of the borrower profile. That four-item summary is the credit committee presentation — and the examiner’s audit trail if the pricing adjustment is challenged under ECOA.
Here is where most pricing recalibration efforts stall: the perceived complexity of moving a discovered insight into an operational rate decision without a core system project. The barrier is a function of output format, not technical difficulty. Precision Impact Segments deploy as post-model adjustments — clean SQL rules that specify the exact account-level conditions under which a basis-point pricing premium applies. The rule drops into the existing LOS policy framework—no IT project required.
Community banks with assets under $1 billion realized a higher net interest margin in the first half of 2025, specifically because of higher loan pricing relative to prior years — per the OCC’s Fall 2025 Semiannual Risk Perspective — not because they rebuilt their origination infrastructure. The mechanism was a policy adjustment. The credit committee approved a premium; the LOS applied it; the examiner traced the logic. The same deployment path as a Signal Intelligence discovery, except that the premium was derived from documented multi-table signal discovery rather than a judgment-based rate adjustment that cannot be independently validated.
The Automated Pipeline Engine in dotData Signal Intelligence automatically generates production-ready SQL and tracks every preprocessing and signal selection decision, ensuring the output is auditable end-to-end. For the VP of Lending operating inside dotData, that SQL becomes a rate-tier modifier in the existing PMA workflow — no data science intermediary between discovery and deployment, no LOS rebuild, no waiting for the next model recalibration cycle. The Glass Box output means the ECOA adverse action rationale is built into the rule at generation, not constructed after the fact when a reviewer asks for it.
For each Precision Impact Segment identified in Step 4, generate the PMA rule, assign it to the appropriate rate-tier modifier in the existing LOS policy table, and set a 90-day performance review trigger — tracking whether the repriced segment’s actual 30+ DPD rate moves in the direction the signal discovery predicted. That feedback loop keeps the pricing model calibrated to current portfolio conditions rather than compounding on stale historical assumptions quarter after quarter.
Risk-based pricing assigns interest rates to auto loan applications based on the estimated default probability and loss severity of specific borrower profiles — not a flat rate for all borrowers in a broad credit tier. Lenders set rate tiers based on FICO bands, DTI thresholds, and LTV ratios, then apply post-model adjustments to account for sub-segment risk concentrations that the scorecard does not capture. The optimization problem is whether the rate tier’s embedded loss assumption matches the segment’s actual realized loss rate over the loan’s full term.
The most dependable method involves comparing actual loss rates — specifically, the 90 DPD and NCO rates by origination cohort — with the loss assumption included in the current rate tier. If realized losses consistently exceed the embedded assumption by more than 50 basis points, it indicates that the segment is underpriced. Multi-table signal discovery helps pinpoint the exact borrower-profile combinations responsible for this excess, enabling precise rate adjustments rather than a sweeping tier tightening, which could negatively impact look-to-book ratios for accounts that do not need it.
Adverse selection occurs when pricing tiers attract disproportionately high concentrations of the riskiest borrowers within a credit band — because the rate is insufficiently differentiated between lower-risk and higher-risk profiles inside the same credit score bucket. Dealers and borrowers look for the lowest available rate, and lenders that price uniformly within a tier will book the highest-risk accounts in a tier at the rate designed for the average performer. The correction is to price by sub-segment rather than a tier-wide increase that reduces volume without targeting the specific profiles driving the increased losses.
Reprice specific Precision Impact Segments identified through multi-table signal discovery — not entire credit tiers. A sub-segment with a 50% default rate at 0.443% of portfolio volume requires a targeted basis-point premium, not a policy change affecting the entire near-prime population. That surgical approach protects origination volume and look-to-book ratios while correcting the mispricing that creates P&L exposure and drains bottom-line profit — and the Glass Box SQL rule output ensures the adjustment is defensible under ECOA and traceable to examiners without supplementary documentation.
Yield spread compression occurs when the difference between the average Tuo loan contract rate and the benchmark rate narrows. Auto lenders reducing rates to boost loan volumes, or increases in benchmark rates that are not matched by contract rates, can both cause yield spread compression. According to the Dealertrack Credit Availability Index, the yield spread shrank by 18 basis points in December of 2025 alone, diminishing the margin available to lenders to offset credit losses and making more precise subsegment-based pricing more advantageous.
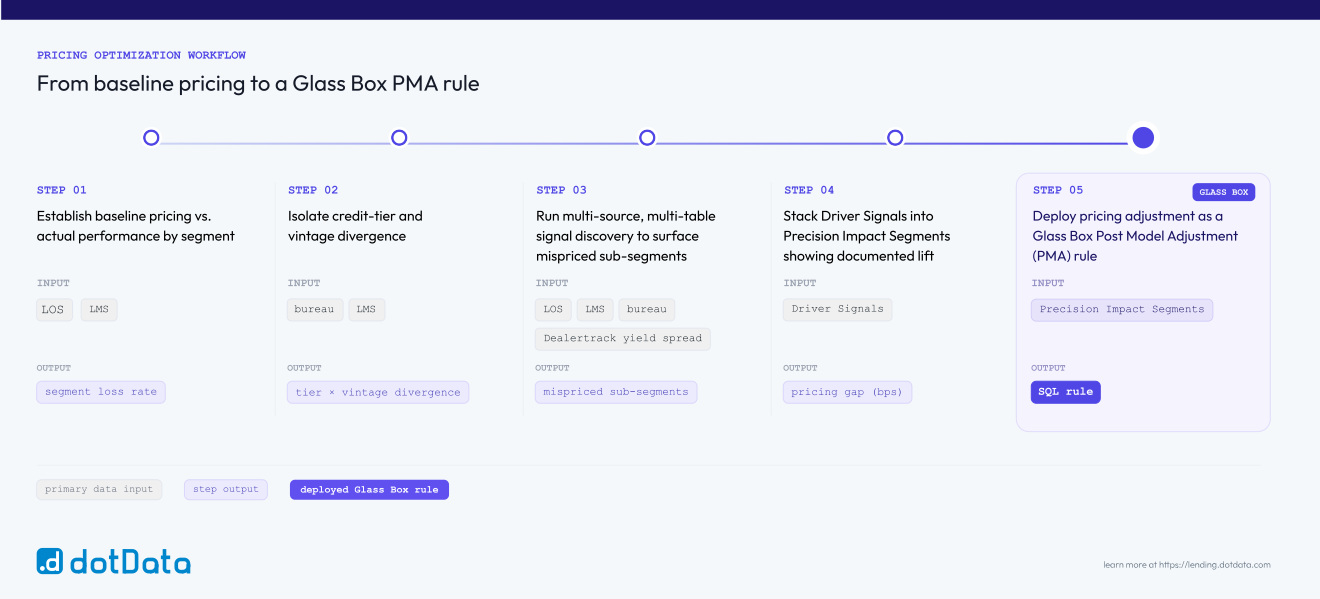
Lenders can take five essential steps to adjust their pricing tiers: First, assess baseline pricing relative to actual losses across segments. Next, pinpoint any discrepancies between vintage and tier. Engage in multi-table and multi-source signal discovery to reveal less-obvious mispriced sub-segments, merge Drivers into Precision Impact Segments that show verified enhancements, and finally execute pricing changes as explicit post-model modifications within the LOS. Lenders usually evaluate several options to execute these changes, weighing the deployment cost against immediate financial benefits.
The most significant pricing signals are derived from multi-table temporal interactions: how the composition of tradelines (specific account types active in the past two years), LMS payment methods, and velocity patterns during the first six months on the books interact to yield default rates that surpass the tier baseline, along with vehicle collateral characteristics such as negative equity. Neither a FICO score nor an LTV ratio can capture these interactions on its own. dotData Signal Intelligence automatically analyzes millions of these combinations, ranking them by the excess default rate above the baseline and presenting the premium needed to achieve risk neutrality for each segment in a manner that the credit committee can act on directly.
The five-step framework does not require new data sources. The LOS, LMS, and bureau feeds that your team already maintains provide the signal across a wide range of variables. What it requires is an analysis infrastructure capable of joining those tables, ranking the interactions, and expressing the output as a Glass Box SQL rule that the credit committee can defend and the examiner can trace.
When analyzing a complex buying environment, standard risk assessment tools fall short if they fail to account for individual customer behavior. dotData Signal Intelligence provides that infrastructure without displacing the risk team’s judgment or rebuilding the core stack. The pricing adjustment stays with the people who own it. The discovery compresses from quarters to hours.
此内容由惯性聚合(RSS阅读器)自动聚合整理,仅供阅读参考。 原文来自 — 版权归原作者所有。