





By Sven Mayer and Guo Freeman, TPCs, & GCs.
In this blog post, we provide insights into the poster track outcomes at CHI 2026. As a reminder, the Poster track provides the CHI community with an opportunity to present new and exciting contributions that showcase innovative technologies, extend prior research conversations, detail short self-contained studies, case studies, or provide provocations for new work and ideas to emerge. We describe: how many posters were submitted to CHI 2026 and how many were accepted, how many were submitted and accepted based on authors’ affiliations, the poster track program committee, and the poster track authors.
What’s important to note here is CHI 2026 didn’t have the standard posters track from previous years. Several other conventional “tracks” (alt.chi, case studies, etc.) were merged under posters as the track relates to its presentation format, not the content. In fact, we added many more content sub-types including open-source contributions, prototypes, and more. Of course the standard ‘late breaking work/short study’ is still in this track too. This was one of many changes to CHI2026, so it’s important to look back and see how the change affected what was submitted and what got accepted.
Of the initial 2068 completed submissions to the CHI’26 poster track, 792 were accepted. The overall acceptance rate for the Poster track was 38.2% of completed submissions. Figure 1 shows the overall outcome of the poster track and distribution of review scores.
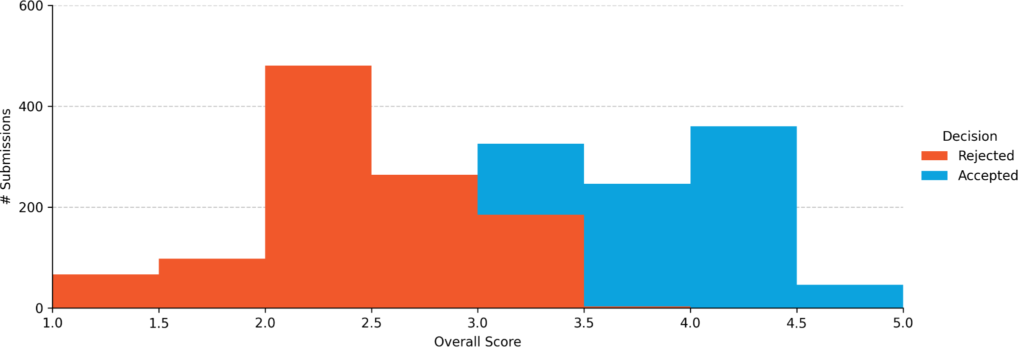
Figure 1: Poster track overall outcome and distribution of review scores.

Figure 2: Normalized number of submitted posters per affiliation country. The difference between the submitted (Figure 2) and the accepted (Figure 3) is visualized in Figure 4.
Then, we provide a comprehensive understanding of the submitting posters worldwide based on the authors’ affiliations. For this, we analyze 2056 valid submitted posters (excluding withdrawn posters) and examine the number of unique authors. This year, 6438 unique authors submitted to the CHI 2026 poster track. The vast majority of authors stated that they had affiliations in only one country (6331 authors). Only 106 have affiliations in two different counties, and 1 author has affiliations in three counties. After normalizing for this, we present the distribution of the submitting authors’ affiliation origins, as shown in Figure 2. In total, authors submitted with affiliations from 64 different countries.
Figure 3 presents the distribution of the normalized number of accepted posters per affiliation country, and Figure 4 compares the percentage of accepted versus submitted posters per affiliation country.

Figure 3: Normalized number of accepted posters per affiliation country. The difference between the submitted (Figure 2) and the accepted (Figure 3) is visualized in Figure 4.

Figure 4: The percentage of accepted versus the percentage of submitted posters.
We also examine the overall distribution of Associate Chairs (ACs) for the CHI 2026 poster track by the location of their affiliation. This is reflected in Figure 5. Here, we see that the majority of ACs for the CHI’26 poster track are located in the United States of America.
Figure 5: Absolute number of ACs for CHI 2026 poster track per country based on their affiliation location.
Figure 6 shows the difference between the proportions of ACs and poster submitters by affiliation location. The USA again shows a proportion difference of 14.3% between ACs and submitted posters, as they contributed more ACs (36.4%) than posters (22.2%).

Figure 6: Difference in proportion between submitting authors and number of ACs based on affiliation location for the CHI 2026 poster track
Of the 6438 unique authors, each submitted on average 1.2 posters (SD = 0.7). However, most authors (N = 5448) contributed to only one poster submission. Only 32 authors submitted more than 5 poster submissions, and 1 submitted more than 10 posters. Figure 7 shows the full distribution.
Additionally, Figure 8 shows the distribution of the number of authors per poster by affiliation location.

Figure 7: Number of submitted posters per author

Figure 8: Number of authors per poster by affiliation location
The associated chairs provide a total of 2181 reviews. On top, a total of 2024 individuals provide 3822 external reviews. On average, an external reviewer did 1.9 reviews (SD=2.0).
Authors could categorize their work across six non-exclusive focus categories (see Table 1). Of the 2,068 submissions, Short Studies were the most prevalent, appearing in 1,235 submissions in total, with 798 authors choosing it as their sole focus and 154 pairing it with Prototypes — and it also achieved the highest solo acceptance rate at 42.1%. Prototypes appeared in 707 submissions in total, with 332 as sole focus and 154 combined with Short Studies, at a 37.0% solo acceptance rate. Case Studies totaled 300 submissions, with 97 as sole focus and 71 paired with Short Studies, at a 35.1% solo acceptance rate. Provocations — papers that challenge assumptions and open debates in HCI — appeared in 253 submissions in total, with 109 as sole focus and 62 paired with Short Studies, at a 33.9% solo acceptance rate. Finally, Systems or Toolkits appeared in 222 submissions in total, with only 51 as sole focus but 68 paired with Prototypes — the only category where the most common combination outnumbered the solo count — at a 37.3% solo acceptance rate. One future suggestion could be allowing authors to select a primary type and a secondary type; this edit would clean up some of the numbers but let’s summarize best we can.
| 2026 | 2025 | |||
|---|---|---|---|---|
| Type | Submitted | Accept Rate† | Submitted | Accept Rate |
| Short Study | 1235 | 42.1% | 1888 | 32.7% |
| Prototypes | 707 | 37.7% | n/a | n/a |
| Case Studies | 300 | 32.1% | 198 | 23.7% |
| Provocations | 253 | 34.9% | 100 | 32.0% |
| Systems/Tools | 222 | 37.2% | n/a | n/a |
During submission, the poster authors could select from five default contribution types (prototype, provocation, case study, short study, and system or toolkit). Additionally, the authors could use the “Other” type for a different contribution type. Since a submission can have multiple contribution types, authors were allowed to select multiple. The majority of all papers were reported with only one contribution type (N=1448, 70.0%). After normalizing the 6 basic contribution types (including others), we see that the majority of submissions use a short study as a contribution type, which also has the highest acceptance rate (see Figure 9).

Figure 9: The number of contribution types the authors select during submission and their respective acceptance rates.
Looking at the 2026 Poster’s Track refactor, we see more Provocations and more Case Studies were submitted to the conference and both were accepted at a higher rate than in 2025. The track was also opened up to allowing prototypes, open-source toolkits, and systems which had a healthy entry into the conference. This shows potential for the Posters track as an area to support legacy submission areas while allowing new and emergent research areas into the conference. We look forward to the growth and new topic areas the Posters track can feature in future editions of the ACM CHI Conference.
此内容由惯性聚合(RSS阅读器)自动聚合整理,仅供阅读参考。 原文来自 — 版权归原作者所有。