






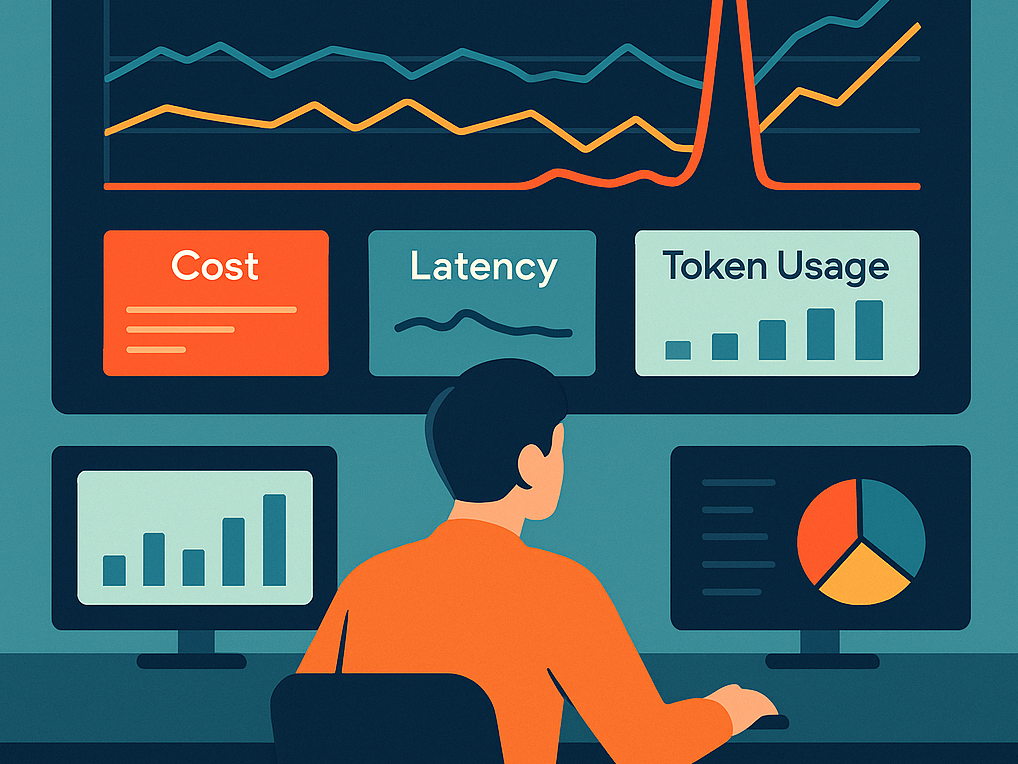
We’re starting to see a pattern with LLM apps in production: things are humming along… until suddenly they’re not. You start hearing:
It’s not always obvious what to track when you’re dealing with probabilistic systems like LLMs. But if you don’t set up real-time monitoring and alerting early, especially for cost and latency, you might miss a small issue that quietly escalates into a big cost overrun.
The good news: you don’t need a fancy toolset to get started. You can use OpenTelemetry for basic metrics, or keep it simple with custom request logging. The key is being intentional and catching the high-leverage signals.
Here are some top reads that will help you get your arms around it.
A crisp primer that defines token count, latency, and cost as the pillars of observability. It’s tool-agnostic and shows how to wire up Prometheus dashboards via OpenTelemetry.
This one gets into the weeds but in a good way. It walks through tagging each request with a prompt ID and user ID so you can trace token spikes back to real root causes. Comes with useful alert rule examples.
Useful latency benchmarks per use case: chat, search, RAG. Suggests setting alert thresholds at 20% over your p95 SLOs to catch slippage early.
Starts broad, then gets practical. Has a great checklist for real-time dashboards, latency and token gauges, plus rituals like weekly reviews to refine thresholds. Also dives into pros/cons of current tools.
A broader take on the space, but solid advice. Introduces a three-layer stack (telemetry → dashboards → alerts) and gives sample PagerDuty rules for token or latency anomalies.
此内容由惯性聚合(RSS阅读器)自动聚合整理,仅供阅读参考。 原文来自 — 版权归原作者所有。