惯性聚合 高效追踪和阅读你感兴趣的博客、新闻、科技资讯
阅读原文 在惯性聚合中打开

推荐订阅源

The Last Watchdog
The Last Watchdog
Exploit-DB.com RSS Feed
S
Secure Thoughts
MongoDB | Blog
MongoDB | Blog
博客园 - Franky
T
Tor Project blog
Threat Intelligence Blog | Flashpoint
Google DeepMind News
L
LINUX DO - 最新话题
博客园_首页
奇客Solidot–传递最新科技情报
奇客Solidot–传递最新科技情报
Vercel News
Vercel News
Last Week in AI
Last Week in AI
月光博客
月光博客
cs.CL updates on arXiv.org
P
Proofpoint News Feed
博客园 - 叶小钗
NISL@THU
NISL@THU
C
Check Point Blog
K
Kaspersky official blog
N
News and Events Feed by Topic
OSCHINA 社区最新新闻
OSCHINA 社区最新新闻
A
Arctic Wolf
T
Threatpost
GbyAI
GbyAI
L
LINUX DO - 热门话题
钛媒体:引领未来商业与生活新知
钛媒体:引领未来商业与生活新知
P
Privacy & Cybersecurity Law Blog
N
News and Events Feed by Topic
Scott Helme
Scott Helme
P
Privacy International News Feed
The Register - Security
G
GRAHAM CLULEY
Recorded Future
Recorded Future
Apple Machine Learning Research
C
Cybersecurity and Infrastructure Security Agency CISA
B
Blog
Project Zero
Project Zero
Cyberwarzone
Cyberwarzone
Webroot Blog
Webroot Blog
Microsoft Security Blog
cs.CV updates on arXiv.org
D
DataBreaches.Net
J
Java Code Geeks
AWS News Blog
AWS News Blog
Help Net Security
Help Net Security
Engineering at Meta
Engineering at Meta
M
MIT News - Artificial intelligence
T
Threat Research - Cisco Blogs
Google DeepMind News

qubeijun的博客

言语理解与表达 父亲往事-我儿子叫冬冬 公务员行测答题顺序及用时及答题技巧 判断推理 数量关系 冬甜夫妇5-10-5-21日本蜜月行程安排回归总结篇(无图片) 冬甜夫妇5.10-5.21日本蜜月行程安排计划篇 5.1 小贝壳疫苗计划 100DAYS 父亲往事-猴牤大爷的“帽子” 父亲往事-姨妈家的葡萄架 父亲往事-十五的月饼 父亲往事-姑妈的压岁钱 父亲往事-母亲的缝纫机父亲的锯 父亲往事-家属来队 父亲往事-新兵连的生活 父亲往事-村北的槐树林 父亲往事-小贝壳 公务员面试 系统架构设计师 图形推理 数学运算 父亲往事-惊蛰 资料分析 父亲往事-偷吃西红柿有绝窍 父亲往事-毯子衣服 父亲往事-水壶煮鸡蛋 父亲往事-煎饼蘸香油 系统架构设计师论文 软件设计师 父亲往事-大哥 资料分析-旧 mysql数据库定时备份&运行日志定时清理 各种问题解决答案汇总 Alibaba Cloud Toolkit的使用说明 Dojo简单入门 Angular简单入门 vue基础知识点总结 java正则表达式收集 java处理时间和日期api java常用的io,输入输出 java常见集合汇总 java调试代码不再用system.out.println(),用日志来调试程序 java常用工具类总结 java常用字符串操作总结 python之pymysql增删改查mysql数据库 词性标注集 python获取当前文件夹下的所有的文件名 mysql数据库操作总结 (翻译)Understanding LSTM Networks (翻译)Understanding Convolutional Neural Networks for NLP (翻译)传统和深度学习模型在文本分类中的应用综述与基准 小木虫论坛-学术科研互动平台爬虫 solr命令(持续更新) python json读写操作 python pip安装包镜像 python数字进度条 抓取维基百科分类索引下某一分类下的子分类及其分类下的页面(仅限词条) python3循环读取excel文件并写入json python3 requests动态网页post提交数据 python+selenium搜狗微信主页抓取 2017年5月25日 2017年5月18日 2017年5月17日 2017年5月15日 2017年5月16日 2017年5月14日 2017年5月13日 2017年5月12日 2017年5月11日 2017年5月10日 2017年5月9日 2017年5月8日 2017年5月7日 2017年5月6日 2017年5月5日 2017年5月4日 2017年5月3日 2017年5月2日 2017年5月1日 儿子的信-2013年7月9日 儿子的信-2013年7月8日 儿子的信-2011年11月26日 儿子的信-2010年8月16日 儿子的信-2010年1月2日
基于grafana的监控部署
qubeijun · 2023-04-06 · via qubeijun的博客

发表于|更新于|技术

|总字数:1.7k|阅读时长:9分钟|浏览量:|

基于grafana的监控部署

1.Grafana

Grafana是一个开源的,拥有丰富dashboard和图表编辑的指标分析平台
配置文件:通过nginx反向代理让域名能访问grafana平台

相关命令

1
2
3
4
启动:service grafana-server start
停止:service grafana-server stop
重启:service grafana-server restart
加入开机自启动: chkconfig --add grafana-server on

2.Prometheus

Prometheus Server负责定时在目标上抓取Metrics数据,每个抓取目标都需要暴露一个HTTP服务接口用于Prometheus定时抓取
配置文件:将各种监控插件的接口暴漏给prometheus进行抓去

prometheus.yml(也可以额外新增配置文件,在prometheus.yml中直接引用)

1
2
3
4
5
6
7
8
9
10
11
12
13
14
15
16
17
18
19
20
21
22
23
24
25
26
27
28
29
30
31
32
# my global config
global:
scrape_interval: 15s # Set the scrape interval to every 15 seconds. Default is every 1 minute.
evaluation_interval: 15s # Evaluate rules every 15 seconds. The default is every 1 minute.
# scrape_timeout is set to the global default (10s).

# Alertmanager configuration
alerting:
alertmanagers:
- static_configs:
- targets:
# - alertmanager:9093

# Load rules once and periodically evaluate them according to the global 'evaluation_interval'.
rule_files:
# - "first_rules.yml"
# - "second_rules.yml"

# A scrape configuration containing exactly one endpoint to scrape:
# Here it's Prometheus itself.
scrape_configs:
# The job name is added as a label `job=<job_name>` to any timeseries scraped from this config.
- job_name: "prometheus"
# metrics_path defaults to '/metrics'
# scheme defaults to 'http'.
static_configs:
- targets: ["ip:port"]

- job_name: 'neusoft'
file_sd_configs:
- files:
- /home/neusoft/sdkjg/installfiles/conf/neusoft.json

neusoft.json

1
2
3
4
5
6
7
8
9
10
11
12
13
14
15
16
17
18
19
20
21
22
[
{
"targets": [
"ip:port"
],
"labels": {
"group": "neusoft",
"app": "",
"hostname": "nacos"
}
},
{
"targets": [
"ip:port"
],
"labels": {
"group": "neusoft",
"app": "",
"hostname": "微服务"
}
}
]

启动命令(指定端口–web.listen-address、指定数据存储位置–storage.tsdb.path)

1
nohup /home/neusoft/sdkjg/installfiles/prometheus-2.42.0.linux-amd64/prometheus --config.file=/home/neusoft/sdkjg/installfiles/prometheus-2.42.0.linux-amd64/prometheus.yml  --web.listen-address=':9190' --storage.tsdb.path="/mnt/data/neusoft/sdkjg/app/data" > /var/log/prometheus.log 2>&1 &

3.node_export

node-exporter用于采集服务器层面的运行指标,包括机器的loadavg、filesystem、meminfo等基础监控

启动命令(指定端口–web.listen-address)

1
nohup /home/neusoft/sdkjg/installfiles/node_exporter --web.listen-address=':9100'  > /var/log/node_exporter.log 2>&1 &

4.promtail

Promtail 将本地日志内容传送到 Loki 实例

配置文件

  • 微服务
1
2
3
4
5
6
7
8
9
10
11
12
13
14
15
16
17
18
server:
http_listen_port: 9080
grpc_listen_port: 0

positions:
filename: /tmp/positions.yaml

clients:
- url: http://ip:3100/loki/api/v1/push

scrape_configs:
- job_name: sbsdebug
static_configs:
- targets:
- localhost
labels:
job: sbs_debug
__path__: /home/neusoft/sdkjg/app/jar/logs/sdstm-business-services/debug.log
  • nginx
1
2
3
4
5
6
7
8
9
10
11
12
13
14
15
16
17
18
19
server:
http_listen_port: 9080
grpc_listen_port: 0

positions:
filename: /tmp/positions.yaml

clients:
- url: http://ip:3100/loki/api/v1/push

scrape_configs:
- job_name: nginx
static_configs:
- targets:
- localhost
labels:
job: nginx_access_log
__path__: /usr/local/nginx/logs/json_access.log

格式化nginx出输出日志

1
2
3
4
5
6
7
8
9
10
11
12
13
14
15
16
17
18
19
20
21
22
23
24
25
26
27
28
29
30
31
32
33
34
35
36
37
38
39
40
41
log_format json_analytics escape=json '{'
'"msec": "$msec", ' # request unixtime in seconds with a milliseconds resolution
'"connection": "$connection", ' # connection serial number
'"connection_requests": "$connection_requests", ' # number of requests made in connection
'"pid": "$pid", ' # process pid
'"request_id": "$request_id", ' # the unique request id
'"request_length": "$request_length", ' # request length (including headers and body)
'"remote_addr": "$remote_addr", ' # client IP
'"remote_user": "$remote_user", ' # client HTTP username
'"remote_port": "$remote_port", ' # client port
'"time_local": "$time_local", '
'"time_iso8601": "$time_iso8601", ' # local time in the ISO 8601 standard format
'"request": "$request", ' # full path no arguments if the request
'"request_uri": "$request_uri", ' # full path and arguments if the request
'"args": "$args", ' # args
'"status": "$status", ' # response status code
'"body_bytes_sent": "$body_bytes_sent", ' # the number of body bytes exclude headers sent to a client
'"bytes_sent": "$bytes_sent", ' # the number of bytes sent to a client
'"http_referer": "$http_referer", ' # HTTP referer
'"http_user_agent": "$http_user_agent", ' # user agent
'"http_x_forwarded_for": "$http_x_forwarded_for", ' # http_x_forwarded_for
'"http_host": "$http_host", ' # the request Host: header
'"server_name": "$server_name", ' # the name of the vhost serving the request
'"request_time": "$request_time", ' # request processing time in seconds with msec resolution
'"upstream": "$upstream_addr", ' # upstream backend server for proxied requests
'"upstream_connect_time": "$upstream_connect_time", ' # upstream handshake time incl. TLS
'"upstream_header_time": "$upstream_header_time", ' # time spent receiving upstream headers
'"upstream_response_time": "$upstream_response_time", ' # time spend receiving upstream body
'"upstream_response_length": "$upstream_response_length", ' # upstream response length
'"upstream_cache_status": "$upstream_cache_status", ' # cache HIT/MISS where applicable
'"ssl_protocol": "$ssl_protocol", ' # TLS protocol
'"ssl_cipher": "$ssl_cipher", ' # TLS cipher
'"scheme": "$scheme", ' # http or https
'"request_method": "$request_method", ' # request method
'"server_protocol": "$server_protocol", ' # request protocol, like HTTP/1.1 or HTTP/2.0
'"pipe": "$pipe", ' # "p" if request was pipelined, "." otherwise
'"gzip_ratio": "$gzip_ratio", '
'"http_cf_ray": "$http_cf_ray",'
'"geoip_country_code": "$http_cf_ipcountry"'
'}';
access_log logs/json_access.log json_analytics;

启动命令

1
nohup /home/neusoft/sdkjg/installfiles/promtail-linux-amd64 -config.file=/home/neusoft/sdkjg/installfiles/promtail-local-config-linux.yaml  > /var/log/promtail.log 2>&1 &

5.loki

Loki是 Grafana Labs 团队最新的开源项目,是一个水平可扩展,高可用性,多租户的日志聚合系统。
Loki日志系统由以下3个部分组成:

  • loki是主服务器,负责存储日志和处理查询。
  • promtail是专为loki定制的代理,负责收集日志并将其发送给 loki 。
  • Grafana用于 UI展示。

配置文件

  • 微服务
1
2
3
4
5
6
7
8
9
10
11
12
13
14
15
16
17
18
19
20
21
22
23
24
25
26
27
28
29
30
31
32
33
34
35
36
37
38
39
40
41
42
43
44
45
46
47
48
49
50
auth_enabled: false

server:
http_listen_port: 3100
grpc_listen_port: 9096

common:
instance_addr: ip
path_prefix: /tmp/loki
storage:
filesystem:
chunks_directory: /tmp/loki/chunks
rules_directory: /tmp/loki/rules
replication_factor: 1
ring:
kvstore:
store: inmemory

query_range:
results_cache:
cache:
embedded_cache:
enabled: true
max_size_mb: 100

schema_config:
configs:
- from: 2020-10-24
store: boltdb-shipper
object_store: filesystem
schema: v11
index:
prefix: index_
period: 24h

ruler:
alertmanager_url: http://localhost:9093

# By default, Loki will send anonymous, but uniquely-identifiable usage and configuration
# analytics to Grafana Labs. These statistics are sent to https://stats.grafana.org/
#
# Statistics help us better understand how Loki is used, and they show us performance
# levels for most users. This helps us prioritize features and documentation.
# For more information on what's sent, look at
# https://github.com/grafana/loki/blob/main/pkg/usagestats/stats.go
# Refer to the buildReport method to see what goes into a report.
#
# If you would like to disable reporting, uncomment the following lines:
#analytics:
# reporting_enabled: false
  • nginx
1
2
3
4
5
6
7
8
9
10
11
12
13
14
15
16
17
18
19
20
21
22
23
24
25
26
27
28
29
30
31
32
33
34
35
36
37
38
39
40
41
42
43
44
45
46
47
48
49
50
51
52
53
54
55
56
57
58
auth_enabled: false

server:
http_listen_port: 3100
grpc_listen_port: 9096

common:
instance_addr: ip
path_prefix: /tmp/loki
storage:
filesystem:
chunks_directory: /tmp/loki/chunks
rules_directory: /tmp/loki/rules
replication_factor: 1
ring:
kvstore:
store: inmemory

query_range:
results_cache:
cache:
embedded_cache:
enabled: true
max_size_mb: 100

schema_config:
configs:
- from: 2020-10-24
store: boltdb-shipper
object_store: filesystem
schema: v11
index:
prefix: index_
period: 24h

limits_config:
enforce_metric_name: false
reject_old_samples: true
reject_old_samples_max_age: 168h
ingestion_rate_mb: 30 #修改每用户摄入速率限制,即每秒样本量,默认值为4M
ingestion_burst_size_mb: 15 #修改每用户摄入速率限制,即每秒样本量,默认值为6M

ruler:
alertmanager_url: http://localhost:9093

# By default, Loki will send anonymous, but uniquely-identifiable usage and configuration
# analytics to Grafana Labs. These statistics are sent to https://stats.grafana.org/
#
# Statistics help us better understand how Loki is used, and they show us performance
# levels for most users. This helps us prioritize features and documentation.
# For more information on what's sent, look at
# https://github.com/grafana/loki/blob/main/pkg/usagestats/stats.go
# Refer to the buildReport method to see what goes into a report.
#
# If you would like to disable reporting, uncomment the following lines:
#analytics:
# reporting_enabled: false

启动命令

1
nohup /home/neusoft/sdkjg/installfiles/loki-linux-amd64 -config.file=/home/neusoft/sdkjg/installfiles/loki-local-config-linux.yaml  > /var/log/loki.log 2>&1 &

6.grafana监控

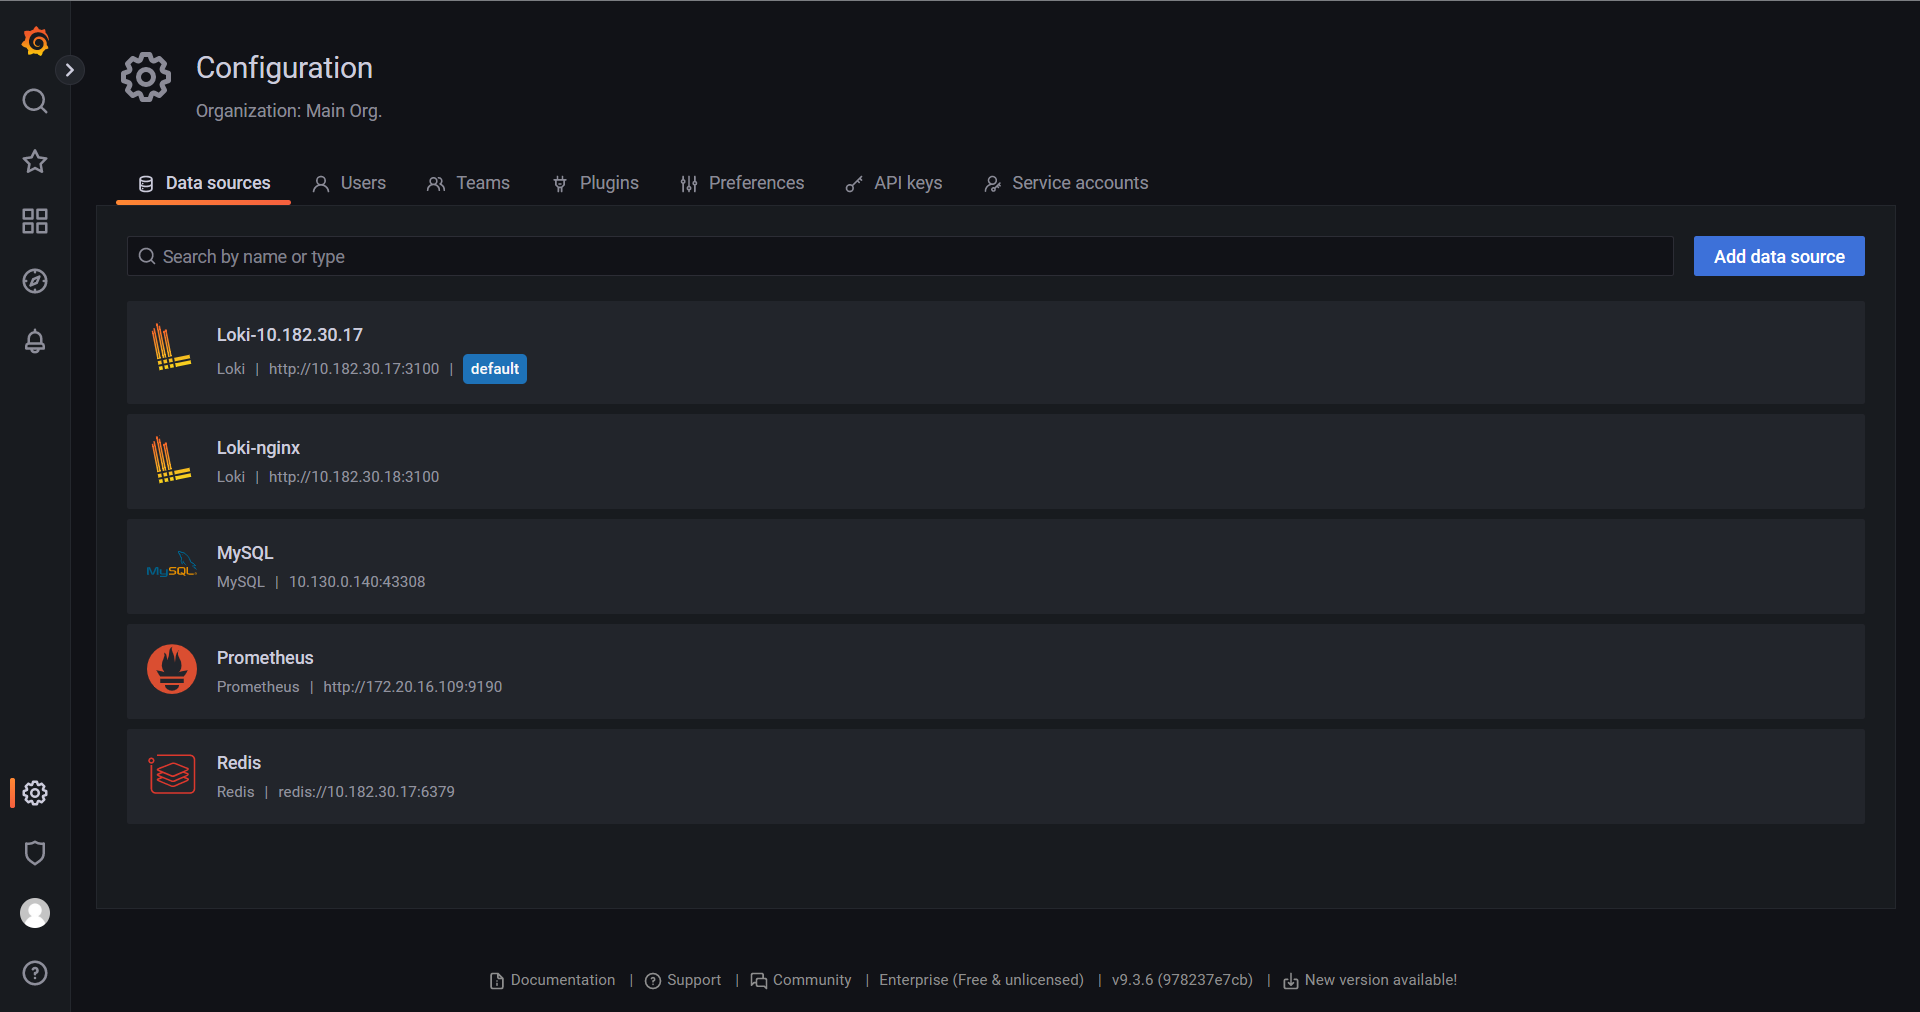
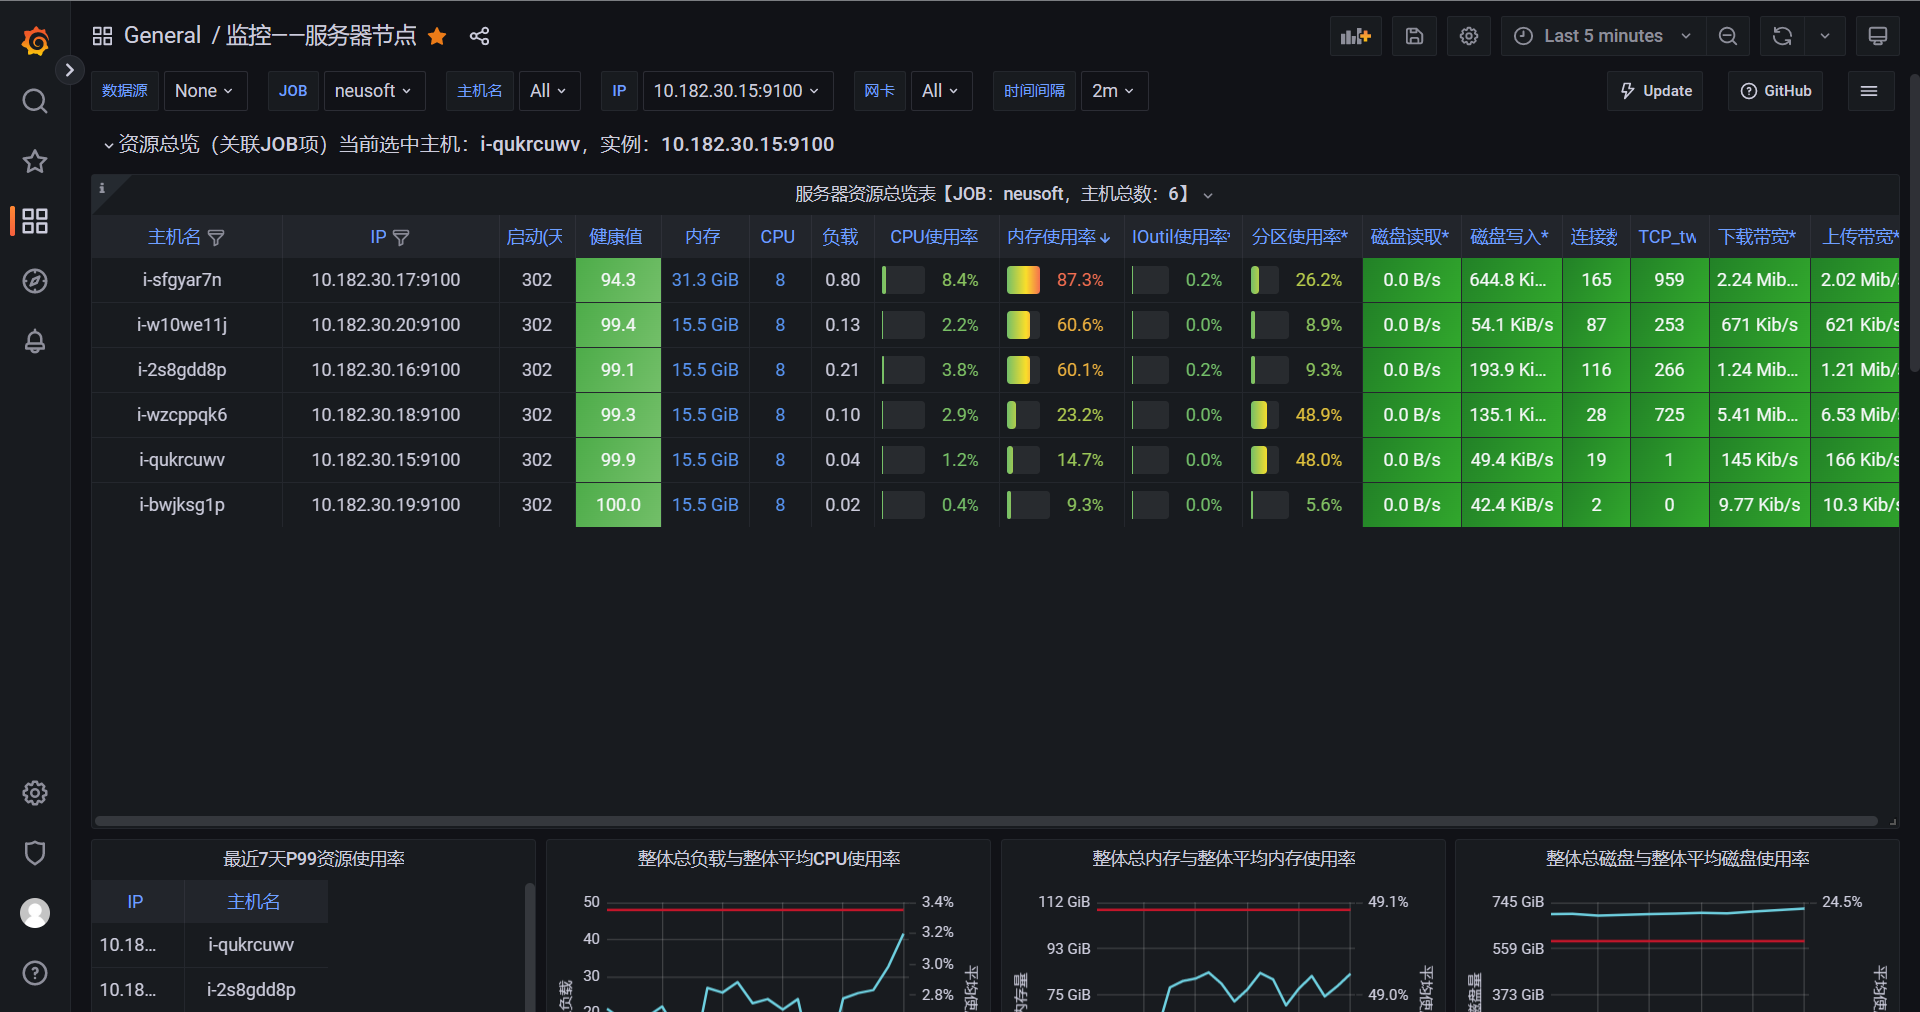
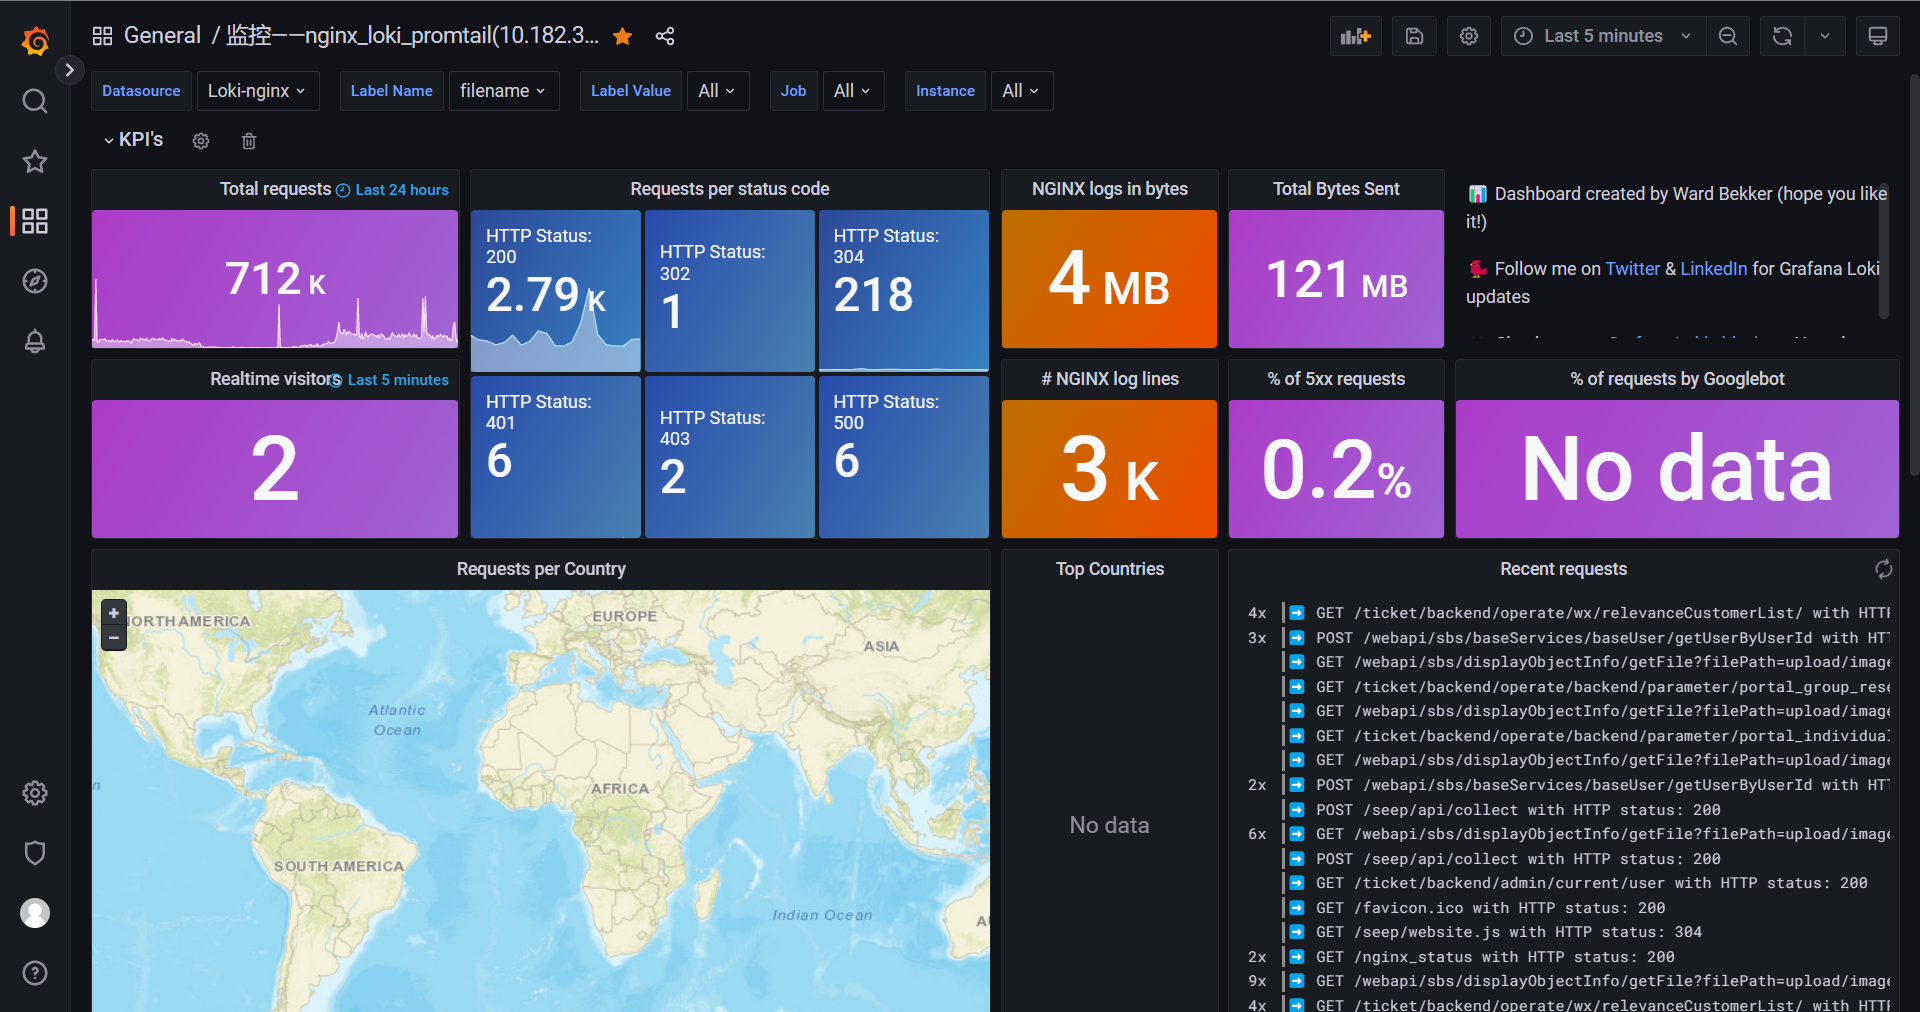
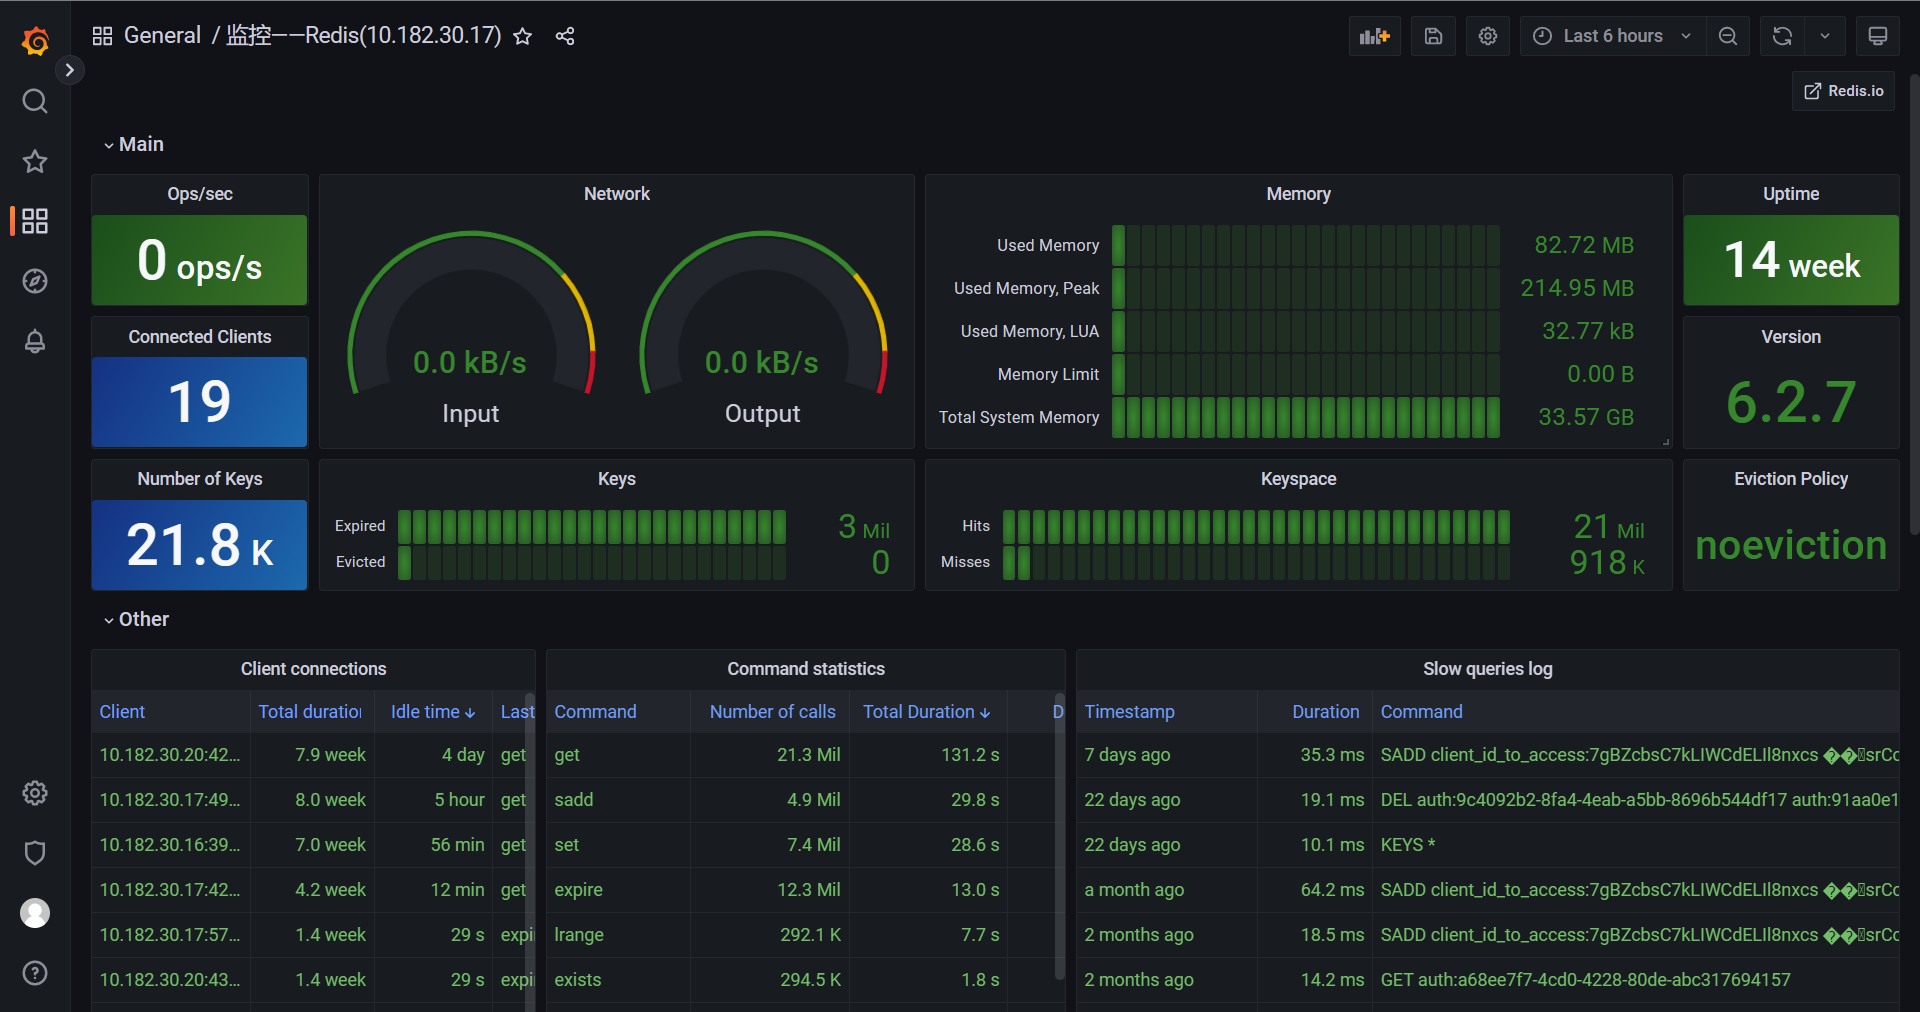
将各监控节点作为数据源配置到grafana平台,在dashboard显示监控大屏
服务器监控
nginx监控
redis监控
版权声明: 本博客所有文章除特别声明外,均采用 CC BY-NC-SA 4.0 许可协议。转载请注明来源 qubeijun的博客

赞助

  • 微信

    微信

  • 支付宝

    支付宝