惯性聚合 高效追踪和阅读你感兴趣的博客、新闻、科技资讯
阅读原文 在惯性聚合中打开

推荐订阅源

V
Visual Studio Blog
U
Unit 42
让小产品的独立变现更简单 - ezindie.com
The GitHub Blog
The GitHub Blog
Microsoft Azure Blog
有赞技术团队
有赞技术团队
Stack Overflow Blog
Stack Overflow Blog
爱范儿
爱范儿
博客园 - 司徒正美
Vercel News
Vercel News
I
InfoQ
GbyAI
GbyAI
C
Check Point Blog
B
Blog RSS Feed
Martin Fowler
Martin Fowler
B
Blog
MyScale Blog
MyScale Blog
腾讯CDC
博客园 - Franky
Blog — PlanetScale
Blog — PlanetScale
钛媒体:引领未来商业与生活新知
钛媒体:引领未来商业与生活新知
Hugging Face - Blog
Hugging Face - Blog
freeCodeCamp Programming Tutorials: Python, JavaScript, Git & More
博客园 - 三生石上(FineUI控件)

Posts on Noah Bailey

How to turn anything into a router Deploy to Cloudfront from GitHub using OpenID Connect Backup Postgres databases with Kubernetes CronJobs The spelling error made 200 billion times a day Restarting Kubernetes pods using a CronJob You've just bought a new domain. Now what? Who Sawed My Motherboard??? Linux on the P8 Aliexpress Mini Laptop Recovering Mysql/Mariadb after a nasty crash Using EXIF data to pick my next lens Converting and developing RAW photos on Linux automatically Thank you, 2016 iPhone Don't Make It Work Self-hosted Surveillance with ZoneMinder Backups, Monitoring, and Security for small Mastodon servers Block web scanners with ipset & iptables Executing commands over SSH with GitHub Actions Debian Sid on encrypted ZFS Protect your dangerously insecure redis server Debian: the luxurious boring lifestyle Monitor radiation with a Raspberry Pi Simple Linux server alerts: Know your performance, errors, security, syslog, and security NUC crashes on debian 11 - How I fixed it Basic Linux server security with fail2ban, ossec, and firewall Windows 11 will create heaps of needless trash Domesticated Kubernetes Networking The Cursed Certificate Our mostly disposable and entirely stupid world Trying out OpenBSD (as a Linux geek) Making VoIP Calls with Antique Rotary Phones
Monitoring WAN latency with InfluxDB
2020-12-08 · via Posts on Noah Bailey

This is a simple, ‘quick and dirty’ way to measure network latency over long periods of time. The only ‘complicated’ part is setting up InfluxDB, but I imagine that many folks already have it set up. To get started, check the official documentation.

Network latency will be measured with the good old ping command, then formatted with generic Unix tools. Then, statistics are stored using the influxdb write endpoint using the line protocol format. It’s a very simple and elegant API if you ask me.

Bash script

A simple bash script is created at /opt/pingmon.sh

#!/bin/bash
curl -i -XPOST "http://localhost:8086/write?db=netstats" \
    --data-binary "ping,dest=cloudflare $(ping -c 1 1.1.1.1 | \
    awk '/time=/{print $7}' | sed -e 's/time/rtt/g') $(date +%s%N)"

When run, this will output the InfluxDB line format:

ping,dest=cloudflare rtt=27.0 1607388217665469702

A few notes about the command:

  • InfluxDB requires nanosecond timestamps, so the Unix epoch plus the nanosecond timestamp is output by date +%s%N
  • The field time is reserved and cannot be used as part of a measurement, so the sed statement replaces ’time’ with ‘rtt’

Cron job

Using cron, the script is run every minute.

* * * * *     nobody    /opt/pingmon.sh

For security the script is run with absolutely no local access. If logging to a local file, it may be preferred to run as a local user instead.

More destinations

To better ‘map’ the internet, I can copy this line and change the ‘dest’ tag. For example, monitoring Google’s 8.8.8.8 ip:

curl -i -XPOST "http://localhost:8086/write?db=netstats" \
    --data-binary "ping,dest=google $(ping -c 1 8.8.8.8 | \
    awk '/time=/{print $7}' | sed -e 's/time/rtt/g') $(date +%s%N)"

Dashboard

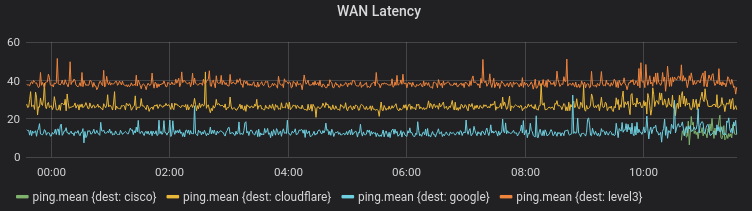
Finally, using Grafana we can chart out these trends over time. Grafana is one of the simplest ways to view influxdb data, and can be installed very easily.