Similar to another post about WAN latency, this is a simple system to automate periodic internet speed tests. The two main components are speedtest-cli and ElasticSearch. These were chosen because I already had both set up and running, along with all the visualization and analytical software. To get a basic POC set up, just install ElasticSearch and Kibana with Docker. Once the node/cluster is running, the ‘speedtest client’ server can be set up.
Install speedtest-cli
Most linux systems will have a reasonably up to date version of this program in their repositories. In my case, Debian 10 has a version 2.0.2 which is fine for our purposes.
sudo apt-get install speedtest-cli
Otherwise, the latest version can be installed from Github - https://github.com/sivel/speedtest-cli
Once installed, be sure to test it by simply running speedtest-cli in the shell.
Though there are many ways to bring the data into the database, I am opting to POST it directly each time the script runs. Another way would be to log locally then use a log collector to forward to Elasticsearch, such as Fluentbit or Filebeat.
Data format
To collect the data, speedtest-cli is used with the --json flag.
speedtest-cli --server 12345 --json
{
    "download": 200132642.07196137,
    "upload": 32705066.252213296,
    "ping": 29.77,
    "server": {
        "url": "http://speedtest.xxx.ca:8080/speedtest/upload.php",
        "lat": "43.000",
        "lon": "-81.000",
        "name": "Town, ON",
        "country": "Canada",
        "cc": "CA",
        "sponsor": "Small Town Cable TV",
        "id": "12345",
        "host": "speedtest.xxx.ca:8080",
        "d": 53.79452630150419,
        "latency": 29.77
    },
    "timestamp": "2020-12-11T01:23:31.996470Z",
    "bytes_sent": 41148416,
    "bytes_received": 250479164,
    "share": null,
    "client": {
        "ip": "203.0.113.12",
        "lat": "42.000",
        "lon": "-84.000",
        "isp": "Internet Co.",
        "isprating": "3.7",
        "rating": "0",
        "ispdlavg": "0",
        "ispulavg": "0",
        "loggedin": "0",
        "country": "CA"
    }
}
The most important part is that the timestamp field is formatted in such a way that it can be imported cleanly into Elasticsearch - fortunately it is, so this JSON object can be uploaded directly into the database.
Bash script
The script is very simple - all it does is run the speedtest program, then send that data to Elasticsearch.
/opt/speedmon.sh
#!/bin/bash
ELASTICSEARCH_SERVER="$1"
DATEFMT=$(date +%Y.%V)

# Select a random server from the 10 closest:
SPEEDTEST_SERVER=$(/usr/local/bin/speedtest-cli --list | tail -n +2 | head -n 10 | awk '{gsub(/\)/,""); print $1}' | shuf | head -n1)

# Run a speedtest against the randomly chosen server:
SPEEDTEST_JSON=$(/usr/local/bin/speedtest-cli --json --server $SPEEDTEST_SERVER)

/usr/bin/curl -s -H "Content-Type: application/json" -XPOST "http://${ELASTICSEARCH_SERVER}:9200/speedtest.$DATEFMT/doc" -d "$SPEEDTEST_JSON" >> /dev/null
The date format is very important in this case, since the ElasticSearch index will be created with the format year-week, or yyyy.ww. This allows the indices to be rotated semi-regularly without causing too many shards to be created. Since this test runs ~hourly each month would have less than a thousand documents, so storage isn’t really a consideration.
Cron job
The script is scheduled to run hourly:
0 * * * * nobody /opt/speedmon.sh
Dashboard
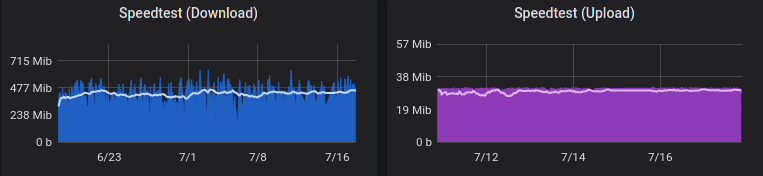
There are many ways to visualize Elasticsearch data, in the case I have used Grafana to chart the average download & upload speed for my network.