

惯性聚合 高效追踪和阅读你感兴趣的博客、新闻、科技资讯
阅读原文 在惯性聚合中打开

推荐订阅源

Forbes - Security
Forbes - Security
The Hacker News
The Hacker News
V
Vulnerabilities – Threatpost
C
CXSECURITY Database RSS Feed - CXSecurity.com
Spread Privacy
Spread Privacy
P
Proofpoint News Feed
AWS News Blog
AWS News Blog
S
Securelist
S
Security @ Cisco Blogs
Cloudbric
Cloudbric
T
Troy Hunt's Blog
SecWiki News
SecWiki News
cs.CL updates on arXiv.org
K
KPMG report finds enterprise disconnect between AI and its ROI | CIO
Security Latest
Security Latest
C
Cyber Attacks, Cyber Crime and Cyber Security
AI
AI
Threat Intelligence Blog | Flashpoint
Stack Overflow Blog
Stack Overflow Blog
I
Intezer
I
InfoQ
Attack and Defense Labs
H
Hackread – Cybersecurity News, Data Breaches, AI and More
Recent Commits to openclaw:main
T
The Exploit Database - CXSecurity.com
Cyber Security Advisories - MS-ISAC
N
News | PayPal Newsroom
云风的 BLOG
云风的 BLOG
S
Secure Thoughts
T
The Blog of Author Tim Ferriss
Martin Fowler
Martin Fowler
L
LINUX DO - 最新话题
Exploit-DB.com RSS Feed
D
Darknet – Hacking Tools, Hacker News & Cyber Security
A
About on SuperTechFans
Hacker News - Newest:
Hacker News - Newest: "LLM"
TaoSecurity Blog
TaoSecurity Blog
www.infosecurity-magazine.com
Webroot Blog
Webroot Blog
L
LangChain Blog
MyScale Blog
MyScale Blog
Recent Announcements
P
Privacy & Cybersecurity Law Blog
Vercel News
Vercel News
Engineering at Meta
Engineering at Meta
C
Cybersecurity and Infrastructure Security Agency CISA
Y
Y Combinator Blog
L
Lohrmann on Cybersecurity
B
Blog RSS Feed
The Last Watchdog
The Last Watchdog

INRIX

INRIX Highlights AI Infrastructure Intelligence at Neudata's New York Summer Data Summit 2026 - INRIX Cities Can Reduce Emissions Without New Infrastructure - INRIX Late Night Football Leads to Lighter Rush Hour in England - INRIX Transparency as a Product Feature: Introducing INRIX Speeds Updates - INRIX Applying for a FHWA/INFRA Grant Track 2? Here’s How INRIX Can Help - INRIX INRIX to Be Recognized at AWS Government Competency Leadership Circle - INRIX How Traffic Engineers Use Probe-Based Signal Analytics to Improve Signal Performance - INRIX World Cup – INRIX Traffic Report (June 16-June 21) - INRIX World Cup – INRIX Traffic Report (June 15) - INRIX INRIX World Cup Traffic Report – Day 1 Prediction for June 11, 2026 - INRIX World Cup – INRIX Traffic Report (June 12-June 15) - INRIX How Shippers, Carriers, and 3PLs Can Reduce Delivery Risk Using Big Data Basemap and INRIX Partner to Expand On‑Demand Access to High‑Precision Transportation Data Through DataCutter From Necessity to Lifestyle: A Year of Bike Commuting INRIX at NACTO Designing Cities 2026: Advancing the Future of Urban Mobility Mobility as a Hazard Signal: Lessons from Tornado-Prone Alabama Why Friday Commutes Are Falling First in the Bay Area’s Supercommuter Belt Memorial Day Doesn’t Just Change Traffic — It Changes Where Crash Risk Happens How Agencies Are Using Signal Analytics to Improve Traffic Operations Why Automated, AI‑Based Traffic Bulletins Beat Manual Reporting Construction Everywhere — But I-90 Became the Biggest Problem INRIX Celebrates NCTCOG’s TexITE Award for Advancing Data-Driven Signal Timing - INRIX How Cities Use Micromobility Data to Make Better Policy Freight Feels the Fuel Squeeze First: INRIX Data Shows Fleets Trimming Distance and Speed Expanding Right-of-Way Intelligence Beyond the Curb and Onto the Sidewalk What Cities Can Learn from Each Other: The Value of Micromobility Benchmarking Five More Innovative Ways to Reduce Traffic Congestion and Improve Mobility Fuel Prices Are Rising, But Driving Behavior Looks Steady Teaching An Old LLM New Tricks: An Innovation Week Project What’s New in INRIX IQ: Signal Analytics, Mission Control & Data Downloader Updates From Data Collection to Public Trust: Why Transparency Matters in Shared Mobility Building a Hybrid Signal Performance Strategy for State DOTs From Data to Decisions: How Ride Report is Powering the Future of Multimodal Mobility What Happens When You Let Traffic Signals Pick Your College Basketball Tournament Finals? Are Drivers Slowing Down to Save Fuel as Prices Rise in March 2026? INRIX Recognized as a 2026 Artificial Intelligence Excellence Award Winner Turning Mobility Data Into Infrastructure Intelligence Detecting Data Center Construction Through Real-World Mobility Signals From Smart Streets to Smarter Cities: Validating and Scaling Traffic Volume Estimation in NYC Getting the Most Out of Micromobility Equity Initiatives with Ride Report Detecting Vehicle Abandonment During Wildfire Evacuations
World Cup – INRIX Traffic Report (June 12-June 28) - INRIX
Ashley Babani · 2026-07-01 · via INRIX

The 2026 FIFA World Cup brought hundreds of thousands of fans to stadiums across the United States, creating noticeable changes in traffic conditions around host venues. Using INRIX traffic data, this analysis examines how vehicle speeds within one mile of the 11 U.S. World Cup stadiums changed before and after matches compared with typical conditions.

The findings highlight which venues experienced the greatest congestion, where traffic impacts were relatively minimal, and how pre- and post-match travel patterns differed across host cities. For more information on the tournament’s initial traffic impacts, read our earlier analysis of the FIFA World Cup Mobility Insights  

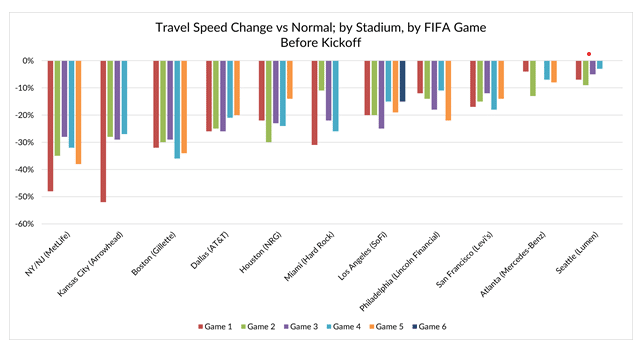
Within one mile of all 11 U.S. stadiums hosting FIFA World Cup events, MetLife Stadium is the most congested, on average. Before FIFA events at MetLife, speeds generally dropped between 30-40% vs normal, while postgame traffic speeds ranged similarly. On the other hand, travel speeds within one mile of Lumen Field in Seattle fell less than 10% across all games during both pre- and post-game. 
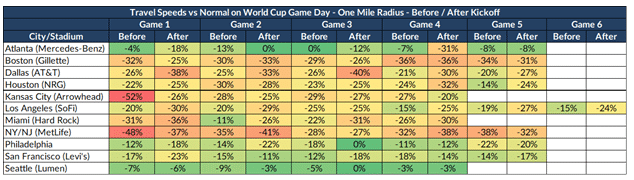
Arrowhead Stadium in Kansas City, MO and Gillette Stadium near Boston, MA also saw significant delays pregame, with traffic speeds falling around 30% versus normal on average. Games in Atlanta and in Seattle saw the least delays pregame, with the worst being Atlanta before Game 2 at a 13% reduction. 
Post game saw a slightly larger reduction in speeds overall, though “normal” traffic speeds are typically higher taking into account evening games. The average game played across all stadiums saw a 21% reduction in speed pregame, versus a 23% reduction in speed postgame.  
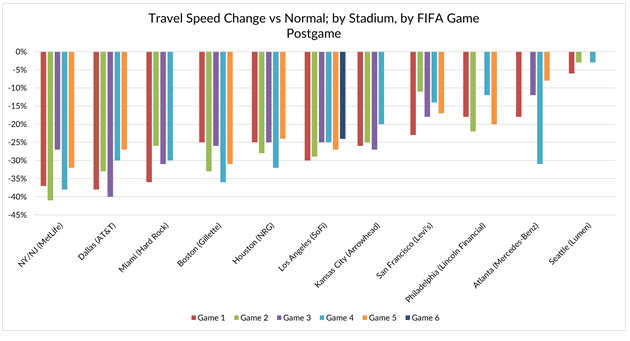
The largest discrepancies were seen in Dallas and in Kansas City. In Dallas, pregame speed drops were significantly less than postgame drops, while in Kansas City, pregame speed drops were significantly higher than postgame drops. 
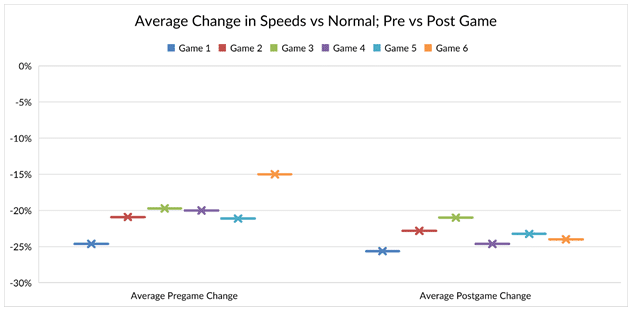
However, more investigation would be needed by day of week and time of day for a more thorough analysis of World Cup impacts to traffic.