
惯性聚合 高效追踪和阅读你感兴趣的博客、新闻、科技资讯
阅读原文 在惯性聚合中打开

推荐订阅源

cs.CV updates on arXiv.org
博客园 - 三生石上(FineUI控件)
博客园 - 司徒正美
博客园_首页
J
Java Code Geeks
V2EX - 技术
V2EX - 技术
让小产品的独立变现更简单 - ezindie.com
K
KPMG report finds enterprise disconnect between AI and its ROI | CIO
TaoSecurity Blog
TaoSecurity Blog
T
Troy Hunt's Blog
Forbes - Security
Forbes - Security
Schneier on Security
Hugging Face - Blog
Hugging Face - Blog
PCI Perspectives
PCI Perspectives
O
OpenAI News
OSCHINA 社区最新新闻
OSCHINA 社区最新新闻
Hacker News: Ask HN
Hacker News: Ask HN
Application and Cybersecurity Blog
H
Heimdal Security Blog
D
Darknet – Hacking Tools, Hacker News & Cyber Security
博客园 - 聂微东
量子位
酷 壳 – CoolShell
酷 壳 – CoolShell
大猫的无限游戏
大猫的无限游戏
WordPress大学
WordPress大学
美团技术团队
V
V2EX
Cisco Talos Blog
Cisco Talos Blog
小众软件
小众软件
奇客Solidot–传递最新科技情报
奇客Solidot–传递最新科技情报
C
Cybersecurity and Infrastructure Security Agency CISA
有赞技术团队
有赞技术团队
腾讯CDC
Cloudbric
Cloudbric
Google DeepMind News
博客园 - 【当耐特】
SecWiki News
SecWiki News
IT之家
IT之家
C
Cisco Blogs
雷峰网
雷峰网
aimingoo的专栏
aimingoo的专栏
B
Blog RSS Feed
S
Schneier on Security
Security Latest
Security Latest
Scott Helme
Scott Helme
H
Help Net Security
Threat Intelligence Blog | Flashpoint
P
Palo Alto Networks Blog
L
LINUX DO - 热门话题
Cyber Security Advisories - MS-ISAC

INRIX

INRIX Highlights AI Infrastructure Intelligence at Neudata's New York Summer Data Summit 2026 - INRIX Cities Can Reduce Emissions Without New Infrastructure - INRIX Late Night Football Leads to Lighter Rush Hour in England - INRIX Transparency as a Product Feature: Introducing INRIX Speeds Updates - INRIX Applying for a FHWA/INFRA Grant Track 2? Here’s How INRIX Can Help - INRIX World Cup – INRIX Traffic Report (June 12-June 28) - INRIX INRIX to Be Recognized at AWS Government Competency Leadership Circle - INRIX How Traffic Engineers Use Probe-Based Signal Analytics to Improve Signal Performance - INRIX World Cup – INRIX Traffic Report (June 16-June 21) - INRIX World Cup – INRIX Traffic Report (June 15) - INRIX INRIX World Cup Traffic Report – Day 1 Prediction for June 11, 2026 - INRIX World Cup – INRIX Traffic Report (June 12-June 15) - INRIX How Shippers, Carriers, and 3PLs Can Reduce Delivery Risk Using Big Data Basemap and INRIX Partner to Expand On‑Demand Access to High‑Precision Transportation Data Through DataCutter From Necessity to Lifestyle: A Year of Bike Commuting INRIX at NACTO Designing Cities 2026: Advancing the Future of Urban Mobility Mobility as a Hazard Signal: Lessons from Tornado-Prone Alabama Why Friday Commutes Are Falling First in the Bay Area’s Supercommuter Belt Memorial Day Doesn’t Just Change Traffic — It Changes Where Crash Risk Happens How Agencies Are Using Signal Analytics to Improve Traffic Operations Why Automated, AI‑Based Traffic Bulletins Beat Manual Reporting Construction Everywhere — But I-90 Became the Biggest Problem INRIX Celebrates NCTCOG’s TexITE Award for Advancing Data-Driven Signal Timing - INRIX How Cities Use Micromobility Data to Make Better Policy Freight Feels the Fuel Squeeze First: INRIX Data Shows Fleets Trimming Distance and Speed Expanding Right-of-Way Intelligence Beyond the Curb and Onto the Sidewalk What Cities Can Learn from Each Other: The Value of Micromobility Benchmarking Five More Innovative Ways to Reduce Traffic Congestion and Improve Mobility Fuel Prices Are Rising, But Driving Behavior Looks Steady Teaching An Old LLM New Tricks: An Innovation Week Project What’s New in INRIX IQ: Signal Analytics, Mission Control & Data Downloader Updates From Data Collection to Public Trust: Why Transparency Matters in Shared Mobility Building a Hybrid Signal Performance Strategy for State DOTs From Data to Decisions: How Ride Report is Powering the Future of Multimodal Mobility What Happens When You Let Traffic Signals Pick Your College Basketball Tournament Finals? Are Drivers Slowing Down to Save Fuel as Prices Rise in March 2026? INRIX Recognized as a 2026 Artificial Intelligence Excellence Award Winner Turning Mobility Data Into Infrastructure Intelligence Detecting Data Center Construction Through Real-World Mobility Signals From Smart Streets to Smarter Cities: Validating and Scaling Traffic Volume Estimation in NYC Detecting Vehicle Abandonment During Wildfire Evacuations
Getting the Most Out of Micromobility Equity Initiatives with Ride Report
Ashley Babani · 2026-03-16 · via INRIX

When shared bikes and scooters show up consistently—at the right density, in the right places—they become a reliable choice.

That reliability is what turns “something you try once” into “something you count on” for a commute, an errand run, or a transit connection. 

But reliability can look very different depending on where you live and the size of your transportation budget. If vehicles don’t get deployed and rebalanced in neighborhoods that need affordable, flexible options most, usage patterns will naturally skew toward higher-demand cores—and the program will look successful while still missing its equity goals. In addition, pricing needs to meet people at a point where they can afford to use the system regularly. 

This blog briefly summarizes the state of micromobility equity programs and new functionality in Ride Report for cities to be able to better evaluate and adjust those programs.  

City Agency Equity Requirements 

Many agencies specify minimum deployment rules—either as a percentage of daily fleet, a minimum number of devices per equity zone, or a minimum number of vehicles placed within a defined geography. The goal is straightforward: ensure baseline availability where the market wouldn’t necessarily optimize on its own and/or where transportation has been historically underserved. Some examples include: 
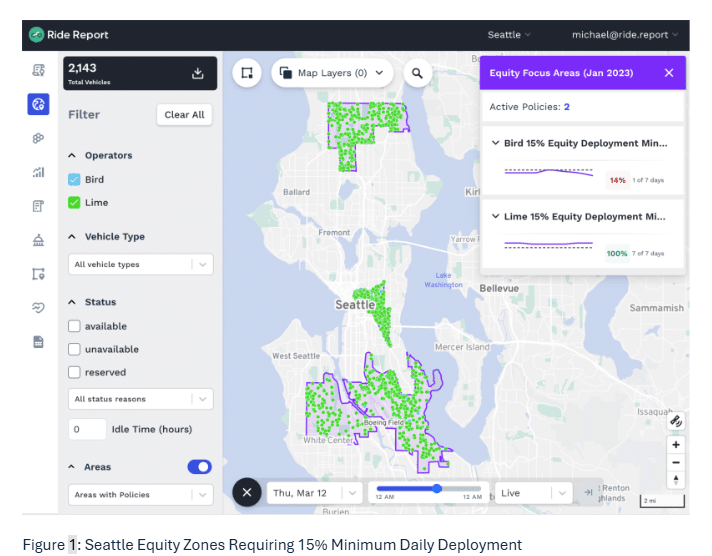
  • Seattle, WA: in addition to deployment requirements in underserved neighborhoods and reduced fare programs, the program takes into account trips taken in targeted neighborhoods when considering fleet cap increases  
  • Durham, NC: operators are required to have a percentage of scooters and bikes available in equity areas

Access programs 

Even when deployments are equitable, pricing can still be a barrier. For that reason, many cities require operators to offer free or reduced fares for qualifying residents and workers—often called “access programs.” 

These programs show up in a few forms: discounted memberships, discounted per-minute rates, ride credits, fee waivers, and options for people without bank accounts or smartphones. Sometimes they’re subsidized by public agencies; other times they’re delivered as part of an operator’s required amenities or negotiated fees. Examples include:

  • Portland, OR (BIKETOWN for All): Low income and free passes subsidized by the signature sponsor, Nike 
  • Denver, CO (value exchange + geographic equity areas): Denver’s shared micromobility program has historically been structured as a “value exchange” (no application, permit, licensing, or per-trip fees), paired with operational requirements—including equity-focused service expectations such as a minimum number of free and reduced fare passes given out to residents.  

Data analysis to date 

Cities rely on the Mobility Data Specification (MDS) to assess compliance with permit requirements like minimum deployments and to understand resulting trip volumes. MDS makes it possible to monitor operations with a consistent framework, and tools like Ride Report can help agencies turn that data into action. 

MDS does not include user-level information. That’s a good thing from a privacy standpoint, but it also means cities cannot get the same level of granular insight on trips using reduced or free fares versus general ridership as a whole. It is all lumped together. 

Operators often share aggregate counts (total trips, total usage) outside of MDS, but those summaries still don’t give agencies a consistent way to evaluate equity programs over time and across geographies.

Introducing Fare Program Metrics in Ride Report 

In close collaboration with operators and cities, Ride Report is introducing Fare Program Metrics. Since Ride Report was built with privacy-by-design principles, metrics are aggregated by geography and/or over time so individual movements can’t be determined. This opens the path for providing metrics for without compromising privacy, especially for larger access programs. 

New capabilities of this feature include: 
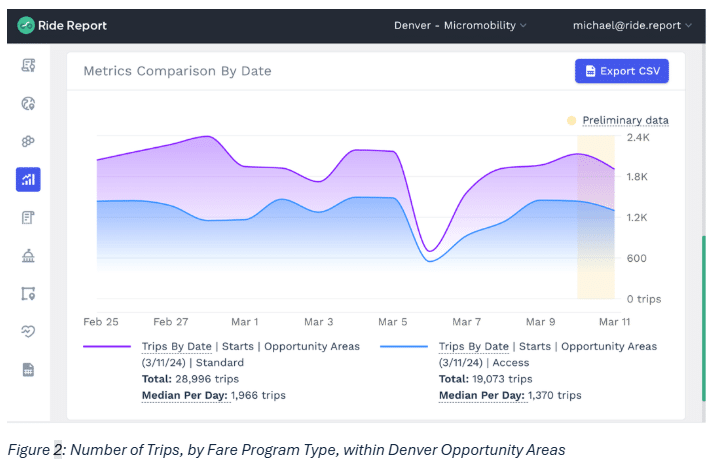
  • More fine-grained program evaluation: 
    • Review trip start and end locations for access program usage by neighborhood or areas of interest. 
    • Understand differences in trip distances and durations between access-program trips and the overall riding population. 
    • Identify preferred facilities used by access riders to better connect equity outcomes to investments in dedicated and protected bike/scooter infrastructure. 
  • Fee and subsidy handling: waive per-trip fees or add per-trip subsidies for trips made using reduced or free pricing. 
  • Continuous improvement: cities can adjust requirements and metrics over time—using the same feedback loop they apply to broader program performance—so equity expectations evolve alongside operations. 

The Denver Regional Council of Governments (DRCOG) brings local governments together to address regional issues, including transportation and mobility. Providing access to shared micromobility services is a priority across the Denver region, and in recent years, local jurisdictions have worked closely with partners to expand access to shared micromobility services through efforts such as reduced fare membership programs. To fully understand the impact of these programs, public agencies need intuitive tools that turn data into actionable insights to more effectively evaluate program performance and improve decision‑making-Emily Lindsey, Program Manager, Active and Emerging Mobility, Denver Regional Council of Governments 

Conclusion 

Effective equity programs are built on operational clarity and mutual trust: cities setting clear goals, operators delivering service consistently, and shared measurement that supports learning without compromising privacy. This results in enhanced mobility options for a wide range of residents and workers.  

The Fare Program Metrics feature is possible because of long-standing relationships between operators, local agencies, and Ride Report. The result is a more practical way to measure what matters—availability, affordability, and outcomes—while staying true to privacy-first data principles. Thanks to our partners in this first implementation: The City and County of Denver, Denver Regional Council of Governments, Lime, and Bird.