





While several venues experienced significant congestion before and after matches, others saw only minor disruptions compared to normal traffic patterns. Matches played between June 16 and June 21 across cities including New York/New Jersey, Kansas City, Dallas, Houston, Los Angeles, Miami, Atlanta, and Boston highlight how kickoff times, commuter activity, and stadium locations influenced congestion levels. For more information on the tournament’s initial traffic impacts, read our earlier analysis of the FIFA World Cup Mobility Insights.
GAME 2: June 16, 2026 – MetLife Stadium – Newark, NJ (NY/NJ) – 3:00pm Kickoff
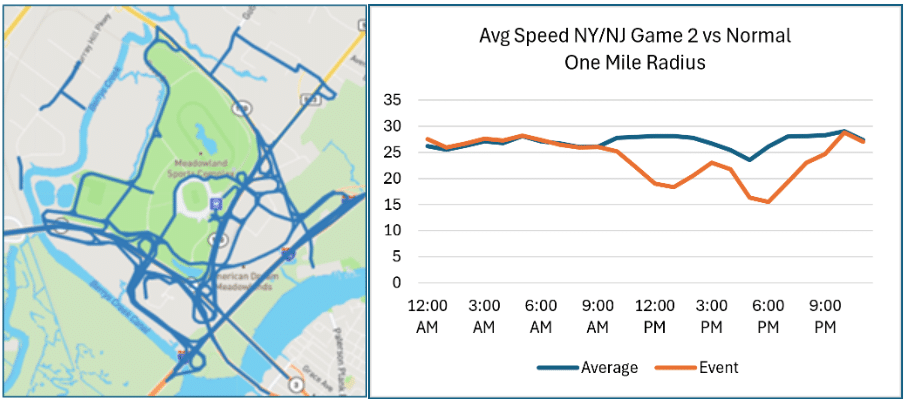
Traffic speeds around Metlife Stadium fell 35% from normal by the 1:00pm hour, two hours prior to kickoff. Yet Metlife experienced more severe congestion after the event, when speeds dropped to 15.5 mph at 6:00pm, 41% slower than the normal speed of 26 mph at that hour.
Traffic speeds had finally recovered to normal during the 10:00pm hour. Traffic congestion was similar to Game 1 in terms of severity (48% slower than normal in Game 1) yet was notably worse after the event in Game 2.
GAME 2: June 16, 2026 – Gillette Stadium – Foxborough, MA (Boston) – 6:00pm Kickoff
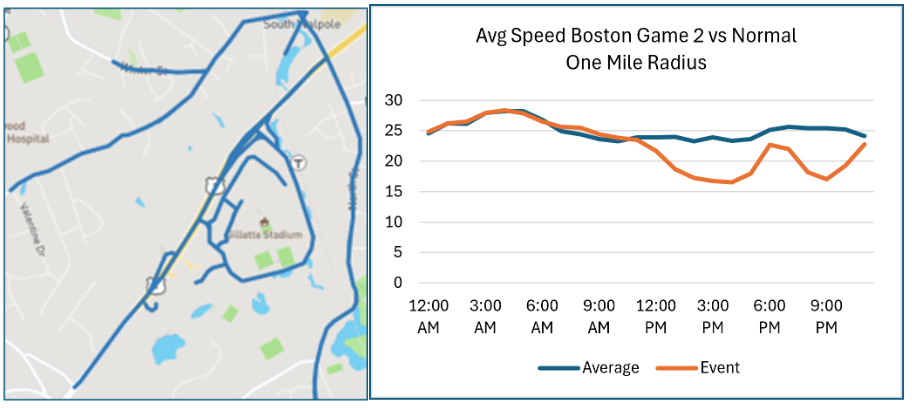
Traffic speeds within one mile of Foxborough dropped 22 – 30% below normal in the five hours prior to kickoff, with travel speeds slowing to 16.5 mph at its lowest point. After the game, traffic speeds fell again until midnight, falling 33% to 17 mph at the 9:00pm hour. The drops in travel speeds were similar to the first World Cup game played at Foxborough, revealing only minimal differences in traffic when compared to weekend games.
GAME 1: June 16, 2026 – Arrowhead Stadium – Kansas City, MO – 8:00pm Kickoff
Arrowhead Stadium hosted it’s first World Cup game on June 16, and saw significant traffic congestion leading up to and after the game. Traffic began building hours before the 8:00pm kickoff, as the stadium opened its doors three hours early.
By the 5:00pm hour, traffic speeds plummeted 52% from normal to 15.9mph within one mile of the stadium. Severe congestion continued until kickoff, and slightly returned by the 10:00pm and 11:00pm hours, where speeds were down 26% below normal at 25.6mph
GAME 2: June 16, 2026 – Levi’s Stadium – Santa Clara, CA (San Francisco) – 9:00pm Kickoff
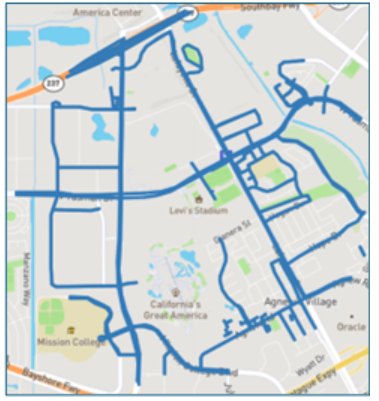
Game 2 at Levi’s Stadium saw slightly less congestion and less volatility than Game 1, perhaps due to the late start time on a weekday. Through travel speeds surrounding the stadium dropped 15% below normal just before kickoff to 17.4mph, traffic throughout the day followed the typical, normal levels for the average Tuesday.
GAME 2: June 17, 2026 – NRG Stadium – Houston, TX – 12:00pm Kickoff
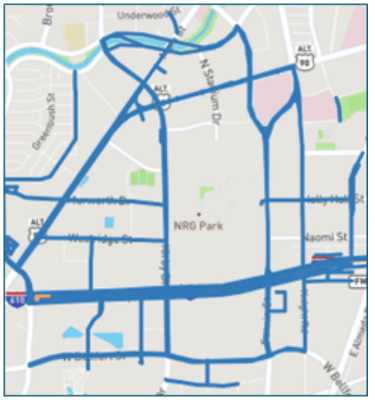
Traffic around NRG Stadium dropped 30% below normal before the game to 16.6mph before kickoff. Postgame, traffic speeds fell again to 28% below normal at 15.8mph, before speeds recovered to their 21 mph normal at 5:00pm.
Game 2 speed drops were more significant than on Game 1 (22% drop), and also saw larger drops in the late afternoon hours, as fan traffic mixed with commuters on the roads.
GAME 2: June 17, 2026 – Dallas Stadium – Dallas, TX – 3:00pm Kickoff
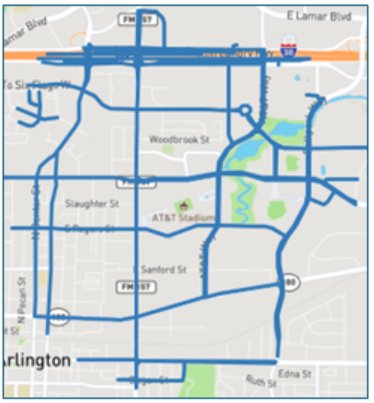
Traffic around AT&T Stadium in Dallas saw significant congestion leading up to kickoff, with speeds dropping 25% below normal to 18.4mph. Severe congestion continued postgame, where traffic speeds fell to 19.1mph, down 33% from the normal 22.9mph at 7:00pm.
GAME 3: June 18, 2026 – SoFi Stadium – Los Angeles, CA – 12:00pm Kickoff
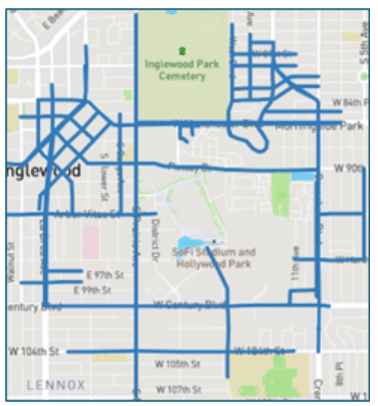
Traffic congestion around SoFi Stadium began to build as early as 9:00am, when traffic speeds fell 2.2mph to 16.1mph, a 12% drop. Traffic jams reached their height around the 2:00pm hour, when speeds fell to 13.1mph, down 25% from the 17.4mph norm. Traffic continued post event until the 5:00pm hour when it normalized.
GAME 2: June 18, 2026 – Mercedes-Benz Stadium – Atlanta, GA – 3:00pm Kickoff
Traffic within one mile of Mercedes-Benz Stadium only slightly decreased leading up to kickoff, when speeds dropped 13% below normal to 12.4mph. There was no difference in traffic post-event.
GAME 3: June 20, 2026 – Gillette Stadium – Foxborough, MA (Boston) – 6:00pm Kickoff
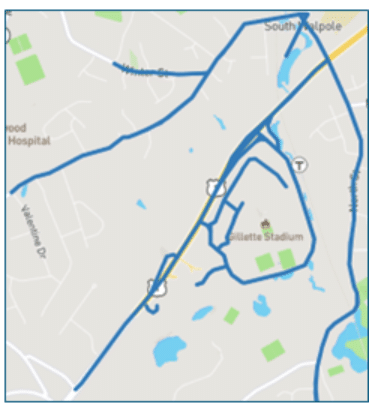
Traffic congestion around Gillette Stadium in Foxborough began to build at about noon and carried through until kickoff. At it’s worst, traffic speeds fell to 16.3mph, 29% slower than the normal, 22.9mph. Post-event, traffic congestion again slowed speeds by 26% below normal, and normalized around 11:00pm that night.
GAME 2: June 19, 2026 – Lincoln Financial Field – Philadelphia, PA – 9:00pm Kickoff
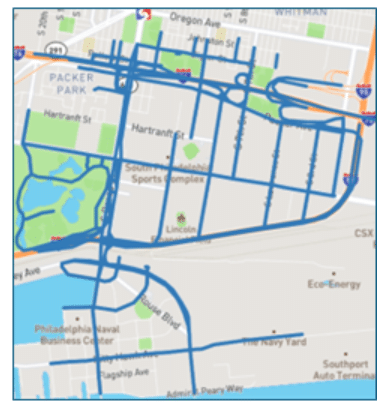
Traffic around Lincoln Financial Field was relatively normal until two hours before kickoff. Traffic speeds fell during the 5:00pm and 6:00pm hours, when it fell to 15.9mph, 14% below the norm of 18.5mph. Postgame, however, traffic speeds fell 22% below normal to 16.4mph during the 11:00pm hour, revealing a few traffic jams heading into the next day.
GAME 3: June 19, 2026 – Levi’s Stadium – Santa Clara, CA (San Francisco) – 8:00pm Kickoff
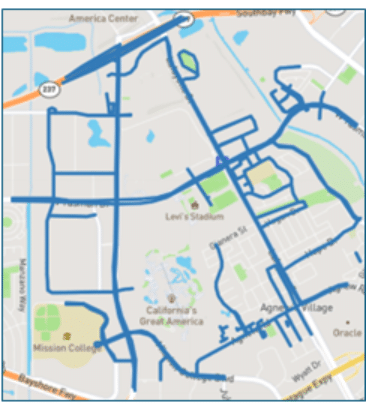
Traffic speeds within one mile of Levi’s Stadium fell only slightly prior to kickoff, when speeds fell 12% below normal during the 6:00pm hour to 17.4mph. Congestion also built post-game, when speeds fell 18% below normal during the 11:00pm hour.
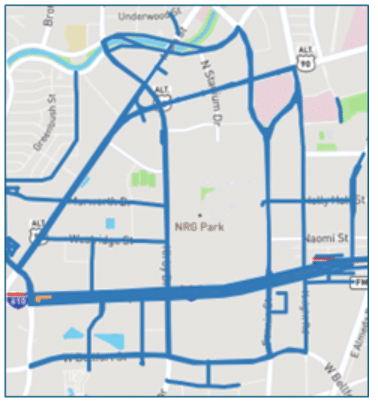
GAME 3: June 20, 2026 – NRG Stadium – Houston, TX – 12:00pm Kickoff
Two hours before kickoff NRG stadium saw its heaviest congestion, when speeds fell to 19.3mph, 23% slower than the 25mph norm. After the event, traffic speeds fell to 18.1mph, 25% slower than normal for the 3:00pm hour.
GAME 2: June 20, 2026 – SoFi Stadium – Kansas City, MO – 7:00pm Kickoff
Soccer fans in Kansas City showed up early for the event, with traffic congestion building as early as 1:00pm until kickoff. Speeds fell the most during the 4:00pm hour, hitting 24.9mph, 28% below normal. After the event, speeds again fell 25% below normal to 26.5mph in the 10:00pm hour.
GAME 3: June 21, 2026 – Mercedes-Benz Stadium – Atlanta, GA – 12:00pm Kickoff
Traffic around Mercedes-Benz Stadium continues to be relatively low around World Cup events, with traffic speeds dipping only during the post game. Traffic speeds fell just 12% below normal to 13.3mph.
GAME 2: June 21, 2026 – Miami Stadium – Miami, FL – 6:00pm Kickoff
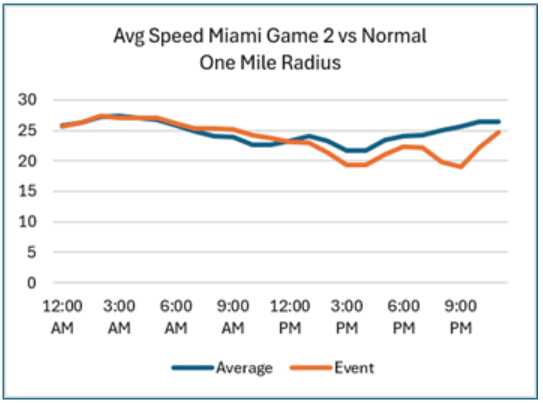
Traffic speeds only slightly fell pregame, with travel speeds falling to 19.3mph within a one mile radius of the stadium during the 4:00pm hour. Leaving the stadium was another story, however, as speeds fell as much as 26% below normal during the 9:00pm hour.
GAME 4: June 21, 2026 – SoFi Stadium – Los Angeles, CA – 12:00pm Kickoff
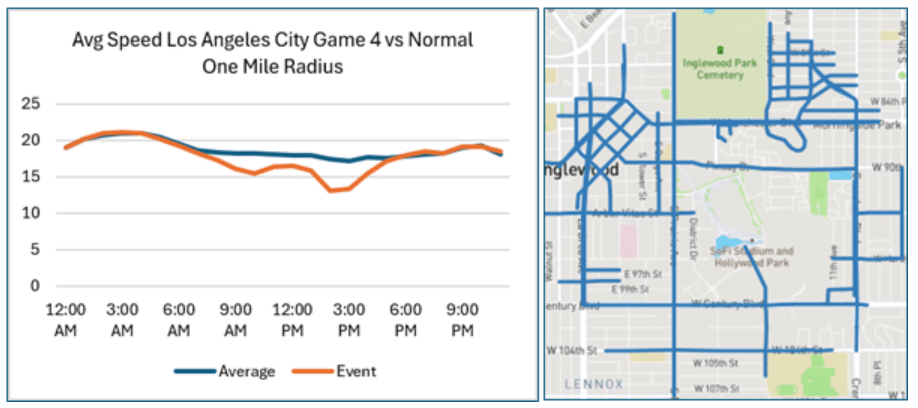
Traffic within a one mile radius of SoFi Stadium saw similar traffic patterns as past World Cup events, with a relatively small decrease in traffic before kickoff, followed by a more-significant dropoff in speeds postgame. Speeds fell 15% below normal to 15.5mph during the 10:00am hour, and ultimately fell 25% below normal to 13.4mph during the 2:00pm hour. Conditions remained congested until the 5:00pm hour when traffic normalized.
Learn more here about the INRIX FIFA World Cup Mobility Insights.
此内容由惯性聚合(RSS阅读器)自动聚合整理,仅供阅读参考。 原文来自 — 版权归原作者所有。