
Need Some Help?
I help companies find and fix site-speed issues. Performance audits, training, consultancy, and more.




Written by on CSS Wizardry.
Independent writing is brought to you via my wonderful Supporters.
DOMContentLoadedHonestly, I started writing this article for no real reason, and somewhat
without context, in December 2022—over half a year ago! But, I left it in
_drafts/ until today, when a genuinely compelling scenario came up that gives
real opportunity for explanation. It no longer feels like
trivia-for-the-sake-of-it thanks to a recent client project.
I never thought I’d write an article in defence of DOMContentLoaded, but here
it is…
Want actionable timings and not just trivia? Explore my consultancy services.
Need Some Help?
I help companies find and fix site-speed issues. Performance audits, training, consultancy, and more.
For many, many years now, performance engineers have been making a concerted
effort to move away from technical metrics such as Load, and toward more
user-facing, UX metrics such as Speed
Index
or Largest Contentful
Paint.
However, as an internal benchmark, there are compelling reasons why some of you
may actually want to keep tracking these ‘outdated’ metrics…
The problem with using diagnostic metrics like Load or DOMContentLoaded to
measure site-speed is that it has no bearing on how a user might actually
experience your site. Sure, if you have Load times of 18 seconds, your site
probably isn’t very fast, but a good Load time doesn’t mean your site is
necessarily very fast, either.
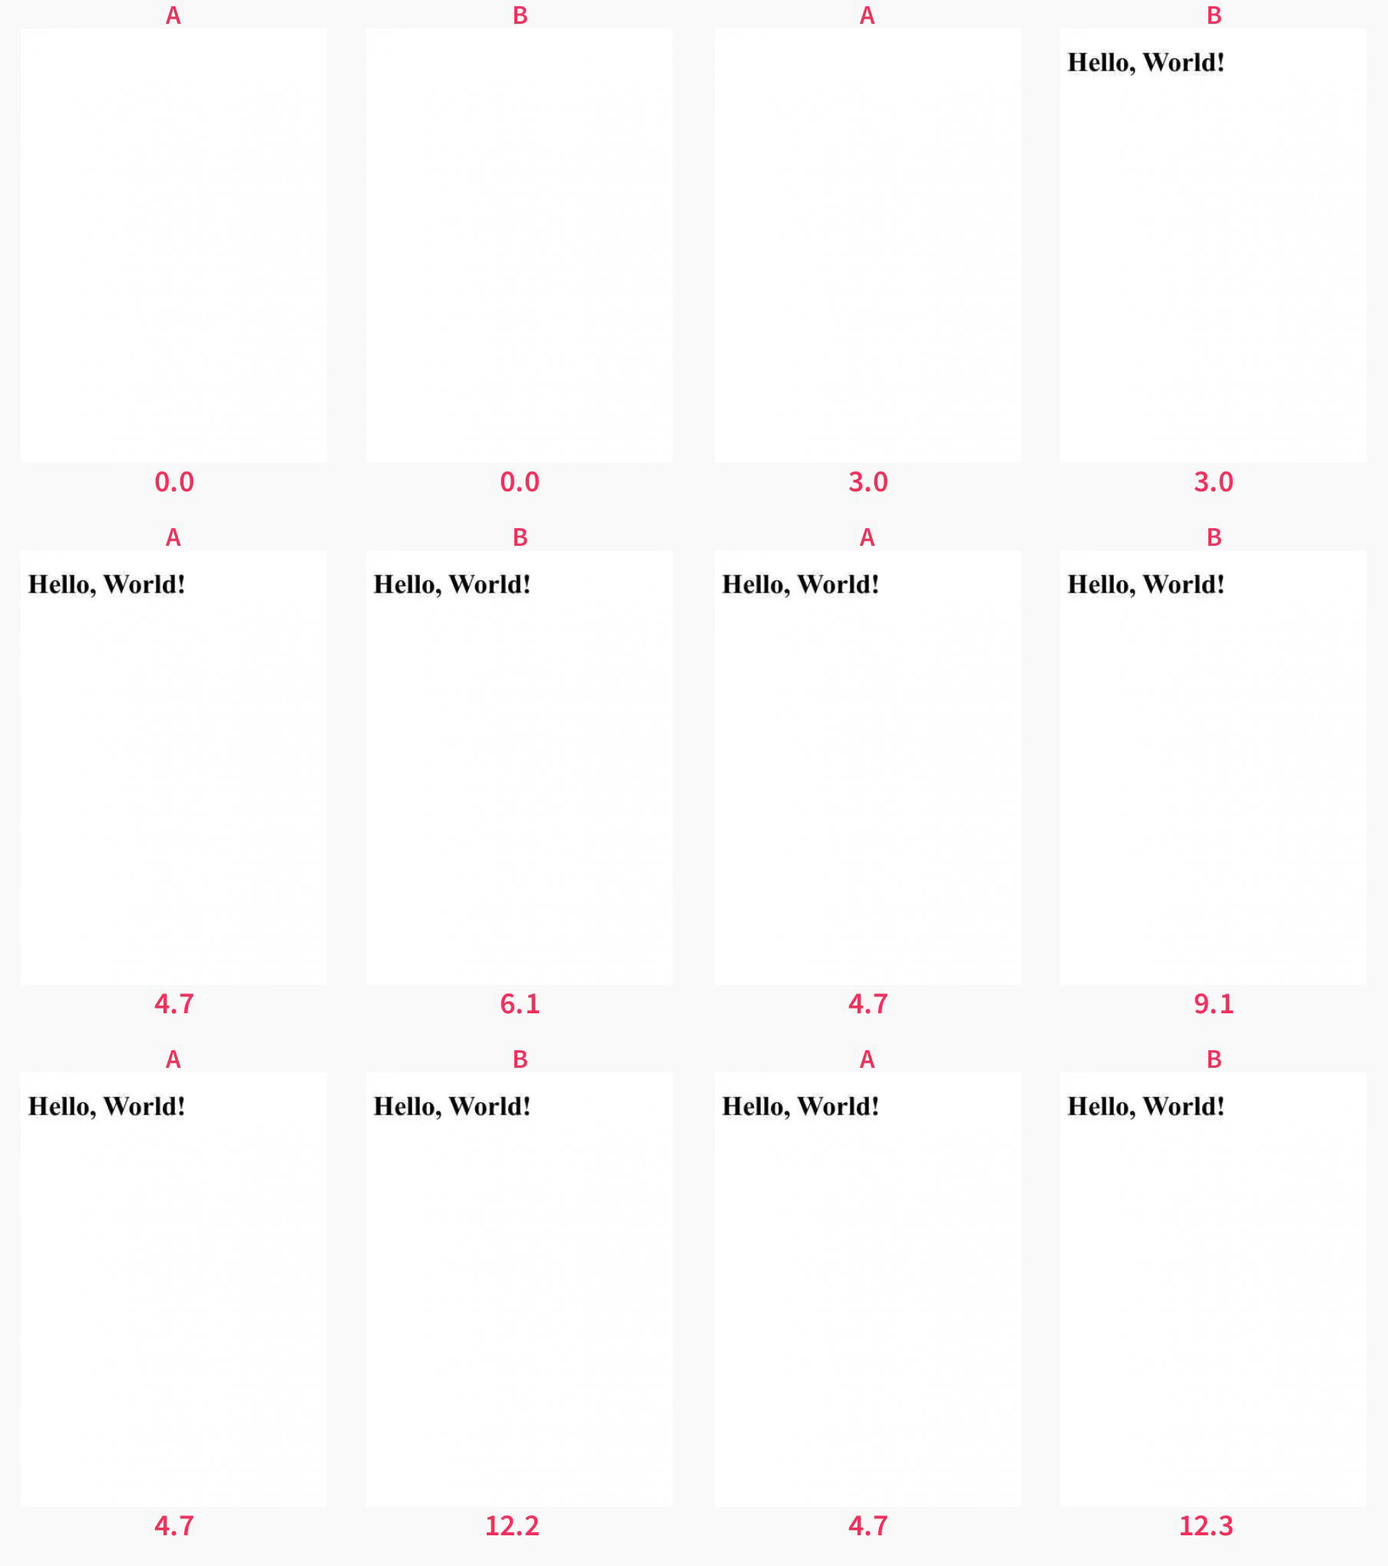
In the comparison above, which do you think provides the better user experience?
I’m willing to bet you’d all say B, right? But, based on DOMContentLoaded,
A is actually over 11s faster!
Load and DOMContentLoaded are internal browser events—your users have no
idea what a Load time even is. I bet half of your colleagues don’t either. As
metrics themselves, they have little to no reflection on the real user
experience, which is exactly why we’ve moved away from them in the first
place—they’re a poor proxy for UX as they’re not emitted when anything useful to
the user happens.
Or are they…?
Not all metrics need to be user-centric. I’m willing to bet you still monitor TTFB, even though you know your customers will have no concept of a first byte whatsoever. This is because some metrics are still useful to developers. TTFB is a good measure of your server response times and general back-end health, and issues here may have knock-on effects later down the line (namely with Largest Contentful Paint).
Equally, both DOMContentLoaded and Load aren’t just meaningless browser
events, and once you understand what they actually signify, you can get some
real insights as to your site’s runtime behaviour from each of them. Diagnostic
metrics such as these can highlight bottlenecks, and how they might ultimately
impact the user experience in other ways, even if not directly.
This is particularly true in the case of DOMContentLoaded.
The DOMContentLoaded
event
fires once all of your deferred JavaScript has finished running.
Therefore, anyone leaning heavily on defer—or frameworks that utilise
it—should immediately see the significance of this metric.
If you aren’t (able to) monitoring custom metrics around your application’s
interactivity, hydration state, etc., then DOMContentLoaded immediately
becomes a very useful proxy. Knowing when your main bundles have run is great
insight in lieu of more forensic runtime data, and it’s something I look at with
any client that leans heavily on (frameworks that lean heavily on) defer or
type=module.
More accurately, DOMContentLoaded signifies that all blocking and
defer and type=module code has finished running. We don’t have any
visibility on whether it ran successfully but it has at least finished.
I’m working with a client at the moment who is using Nuxt
and has their client-side JavaScript split into an eyewatering 121 deferred
files:

Above, the vertical pink line at 12.201s signifies the DOMContentLoaded event.
That’s late! This client doesn’t have any RUM or custom monitoring in place (yet), so, other than Core Web Vitals, we don’t have much
visibility on how the site performs in the wild. Based on a 12s
DOMContentLoaded event, I can’t imagine it’s doing so well.
The problem with Core Web Vitals, though, is that its only real JavaScripty
metric, First Input Delay, only deals with user
interaction: what I would like to know is with 121
Based on the lab-based 12s
above, I would love to know what’s happening for real users. And luckily, while
deferred files, when is
there something to actually interact with?!DOMContentLoaded is now considered a legacy metric, we can still get field
data for it from two pretty decent sources…

CrUX Dashboard is one of
very few CrUX resources that surfaces
the DOMContentLoaded event to us. Above, we can see that, currently, only 11%
of Chrome visitors experience a Good DOMContentLoaded—almost 90% of people
are waiting over 1.5s before the app’s key functionality is available, with
almost half waiting over 3.5s!

DOMContentLoaded was 4.7s for 75% of Chrome visitors
in May 2023.It would also seem that Treo (which is a truly amazing tool)
surfaces DOMContentLoaded data for a given
origin.
Until, well,
today, Google
Analytics also surfaced DOMContentLoaded information. Only this time, we
aren’t limited to just Chrome visits! That said, we aren’t presented with
particularly granular data, either:
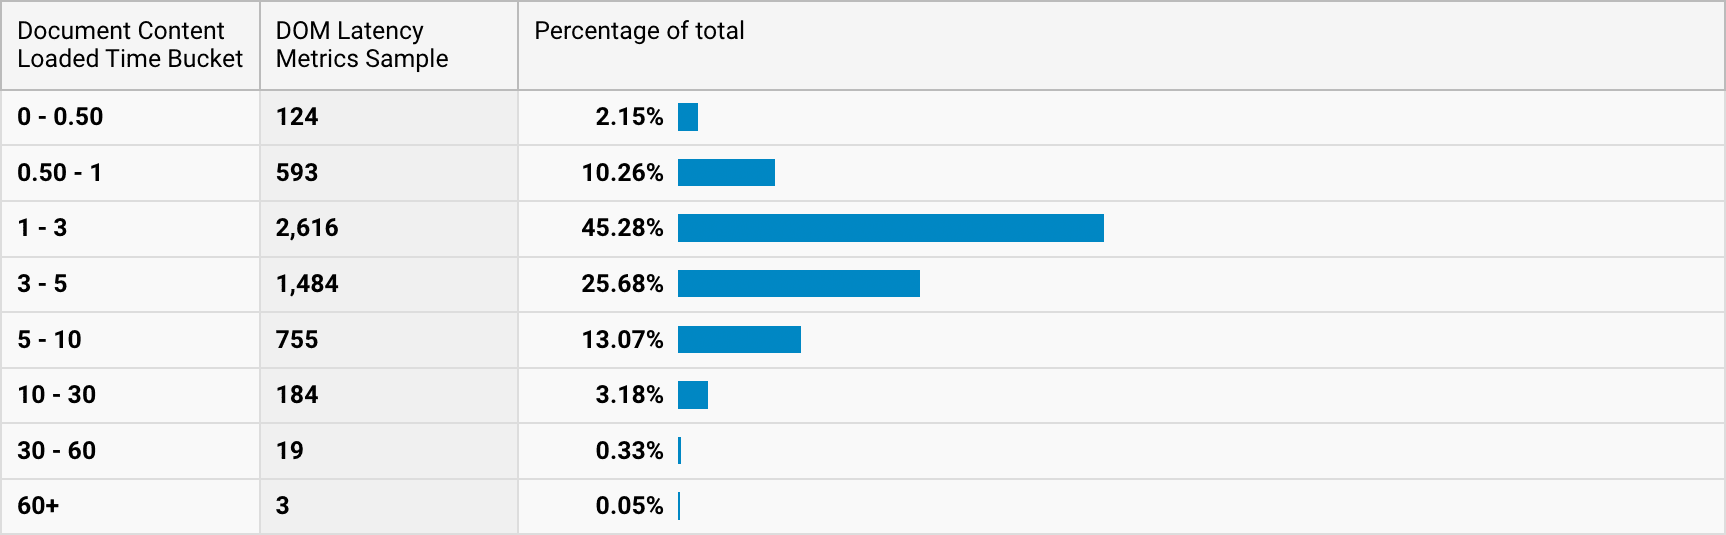
After a bit of adding up (2.15 + 10.26 + 45.28 + 25.68 + 13.07
= 96.44), we see that the 95th percentile of DOMContentLoaded
events for the same time period (May 2023) is somewhere between five and 10
seconds. Not massively helpful, but an insight nonetheless, and at least shows
us that the lab-based 12s is unlikely to be felt by anyone other than extreme
outliers in the field.
Takeaways here are:
DOMContentLoaded. All deferred JavaScript has run within 1.5s for only
the vast minority of visitors.DOMContentLoaded. This is a 10
second wait for key deferred JavaScript to run.Given that the DOMContentLoaded event fires after the last of our
deferred files has run, there’s every possibility that key functionality from
any preceding files has already become available, but that’s not something we
have any visibility over without looking into custom monitoring, which is
exactly the situation we’re in here. Remember, this is still a proxy metric—just
a much more useful one than you may have realised.
If we want to capture this data more deliberately ourselves, we need to lean on the Navigation Timing API, which gives us access to a suite of milestone timings, many of which you may have heard of before.
The DOMContentLoaded as measured and emitted by the Navigation Timing API is
actually referred to as domContentLoadedEventStart—there is no bare
domContentLoadedEvent in that spec. Instead, we have:
domContentLoadedEventStart: This is the one we’re interested in, and is
equivalent to the concept we’ve been discussing in this article so far. To
get the metric we’ve been referring to as DOMContentLoaded, you need
window.performance.timing.domContentLoadedEventStart.
deferred JS is guaranteed to run after synchronous JS, this event
also marks the point that all synchronous work is complete.domContentLoadedEventEnd: The end event captures the time at which all
JS wrapped in a DOMContentLoaded event listener has finished running:
window.addEventListener('DOMContentLoaded', (event) => {
  // Do something
});
deferred JavaScript and runs after our
DOMContentLoaded event—if we are running a nontrivial amount of code at
DOMContentLoaded, we’re also interested in this milestone. That’s not in
the scope of this article, though, so we probably won’t come back to that
again.Very, very crudely, with no syntactic sugar whatsoever, you can get the page’s
DOMContentLoaded event in milliseconds with the following:
console.log(window.performance.timing.domContentLoadedEventStart - window.performance.timing.navigationStart);
…and the duration (if any) of the DOMContentLoaded event with:
window.performance.timing.domContentLoadedEventEnd - window.performance.timing.domContentLoadedEventStart
And of course, we should be very used to seeing DOMContentLoaded at the bottom
of DevTools’ Network panel:

While DOMContentLoaded tells us when our deferred code finished
running—which is great!—it doesn’t tell us how long it took to run. We might
have a DOMContentLoaded at 5s, but did the code start running at 4.8s? 2s? Who
knows?!
We do.

In the above waterfall, which is the same one from earlier, only even shorter,
we still have the vertical pink line around 12s, which is DOMContentLoaded,
but we also have a vertical sort-of yellow line around 3.5s (actually, it’s at
3.52s exactly). This is domInteractive. domInteractive is the event
immediately before domContentLoadedEventStart. This is the moment the browser
has finished parsing all synchronous DOM work: your HTML and all blocking
scripts it encountered on the way. Basically, the browser is now at the
</html> tag. The browser is ready to run your deferred JavaScript.
One very important thing to note is that the domInteractive event fired long,
long before the request for file 133 was even dispatched. Immediately this tells
us that the delta between domInteractive and DOMContentLoaded includes code
execution and any remaining fetch.
Thankfully, the browser wasn’t just idling in this time. Because deferred code
runs in sequence, the browser sensibly fetches the files in order and
immediately executes them when they arrive. This level of orchestration is very
elegant and helps to utilise and conserve resources in the most helpful way. Not
flooding the network with responses that can’t yet be used, and also making sure
that the main thread is kept busy.
This is the JavaScript we need to measure how long our deferred activity took:
console.log(window.performance.timing.domContentLoadedEventStart - window.performance.timing.domInteractive);
Now, using the Navigation Timing API, we have visibility on when our deferred
finished running, and how long it took!
This demo below contains:
deferred JavaScript file.DOMContentLoaded.Load event.<!-- [1] -->
<script src=https://slowfil.es/file?type=js&delay=2000 defer></script>
<!-- [2] -->
<script>
window.addEventListener('DOMContentLoaded', (event) => {
// Hang the browser for 1s at the `DOMContentLoaded` event.
function wait(ms) {
var start = Date.now(),
now = start;
while (now - start < ms) {
now = Date.now();
}
}
wait(1000);
});
</script>
<!-- [3] -->
<script>
window.addEventListener('load', (event) => {
const timings = window.performance.timing;
const start = timings.navigationStart;
console.log('Ready to start running `defer`ed code: ' + (timings.domInteractive - start + 'ms'));
console.log('`defer`ed code finished: ' + (timings.domContentLoadedEventEnd - start + 'ms'));
console.log('`defer`ed code duration: ' + (timings.domContentLoadedEventStart - timings.domInteractive + 'ms'));
console.log('`DOMContentLoaded`-wrapped code duration: ' + (timings.domContentLoadedEventEnd - timings.domContentLoadedEventStart + 'ms'));
});
</script>
</body>
</html>
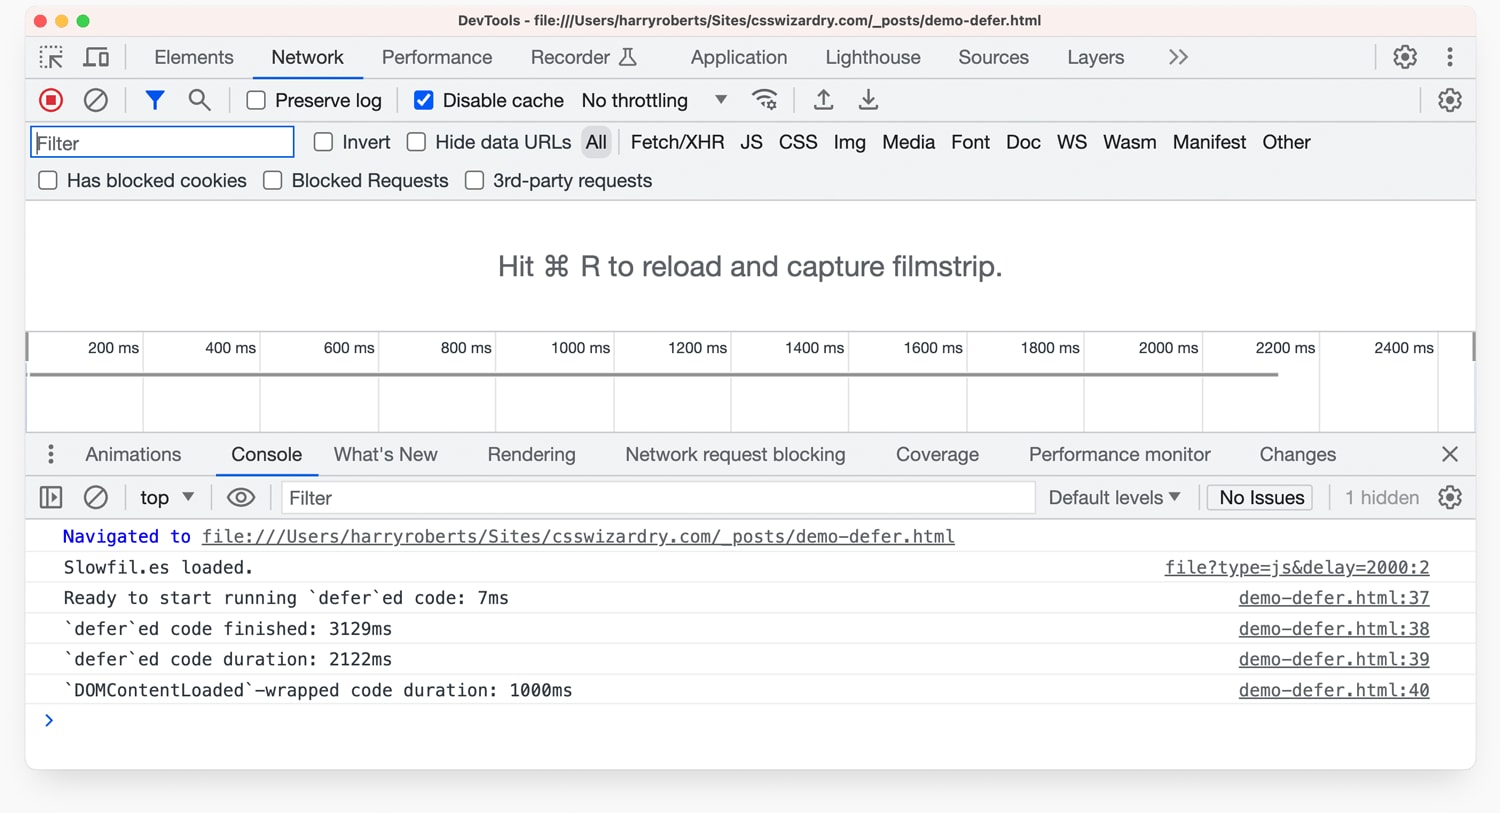
`defer`ed code finished: 3129msDOMContentLoaded.Or take a look at the live demo on Glitch.
Need Some Help?
I help companies find and fix site-speed issues. Performance audits, training, consultancy, and more.
This is all genuinely exciting and interesting to me, but we’re running into issues already:
DOMContentLoaded is a proxy for when all your deferred JavaScript has run,
but it doesn’t notify you if things ran successfully, or highlight any key
milestones as functionality is constantly becoming available for the duration.DOMContentLoaded tells us how long everything took, but that could include
fetch, and there’s no way of isolating the fetch from pure runtime.I want to expand on the last point.
If we’re going to go to the effort of measuring Navigation Timing events, we
might as well use the much more useful User Timing
API.
With this, we can emit high-resolution timestamps at arbitrary points in our
application’s lifecycle, so instead of proxying availability via a Navigation
Timing, we can drop, for example, performance.mark('app booted') in our code.
In fact, this is what Next.js
does
to let you know when the app has hydrated, and how long it took. These User
Timings automatically appear in the Performance panel:

I use performance.mark() and performance.measure() in a few places on this
site,
chiefly to monitor how long it takes to parse the <head> and its CSS.
The User Timing API is far more suited to this kind of monitoring than something
like DOMContentLoaded—I would only look at DOMContentLoaded if we don’t yet
have appropriate metrics in place.
Still, the key and most interesting takeaway for me is that if all we have
access to is DOMContentLoaded (or we aren’t already using something more
suitable), then we do actually have some visibility on app state and
availability. If you are using defer or type=module, then DOMContentLoaded
might be more useful to you than you realise.
I mentioned previously that the DOMContentLoaded event fires once all
deferred JavaScript has run, which means that we could potentially be
trickling functionality throughout the entire time between domInteractive and
DOMContentLoaded.
In my client’s case, however, the site is completely nonfunctional until the
very last file (response 133 in the waterfall) has successfully executed. In
fact, blocking the request for file 133 has the exact same effect as disabling
JavaScript entirely. This means the DOMContentLoaded event for them is an
almost exact measure of when the app is available. This means that tracking
and improving DOMContentLoaded will have a direct correlation to an improved
customer experience.
DOMContentLoadedGiven that DOMContentLoaded marks the point at which all synchronous HTML and
JavaScript has been dealt with, and all deferred JavaScript has been fetched
and run, this leaves us many different opportunities to improve the metric: we
could reduce the size of our HTML, we could remove or reduce expensive
synchronous JavaScript, we could inline small scripts to remove any network
cost, and we can reduce the amount of deferred JavaScript.
Further, as DOMContentLoaded is a milestone timing, any time we can shave from
preceding timings should be realised later on. For example, all things being
equal, a 500ms improvement in TTFB will yield a 500ms improvement in subsequent
milestones, such as First Contentful Paint or, in our case, DOMContentLoaded.
However, in our case, the delta between domInteractive and
DOMContentLoaded was 8.681s, or about 70%. And while their TTFB certainly does
need improvement, I don’t think it would be the most effective place to spend
time while tackling this particular problem.
Almost all of that 8.7s was lost to queuing and fetching that sheer number of bundles. Not necessarily the size of the bundles—just the sheer quantity of files that need scheduling, and which each carry their own latency cost.
While we haven’t worked out the sweet spot for this project, as a rule, a smaller number of larger bundles would usually download much faster than many tiny ones:
As a rule, RTT (α) stays constant while download time (𝑥) is proportional to filesize. Therefore, splitting one large bundle into 16 smaller ones goes from 1α + 𝑥 to 16α + 16(0.0625𝑥). Expect things to probably get a little slower. pic.twitter.com/c0hEsIAwKq
— Harry Roberts (@csswizardry) 21 January, 2021
My advice in this case is to tweak their build to output maybe 8–10 bundles and re-test from there. It’s important to balance bundle size, number of bundles, and caching strategies, but it’s clear to me that the issue here is overzealous code-splitting.
With that done, we should be able to improve DOMContentLoaded, thus having
a noticeable impact on functionality and therefore customer experience.
DOMContentLoaded has proved to be a very, very useful metric for us.
DOMContentLoaded is an internal browser event that fires once all deferred JavaScript has finished running.
From a user experience perspective, DOMContentLoaded isn’t a great metric to benchmark yourself on. However, from a diagnostic point of view, it can be helpful in determining when your JavaScript has finished executing.
此内容由惯性聚合(RSS阅读器)自动聚合整理,仅供阅读参考。 原文来自 — 版权归原作者所有。