







Building a product is hard. Very hard. And it would be a shame if it didn't take off because your users can’t seem to use it properly.
But how can you know this and ultimately change it? This is where product analytics tools come in handy. It lets you know everything about what’s happening between the user and the product.
Product analytics is a collection of valuable insights that help you understand how consumers use your product or service.
In this article, we’ll dive deep into product analytics for your business and touch upon how you can use Simple Analytics to ensure you get the right insights.
- What is product analytics?
- Uses of product analytics tools
- Understand product usage
- Understand feature adoption
- Understand drop-offs
- Visualize user journey
- What’s product analytics tools do you need?
- Using Simple Analytics as a minimal product analytics tool
- Track signups
- Track traffic on various pages
- Track user movement
- Track feature implementation success
- Track upgrade flow
- Do anything
- Conclusion
Michelin chose Simple AnalyticsJoin them
What is product analytics?
Product analytics is the process of collecting, analyzing, and interpreting data related to a product's usage. A product analytics tool is a specialized tool that helps you collect and visualize this product usage data.
A product analytics tool helps you understand user behavior, feature adoption, and more product-related info.
Let’s clarify: Assume you pushed a new feature in your SaaS. Now you want to know whether people use it or not (and how they use it). General web analytics won’t be able to answer this correctly. These are meant for a completely different use case and lack the needed features. For situations like these, you’d need a product analytics tool.
The concept of product analytics is huge. There is so much to track and so many use cases that we’d never be able to fit into one blog. Hence, we’ll touch upon the most important offerings and key use cases, which we’ll discuss with examples.
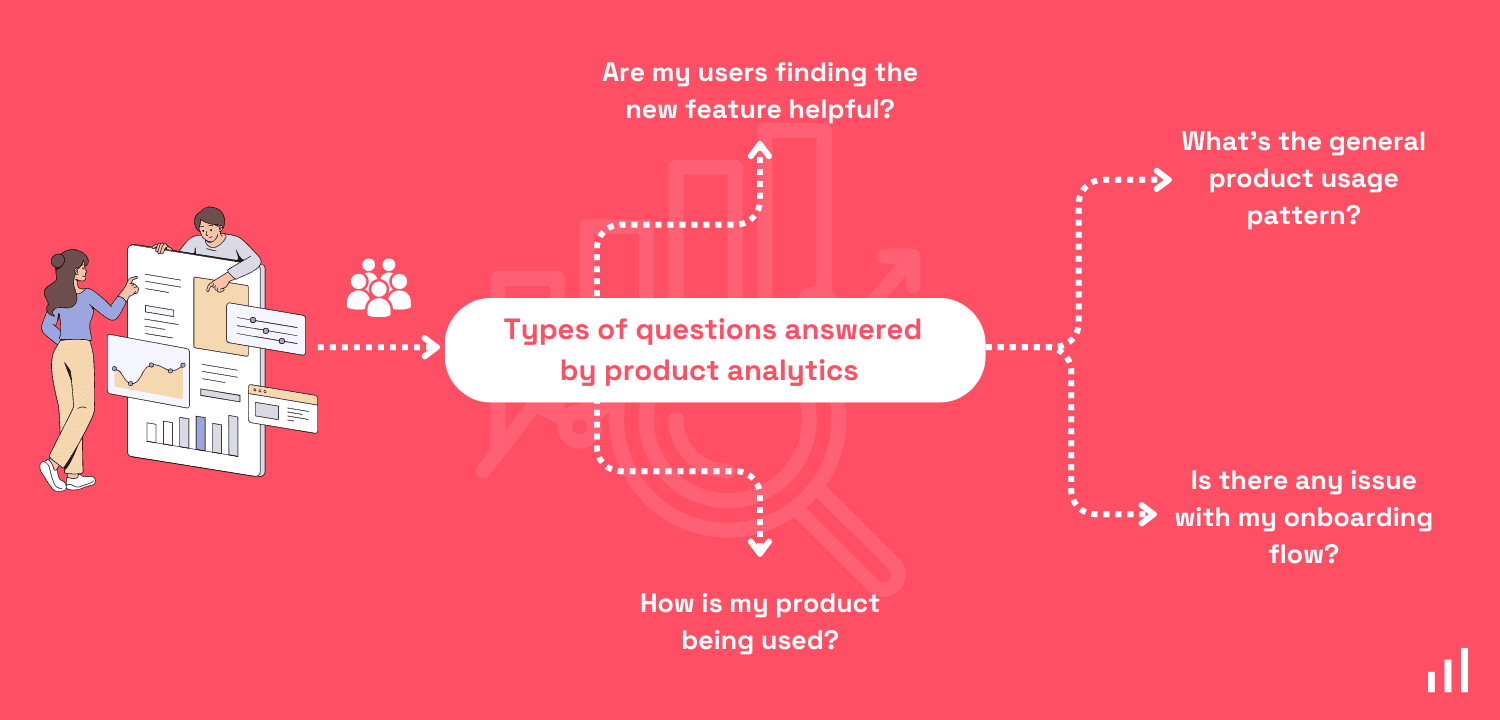
Understand product usage
If you want to build a successful SaaS, staying close to your users and understanding their needs is important. This can be achieved by eagerly listening to their feedback and analyzing how they use your product.
Listening to user feedback can be easily done by staying active on socials and using feedback widgets. However, analyzing product usage can only be done by seeing how they navigate through your product when they use it. This is only possible using a product analytics tool.
Understand feature adoption
Sometimes, founders just go into the rabbit hole of feature development. Having more features is good, but only when most of your users find it useful; otherwise, it would become a messy dashboard and waste your efforts.
Having a product analytics tool in place ensures that you collect all the data you’ll need to understand if most of your users are using all the features you’ve shipped. Based on this information, you can understand what features matter most to your users and which features will be well-received in the future.
Understand drop-offs
If you run SaaS with an onboarding flow, you’ll know that users tend to drop off after every step. There is a high chance that you have users who signed up for your product but never upgraded. They dropped off along the way from free to paid users. It is important to find the answer as to why and at what stage they drop off. A product analytics tool can help you understand this and give you insights you need to act accordingly and reduce drop-offs.
Visualize user journey
It’s also important to understand a user journey inside your app too; this helps you understand how your users have been using your app. This data is essential in improving the onboarding flow for new users and the overall UX for everyone.
There are many types of product analytics tools, some being very complex such as Amplitude, and others being easy-to-use, such as Simple Analytics. Both have their benefits, but we’ll discuss why a minimal product analytics tool like Simple Analytics makes more sense if you want the basic insights you need to run your business.
Easy to implement: The best part about implementing minimal product analytics tools inside your product is that these tools are built with minimalism in mind. Even a non-coder can easily implement it, which is especially helpful for no-code and non-technical SaaS founders. Complex product analytics tools require a bit of coding knowledge for successful implementation.
Simple UI: With Simple Analytics, you get a tool that is easy to understand and use because of the well-thought-out UI. Need a quick look? Here’s a link to the live analytics dashboard – no signup required.
Cost-effective: Product analytics tools, in general, are expensive as most of them are built for enterprise customers or funded startups. Their pricing can range from a few hundred dollars per month to thousands per month, such as Amplitude, whose Growth plan starts at $995/month. The pricing of complex product analytics tools can be out of reach for many businesses, and for them, tools like Simple Analytics are the right choice. It starts at just $9/month when paid annually.
Easy GDPR compliance: One major issue with mainstream product analytics is GDPR; though most claim to be GDPR-compliant, it also boils down to how it’s been implemented inside the product. A wrong configuration can make you non-compliant with GDPR. On the other hand, Simple Analytics is privacy-friendly and GDPR-compliant out of the box.
In most cases, a minimal product analytics will provide you with the insights you need to run your business. We’ll walk you through the most important product analytics use cases using Simple Analytics.
Track signups
Having info about user signups is important when it comes to product analytics. It helps you get an idea of whether your marketing efforts are working. You can also track signups attribution to see which channels perform best to attract users.
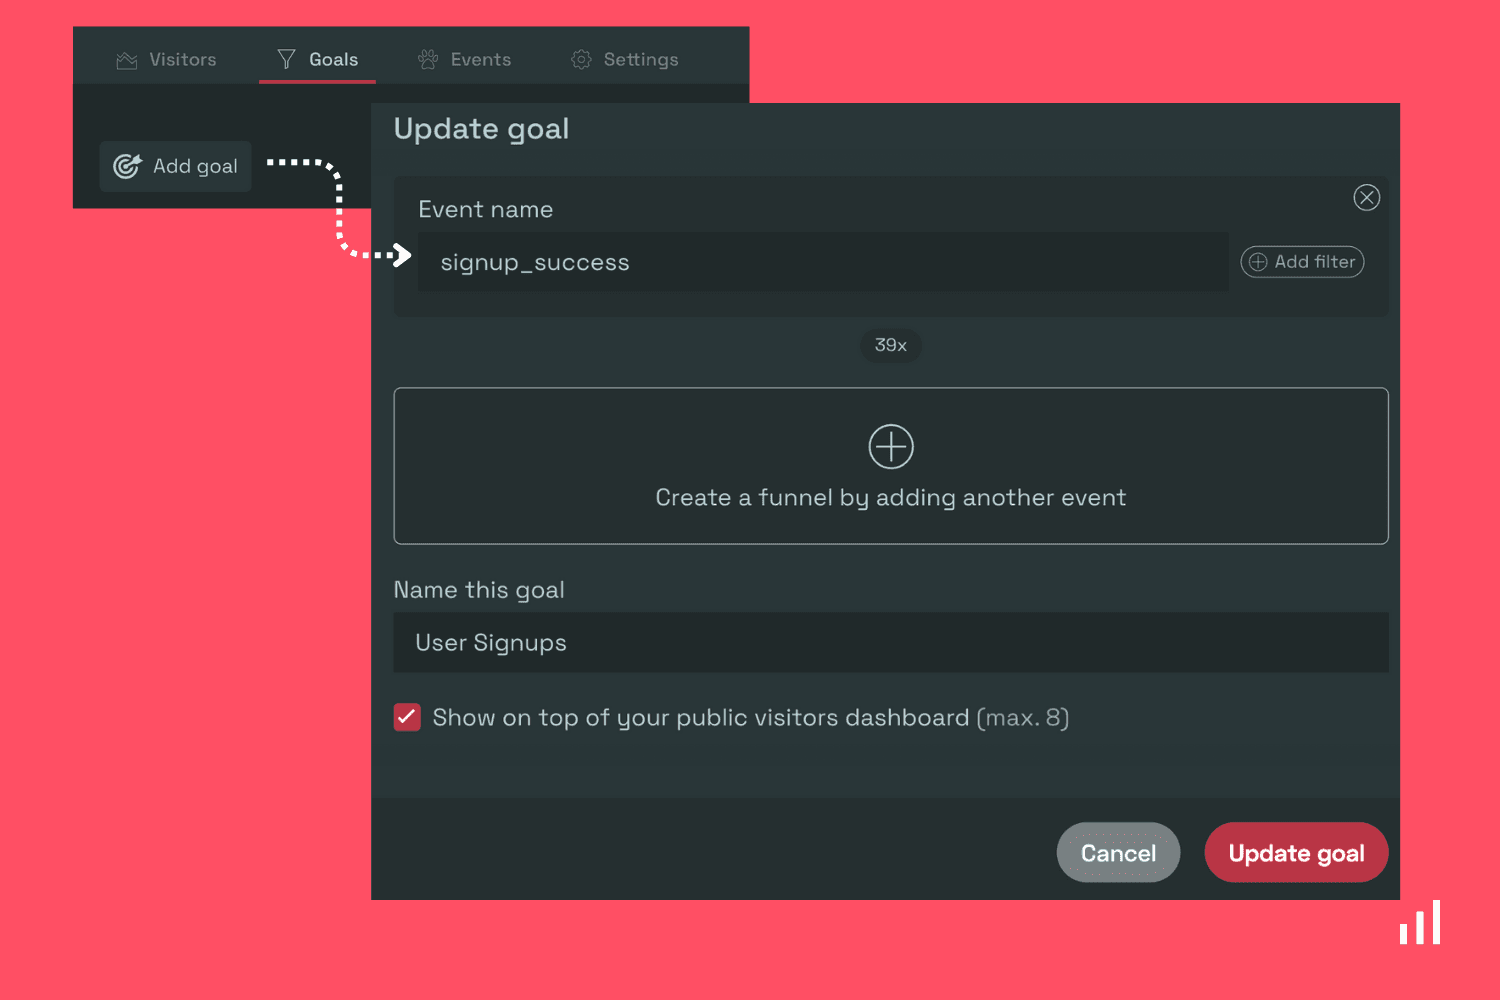
To implement this, you’ll have to use the events feature and fire an event every time a new user sign’s up. When the event is installed, you can create a “Goal” to track it over time.
Setting up Goals is easy. The image below shows how to set it up:
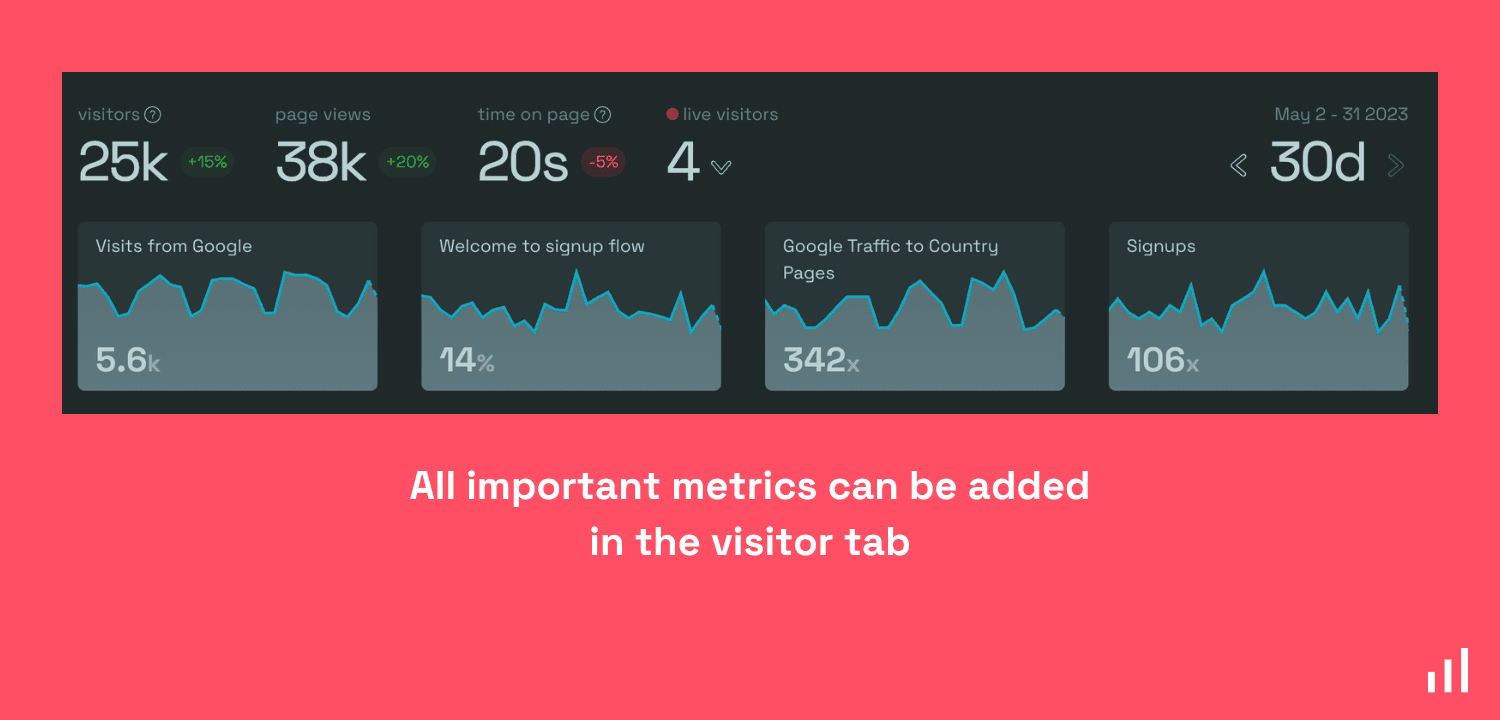
Once done, you can mark it as “important,” meaning this “Goal” will be added to the visitor dashboard.
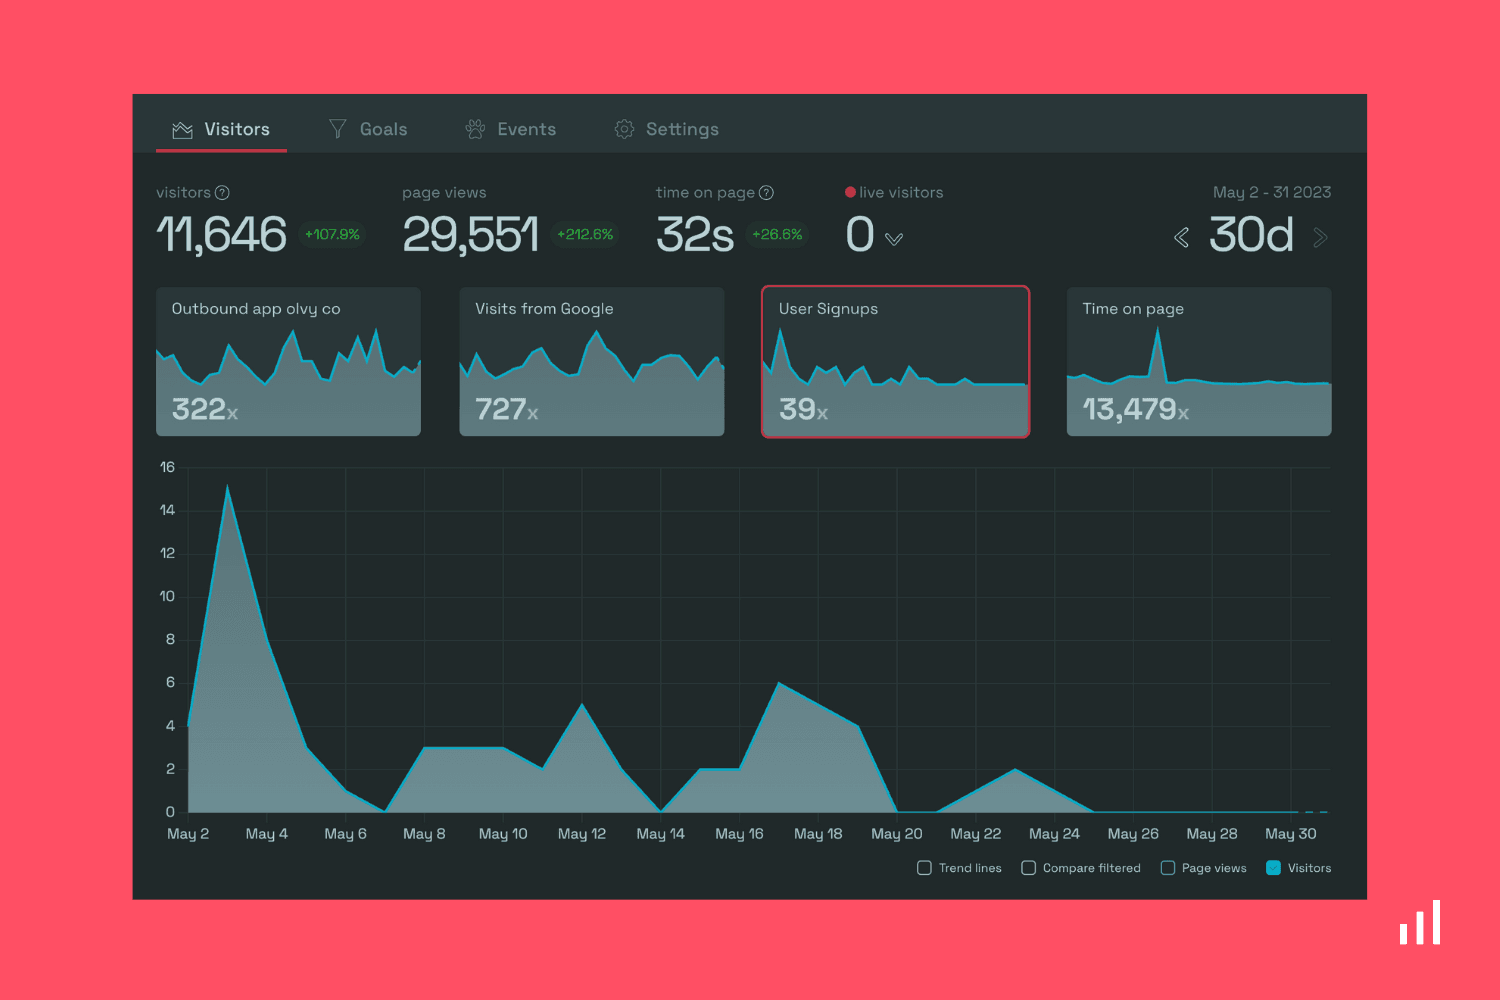
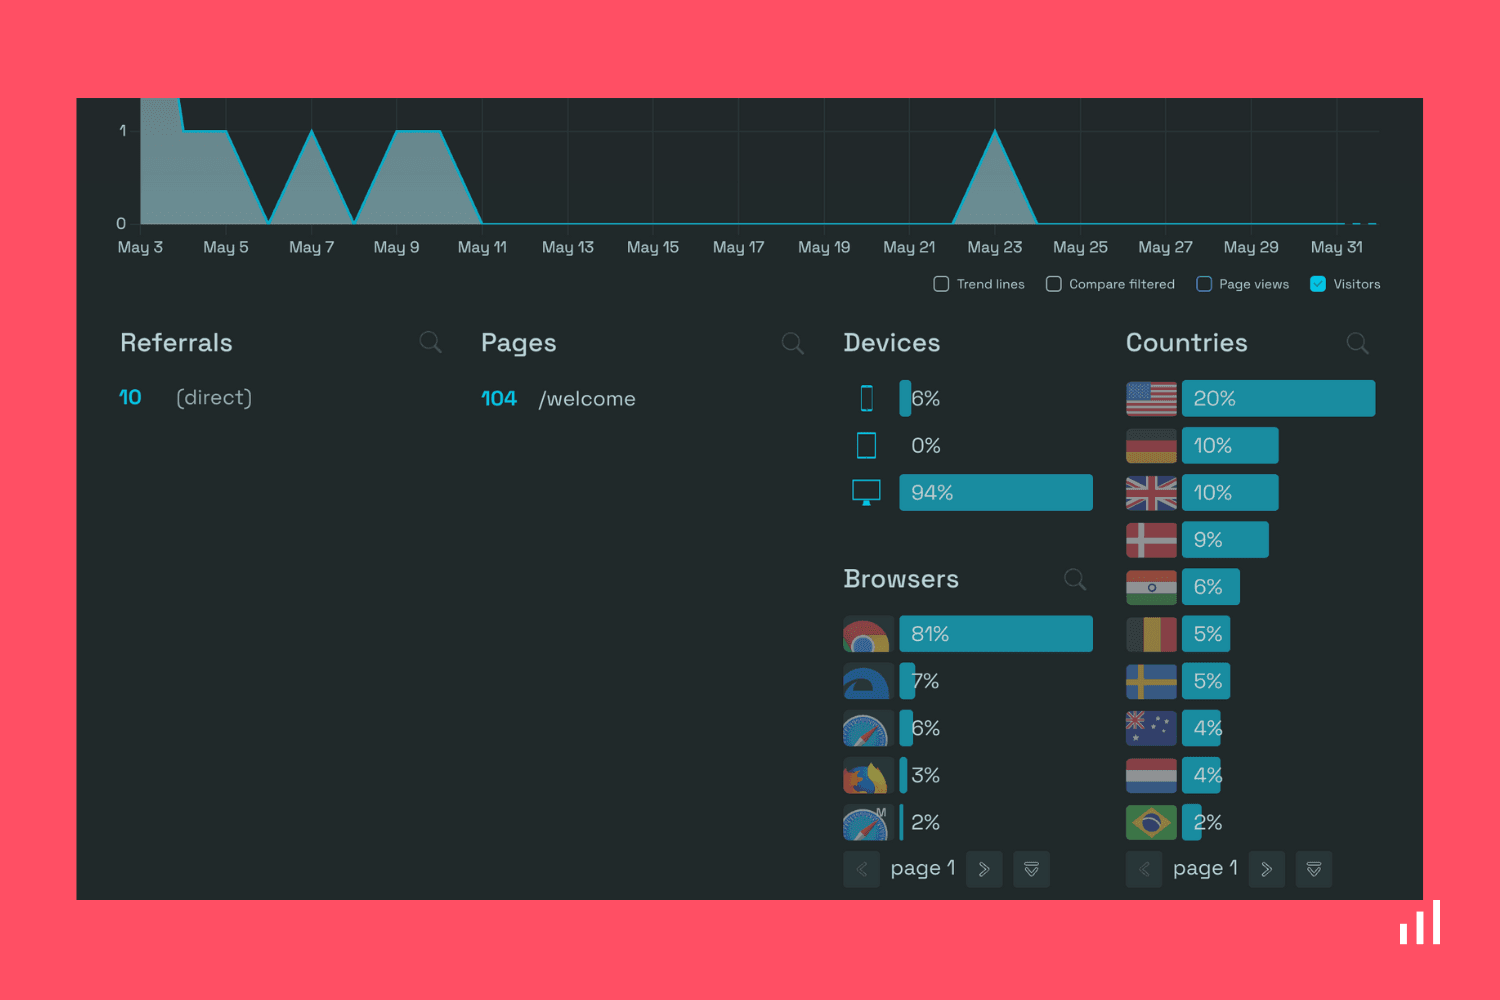
You can keep track of it easily and see key metrics like “referrers,” “browser type,” “country” and whether your sign-ups contain more mobile or desktop users. For example, if you are getting a good amount of traffic from mobile, then ensuring that your application is mobile compatible is a good idea.
Track traffic on various pages
Your SaaS application might have various pages related to a different feature or functionality. Tracking these gives you an idea of the most visited pages. You can use this data to decide which pages/features to work on.
Simple Analytics tracks this out of the box once you set it up. Here’s how your app analytics dashboard will look like in Simple Analytics.
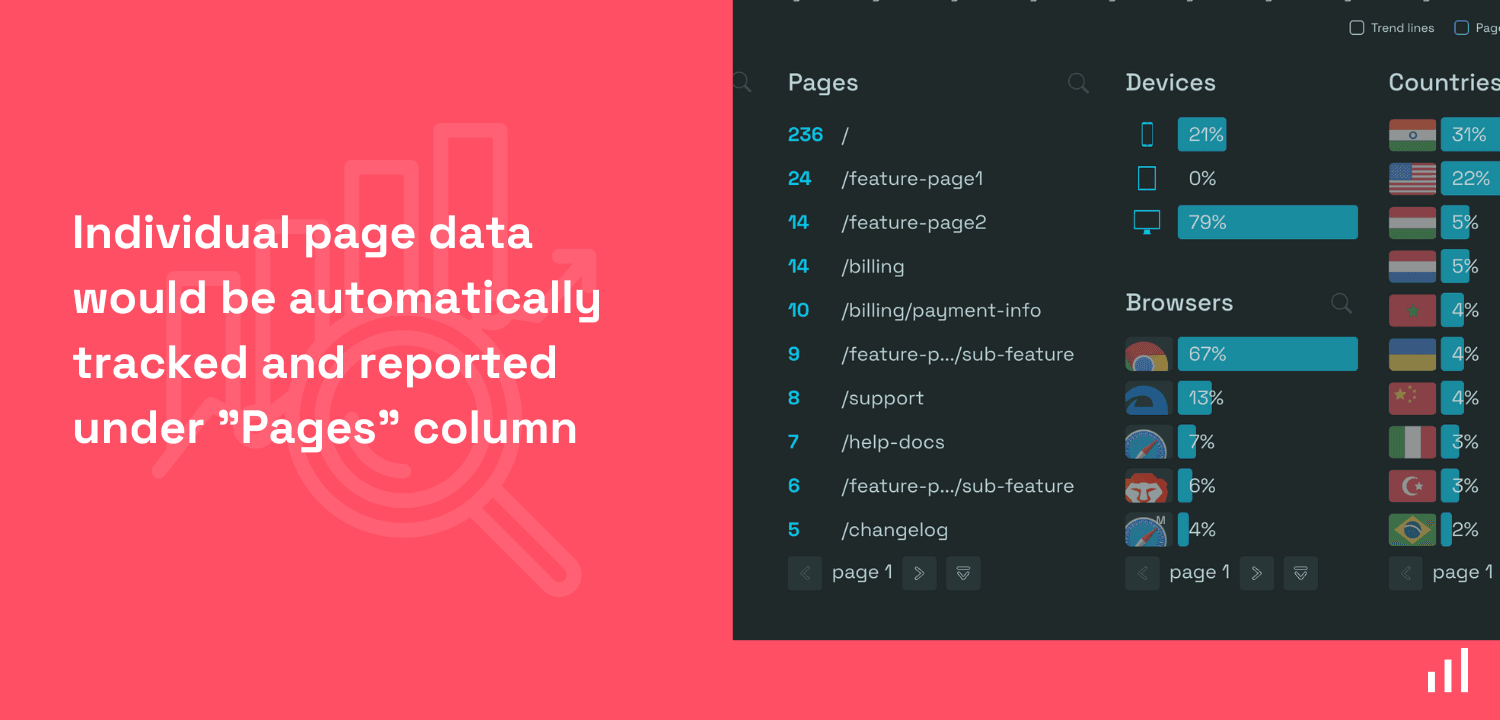
If your dashboard is a SPA and you are wondering whether Simple Analytics would support it or not, then it’s time to smile, as there is native support for SPA.
Track user movement
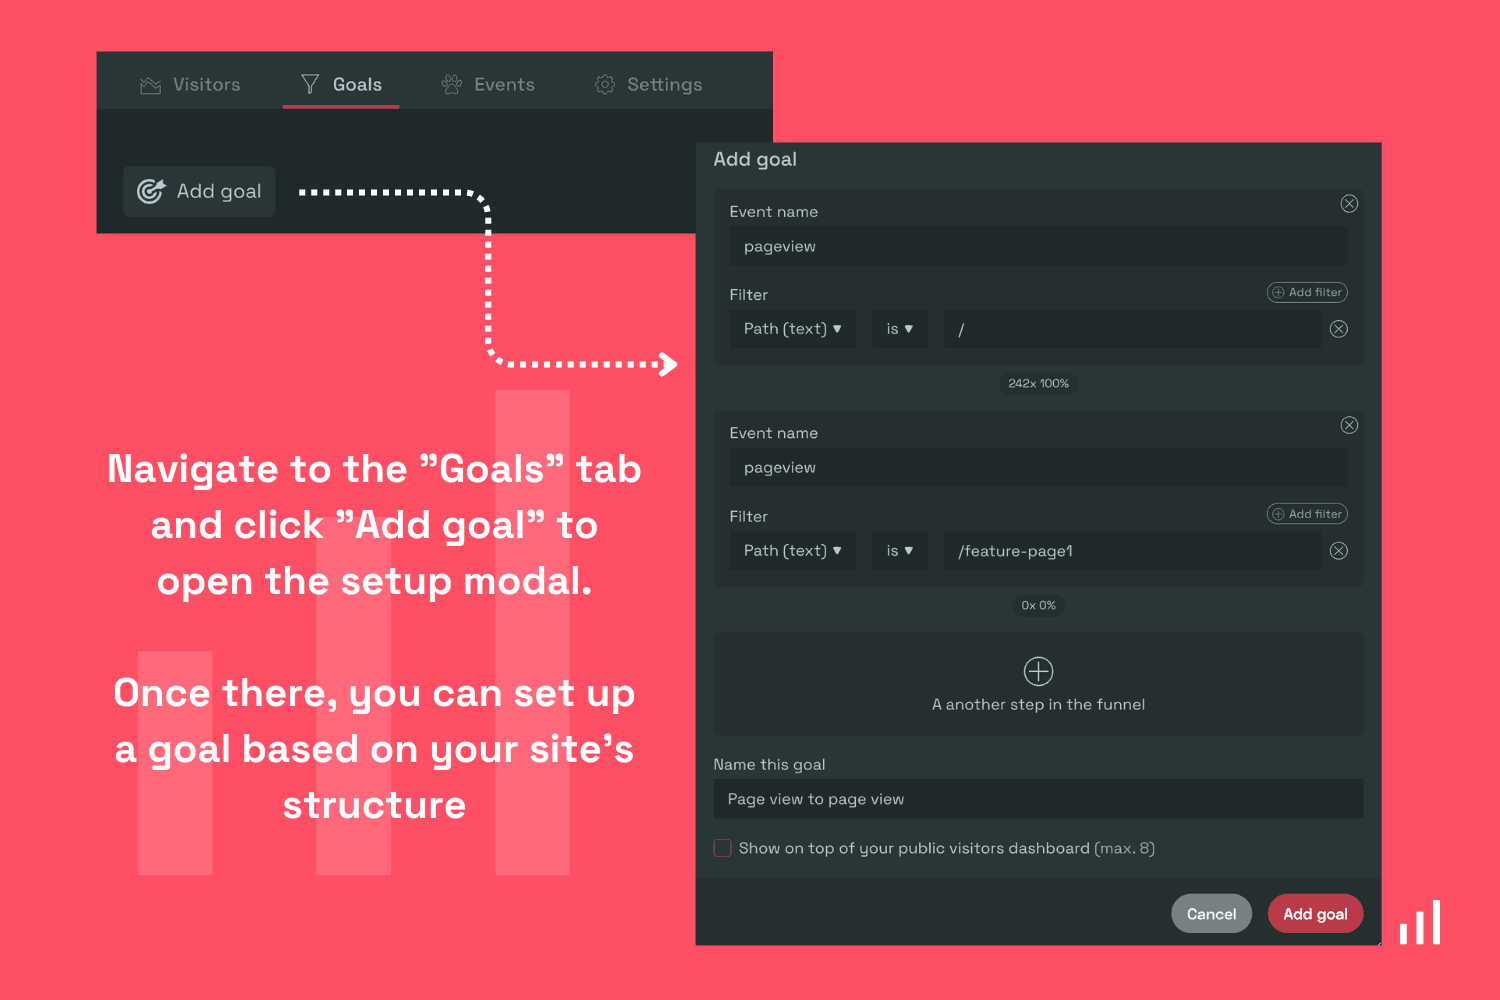
Now, you might have a few set flows that you would like to track. Say the user signing in and then goes to “feature A” or somewhere else. This can be easily tracked using the goal feature.
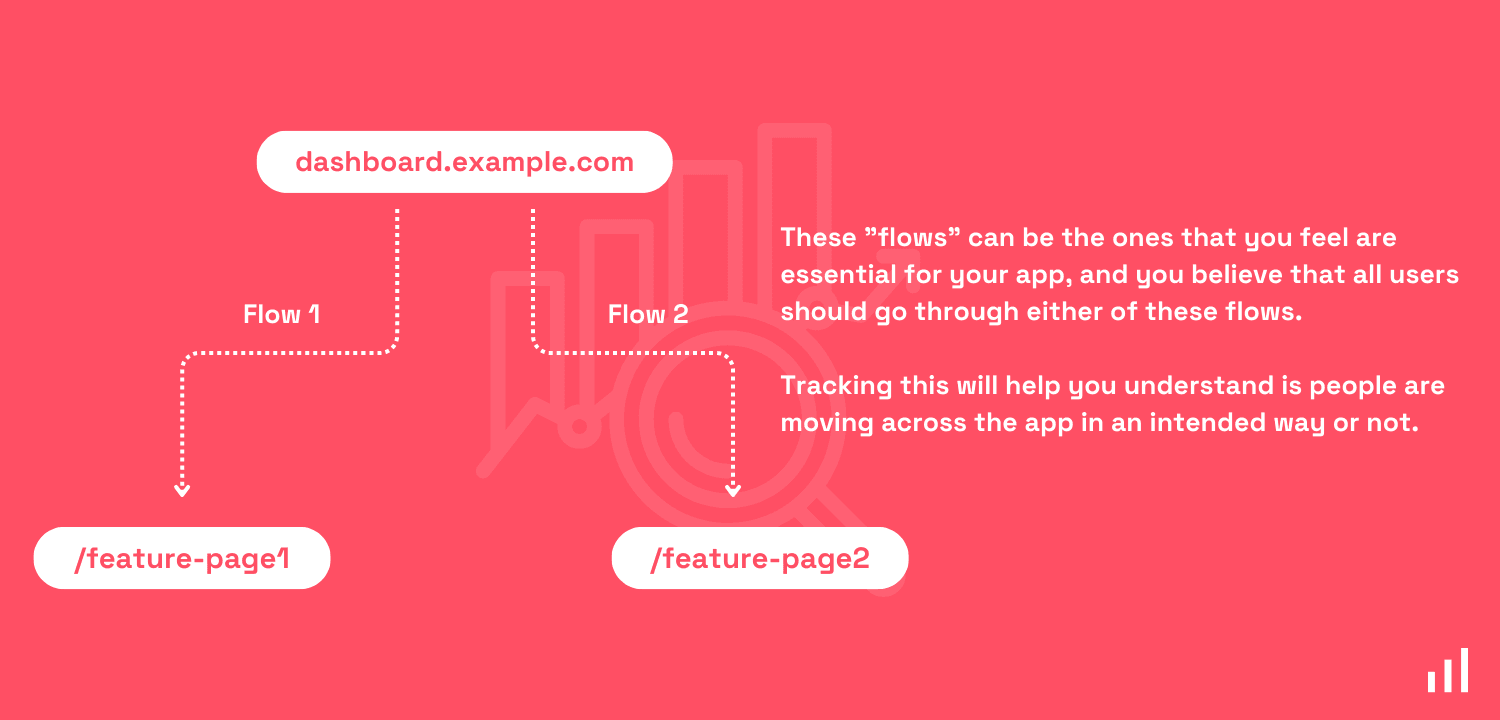
Simply set up the goal as shown below. You’ll see the number of times the user movement flow has been completed. Though the one below has only a single step, you can add as many as you want.
Track feature implementation success
If you have recently implemented a new feature, it’s important to track and see whether your users are actually using it. This can also be easily tracked using the “Goals” feature. For this, you’ll first have to define the user flow and then add it inside goals, just like the below image.
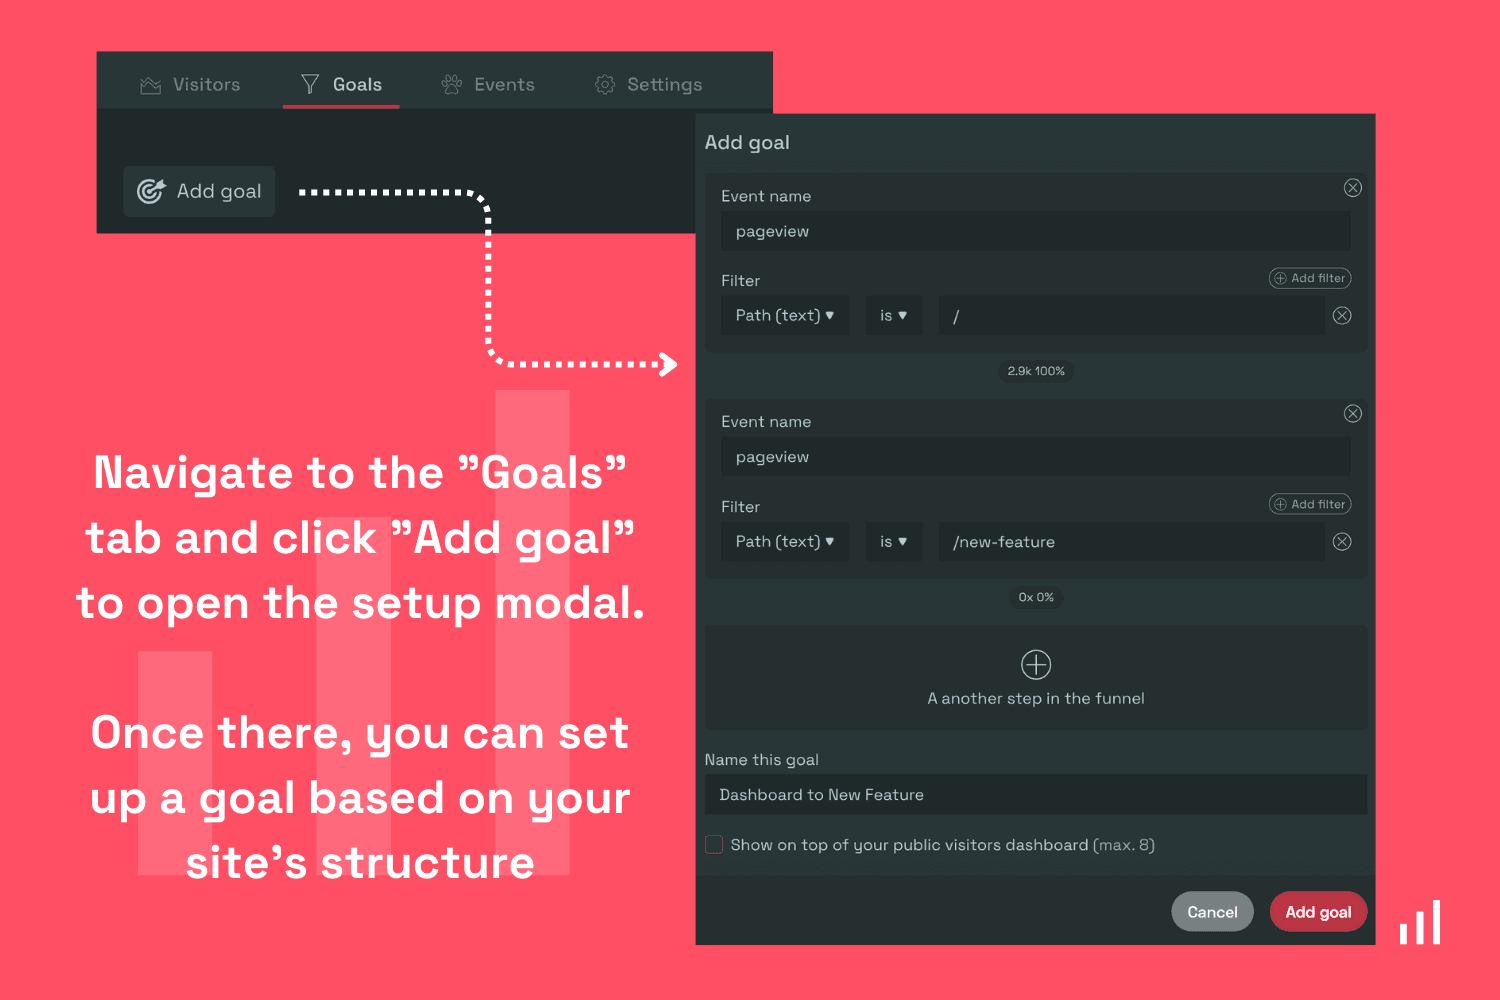
Once done with the setup, here’s what the data would look like inside your Simple Analytics dashboard.
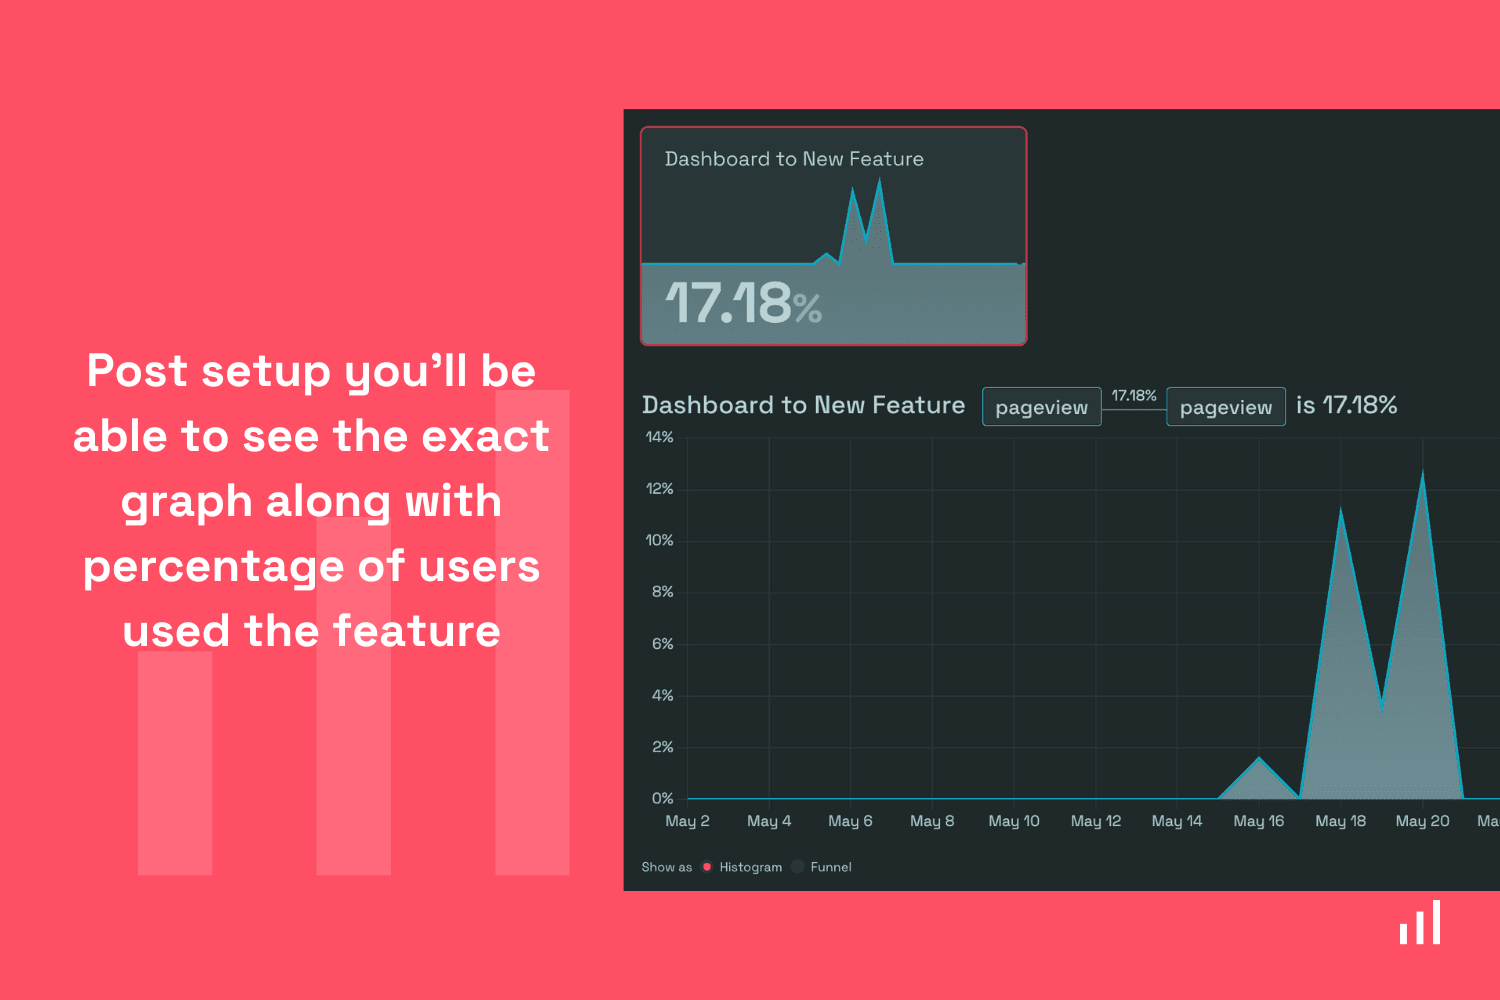
Again this can be added to Simple Analytics’s visitor dashboard for quick access, and it gives you more info like “time on page,” “browser type,” “country,” and whether the user is mobile or desktop.
Track upgrade flow
A full understanding of how many users are upgrading after signing up is important. It helps you understand how well your pricing strategy is and how the users are actually using your product.
If you already have an onboarding flow, you can use the events function to fire an event at each onboarding step until the final payment page. The same steps can be applied as the ones we outlined for “tracking sign-ups”; you just need to create a different event (user_upgrade) to track this.
Do anything
The best part about using Simple Analytics is that you can track literally anything. From button clicks to form submissions, Simple Analytics has you covered with its custom events feature.
If you’d like to read more and implement Simple Analytics in a way you like, check out the docs, you’ll find everything you need.
Conclusion
Using a product analytics tool is definitely a lifesaver. It can make the difference between a failed or successful product. Understanding your users is the most important part of creating a sustainable business.
When it comes to product analytics tools, there is a lot to choose from. However, we make the case for a minimal product analytics tool. There are some really complex and expensive tools out there, while tools like Simple Analytics only cost a fraction and still give you the insights you need to succeed. It saves a ton of effort and time, so you can focus on what’s actually important, such as building a feature that your users would appreciate.
Next to providing the insights you need without the hassle, we are a privacy-friendly solution that cares about the privacy of your users. We don’t use any trackers or cookies (so there is no need for an annoying cookie banner), and we are 100% GDPR-compliant.
We believe in an independent web that is friendly to website visitors. If this resonates with you, feel free to give us a try