












E-commerce is growing faster than most of us could have imagined. According to a report by Statista, global e-commerce sales amounted to $5.2 trillion (yes, trillion) in the year 2021 and are predicted to grow to $8.1 trillion by 2026. That’s approximately 9.3% YoY growth in the coming years.
This shows that if you are already in the e-commerce business or planning to be, then there’s certainly no lack of buyers in the coming time. This also means that more and more players would be jumping into this, and one of the few things that can keep you ahead in this game is relying on analytics and using it to optimize your e-commerce site.
- Why is analytics important in e-commerce?
- Metrics to track on your e-commerce site
- User movement from landing to the product page
- User movement from the product to the checkout page
- Add metadata to your events
- Track user engagement based on time on page
- Track the effectiveness of email and ads campaigns
- Traffic from socials
- Conclusion
Michelin chose Simple AnalyticsJoin them
Why is analytics important in e-commerce?
So the importance of e-commerce analytics is a big question for many; let’s answer it first.
The primary use of analytics on your e-commerce site is to understand your site's performance and find critical improvement points. E-commerce analytics can help you understand user movements across various stages, drop-offs, interactions with various sections on your website, and much more.
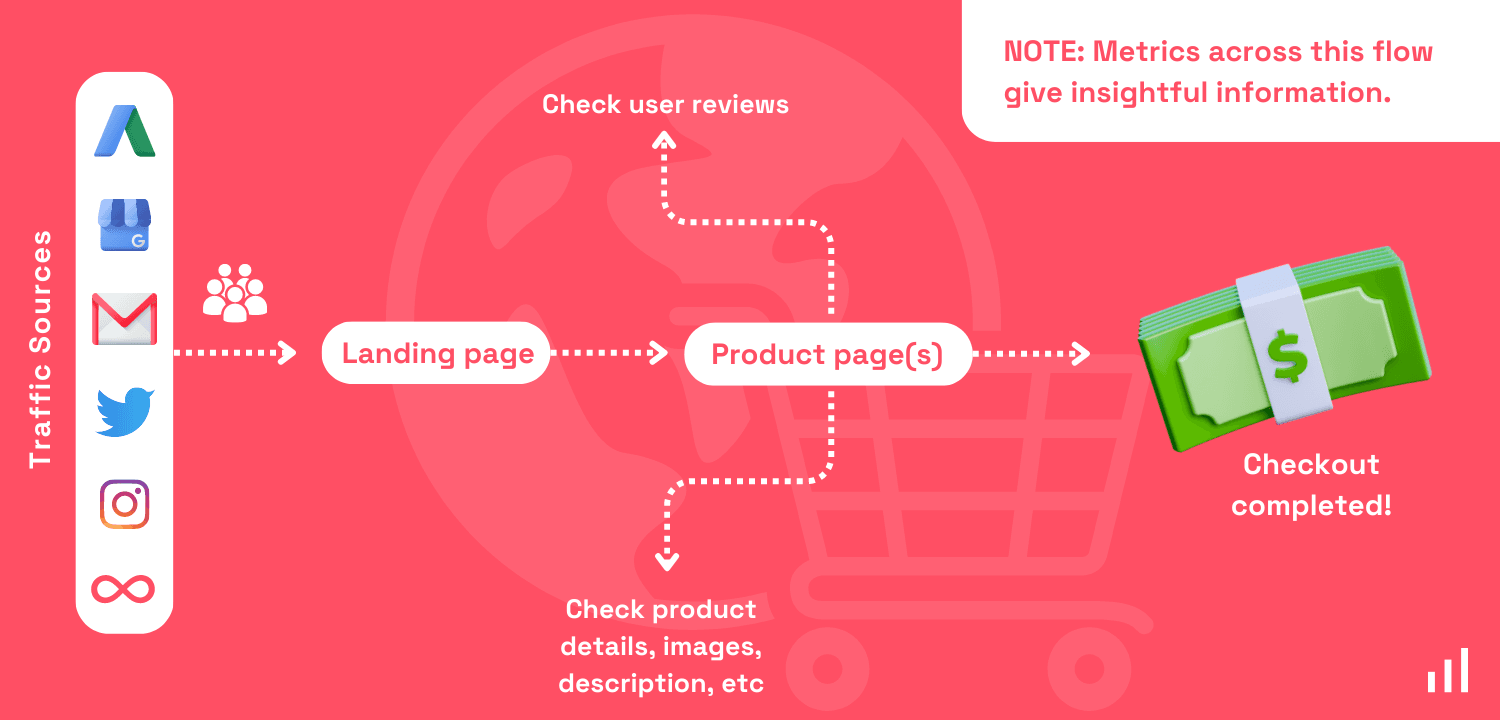
In short, e-commerce analytics is your gateway to unlocking the data that will help optimize for better conversion, which in turn means higher revenue.
Here are some additional details on how it can help:
- Understand page performance: This analytical data makes it very easy to decide whether a page is converting or not and whether any changes need to be made.
- Track campaigns: E-commerce analytics is also a great way to track your campaigns and give you and idea of the ROI received.
- Get visitor behavior data: It’s important to understand how your visitors are interacting and moving across your site; e-commerce analytics is the perfect solution to this as it lets you make decisions over these based on data and not assumptions.
- Higher satisfaction rate: Understanding and fixing user problems by analyzing their needs helps improve visitor satisfaction rates. E-commerce analytics can help you understand what pages they are visiting more and how much duration they are on those pages; based on this, you can find your winning pages to make others looks and feel like those.
Metrics to track on your e-commerce site
Now that we know why e-commerce analytics is important, it’s time to understand what metrics to track and how this data can be actually helpful.
Prerequisite: Before we proceed with this tutorial, it’s assumed that you already have created a Simple Analytics account and embedded the tracking code; if not, here’s how to do it.
Once this setup is done, you can proceed with the content below, which will help you build your e-commerce dashboard inside Simple Analytics.
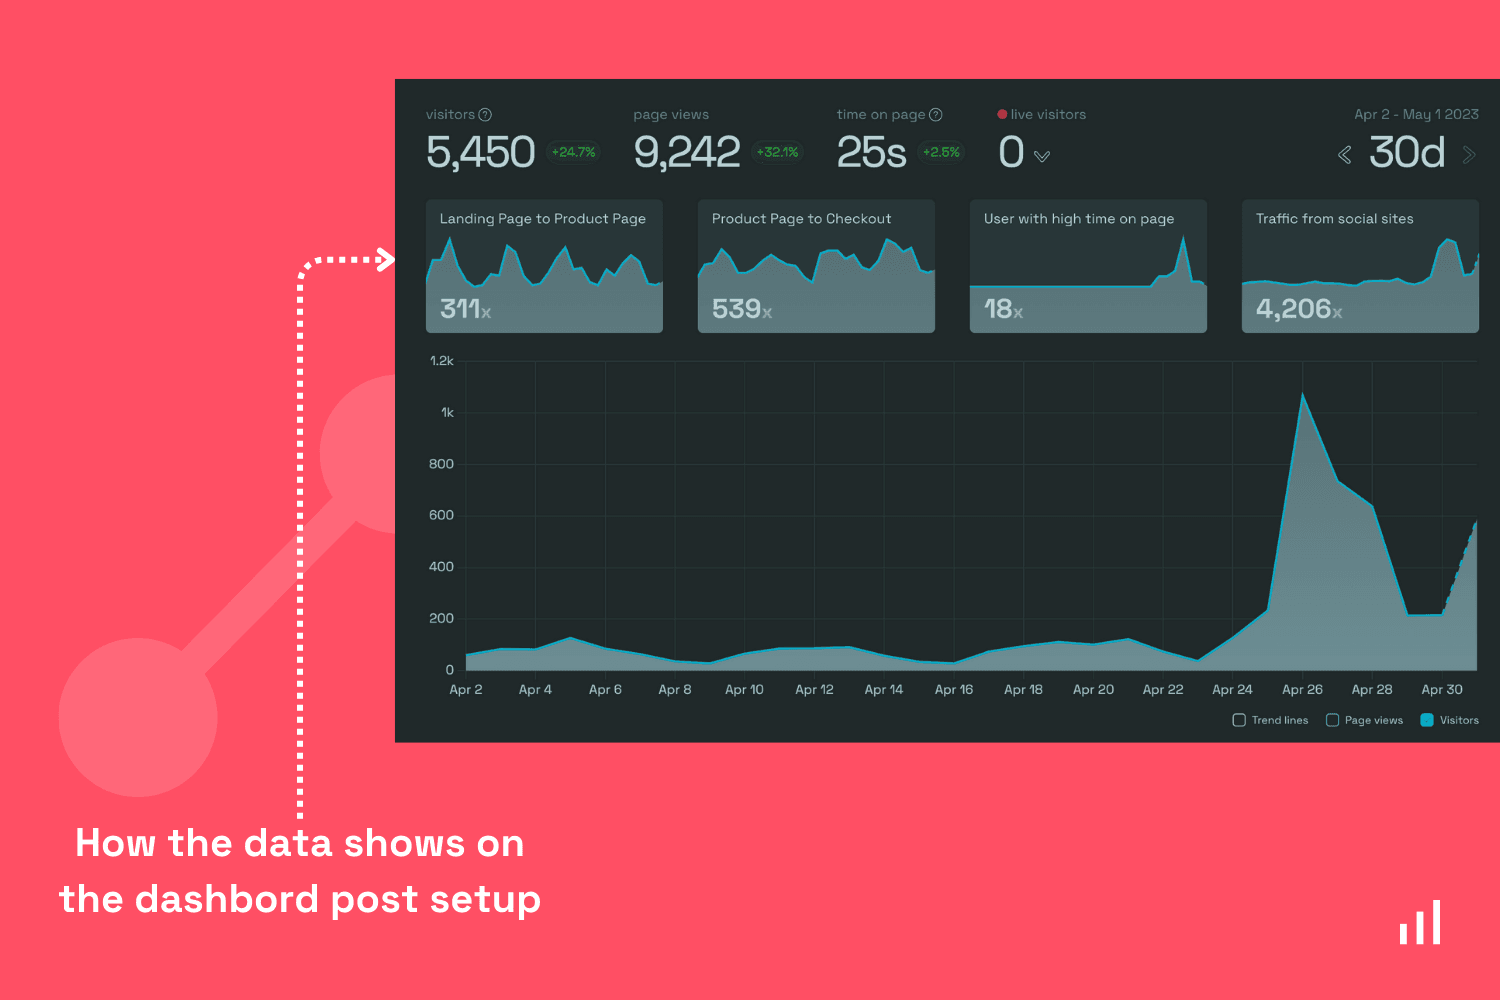
User movement from landing to the product page
Now the first metric you should be tracking is the percentage of visitors coming to your landing page and then moving to any product page. This gives you an idea of how efficient your landing page is in sending those visitors to the product page, which is the beginning of your conversion cycle.
This metric will also help you analyze your landing page changes and see that results in a positive or a negative result.
To start tracking this, you first need to understand your site structure, have a look at the image below, which gives you a quick example of a general product page structure in an e-commerce website.
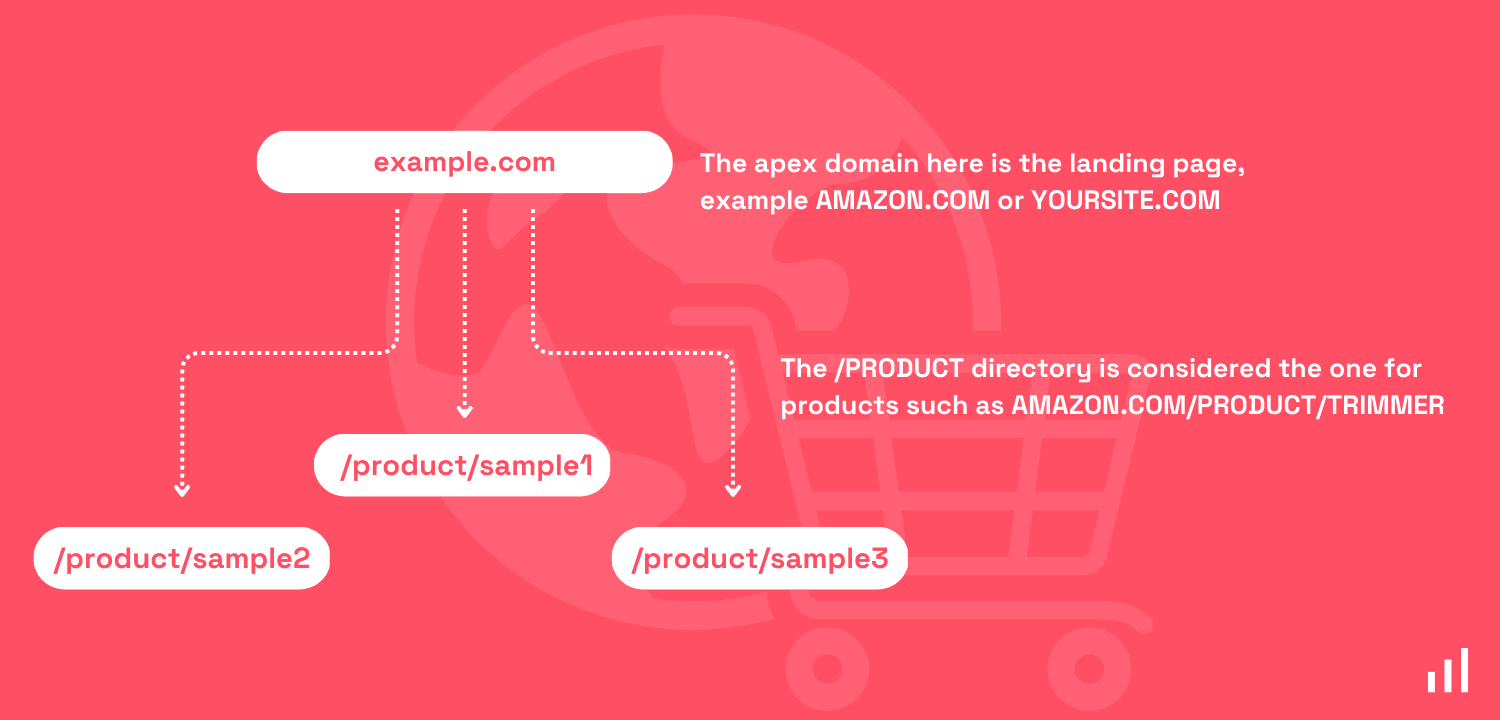
Once you have an understanding of your site’s structure, it's time to track user movement. You can easily do this in Simple Analytics using the “Goals” feature. To see how this feature works, check our video. In your dashboard, navigate to the “Goals” tab and click “Add goal” to set up, as shown below.
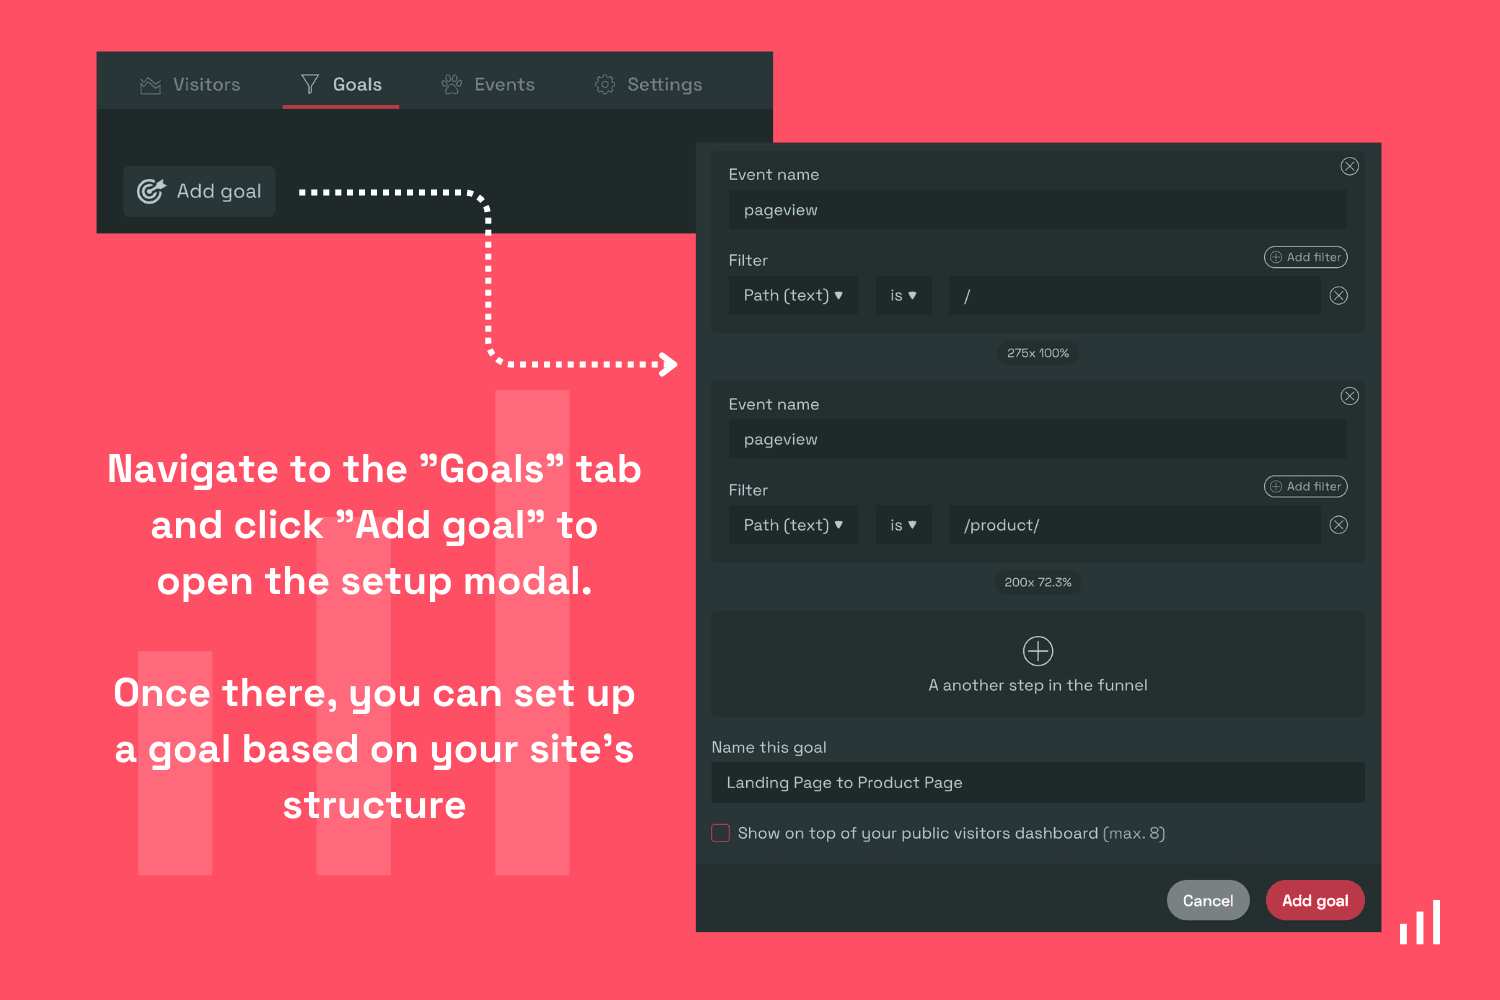
In order to track user movement from your landing page to a product page, you should set it up like this (also shown in the image above):
- Add event name - pageview
- Use the filter path (text) to filter only homepage pageviews
- Add another step in the funnel
- Add event name - pageview
- Use the filter “path (text)” to filter only pageviews for a specific product page
Once this is done, you can see live metrics on your Simple Analytics dashboard. Now using this data, you can take a call on whether your landing page needs any changes or not. If yes, here’s a quick guide to optimize your landing page.
User movement from the product to the checkout page
Another important metric to track in the same flow is how effective your product pages are in making users move to the checkout page. This metric tells us how effective our product pages are and whether any changes are required.
Also, before tracking these metrics, let’s understand the site structure for this case first.
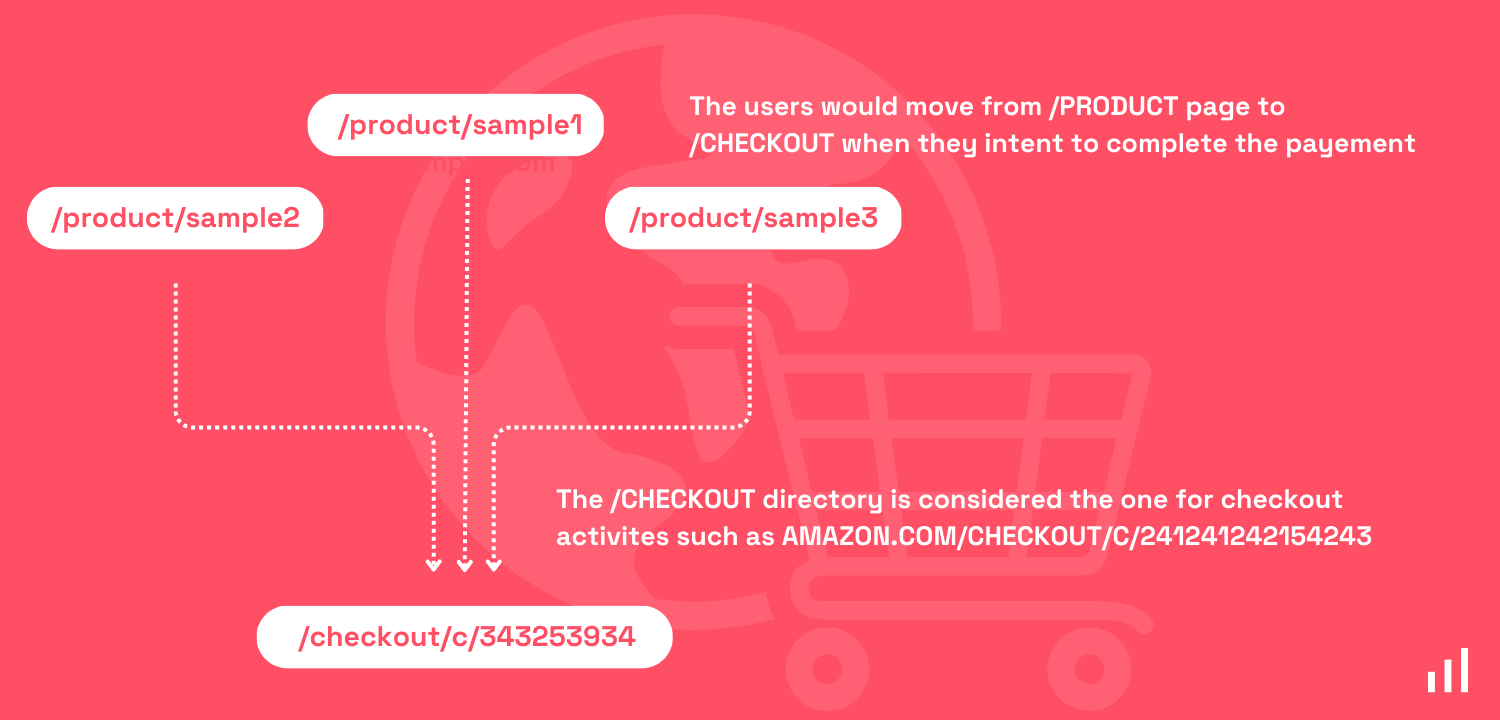
Now that we know what the product and checkout page URL structure looks like, it’s just a simple task of adding them as goals on SimpleAnalytics; here’s how to do this.
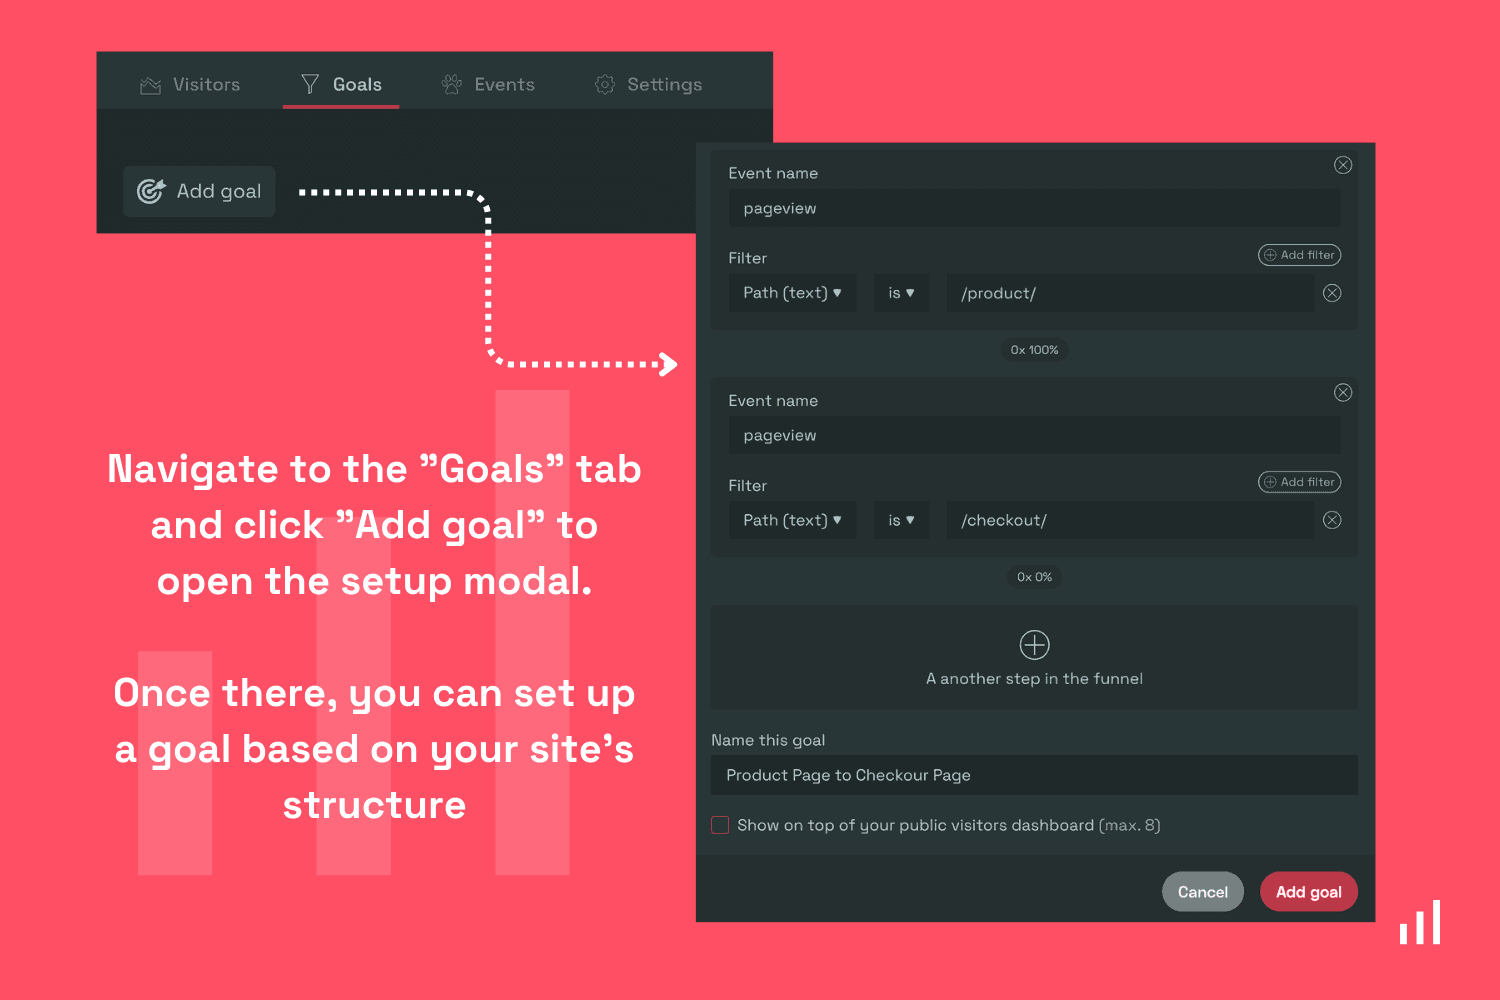
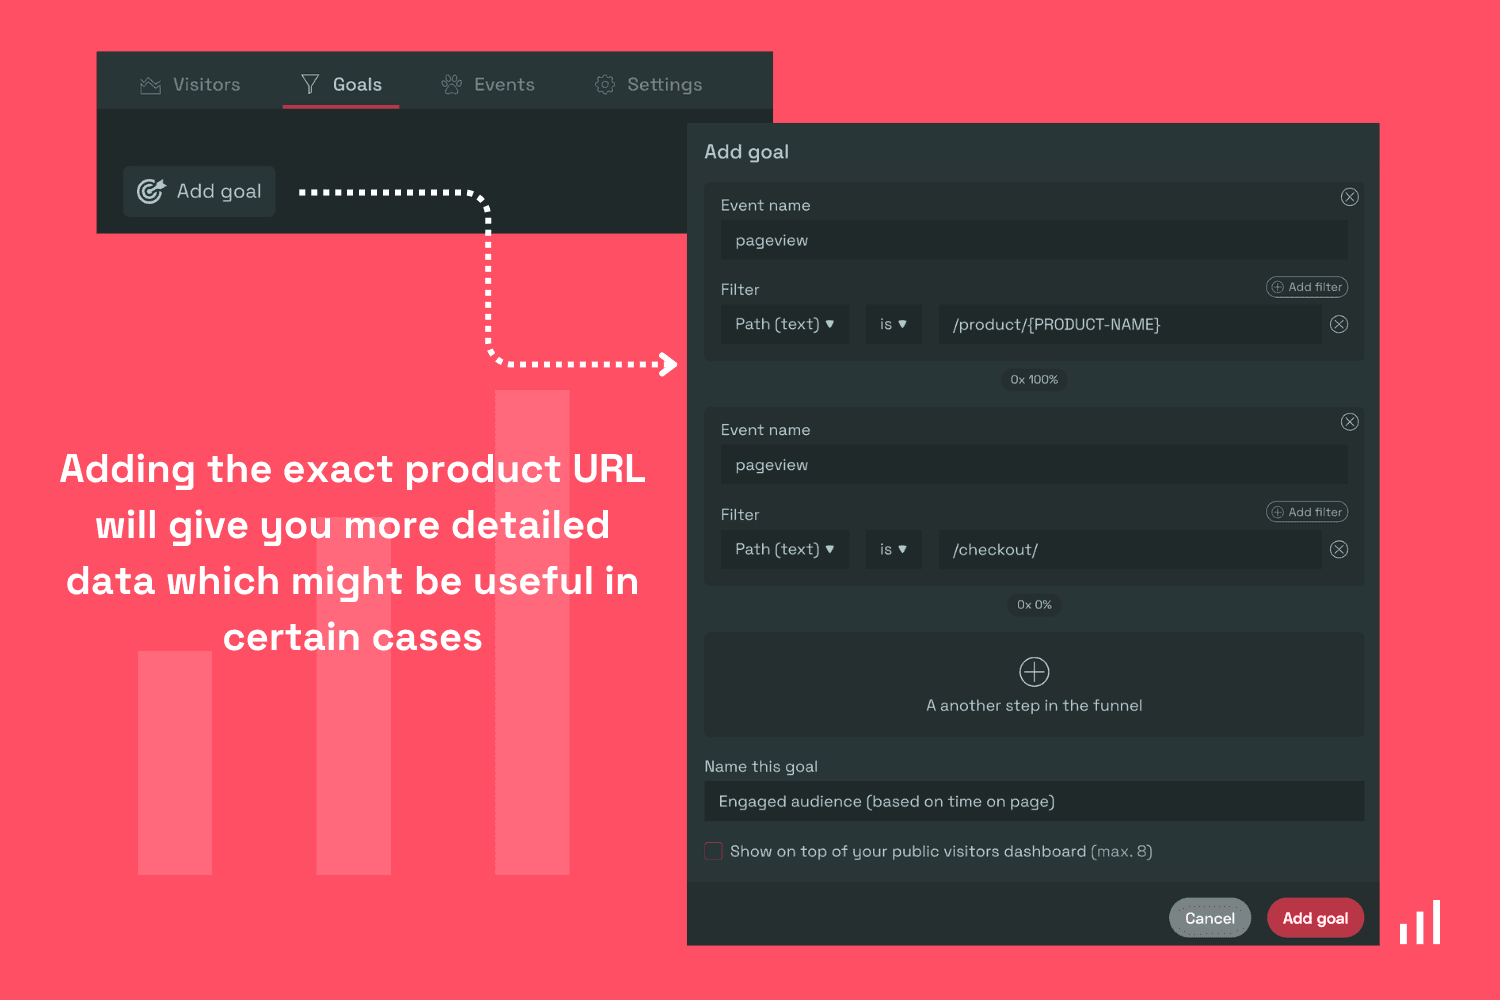
The above example is for aggregate metrics, you can get individual metrics by giving the exact URL of your product pages.
Add metadata to your events
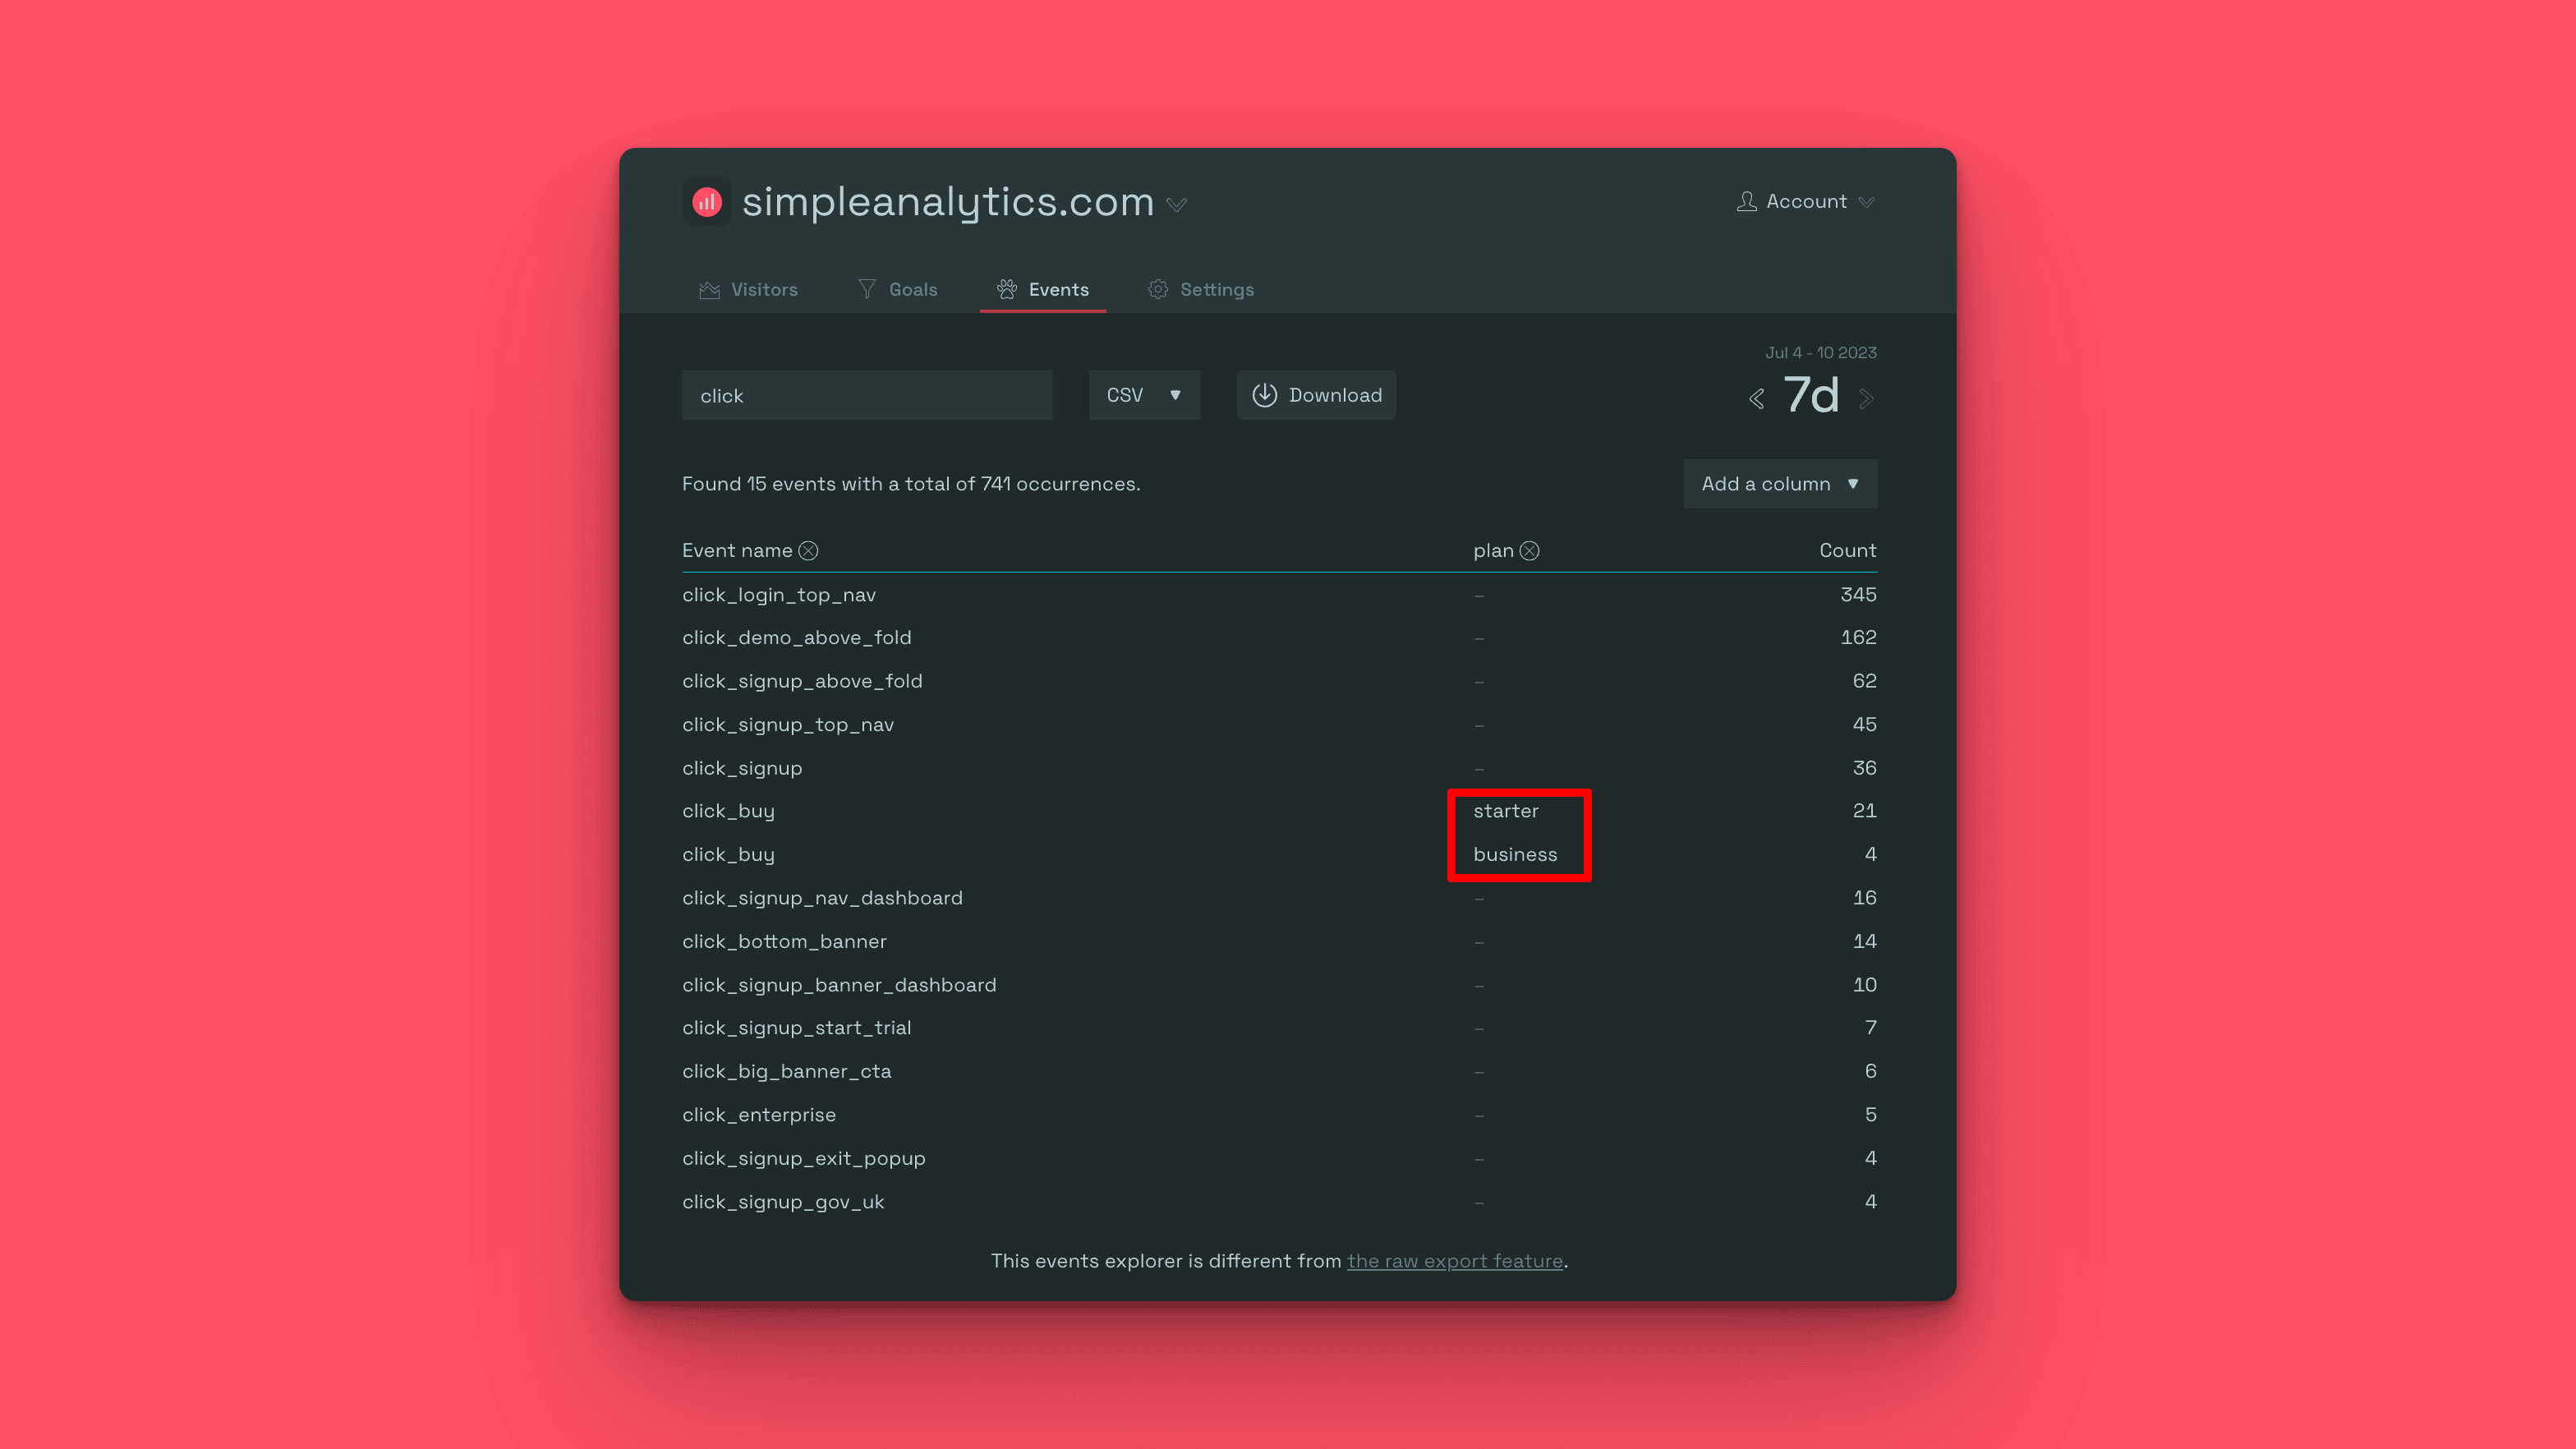
By incorporating metadata into your events, you can better understand your customer's purchasing behavior. For instance, you may want to track the specific items purchased, the plan selected by the user, or the total revenue generated from a single transaction.
The custom code snippet below demonstrates how to add metadata to an event, using a payment_success event as an example. This event would be triggered when a customer completes a purchase.
<script>sa\_event("payment\_success", { plan: "starter" });</script?
In this code, we send a payment_success event with the additional information that the user selected the 'starter' plan. This event is sent to Simple Analytics and shown in the Events Explorer dashboard as shown below.
Track user engagement based on time on page
No matter what industry you are in, if your website is a source of revenue, then you should be tracking user engagement on your website. One metric that gives us an idea on how engaged is how much time they spend on your website.
Here’s a chart of average session duration across the industry.
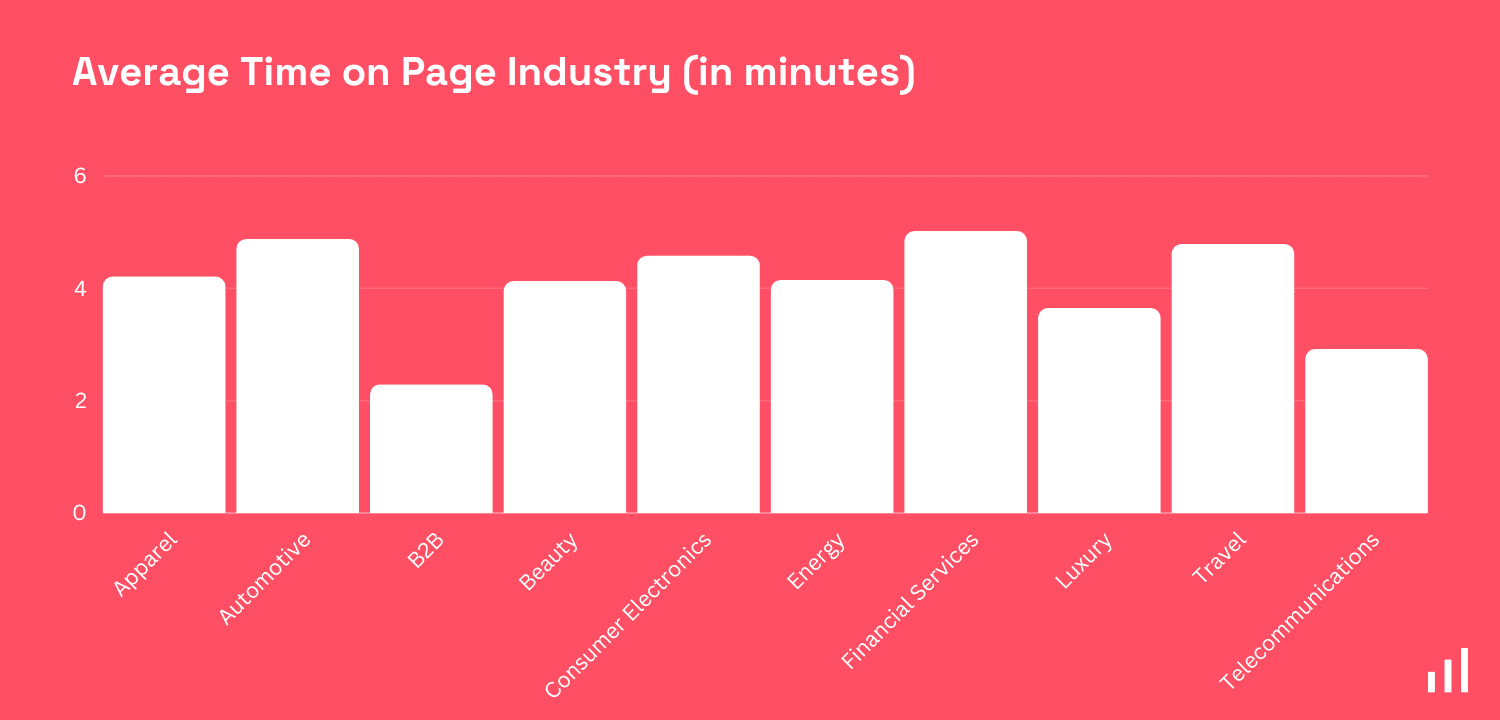
Remember that this is the average session duration (aggregate data). Below is an example of a good time on page number based on the above data.
Assume you are running an Apparel site with 5,000 visitors and 15,000 page views. This means that each visitor visits 3 pages on average.
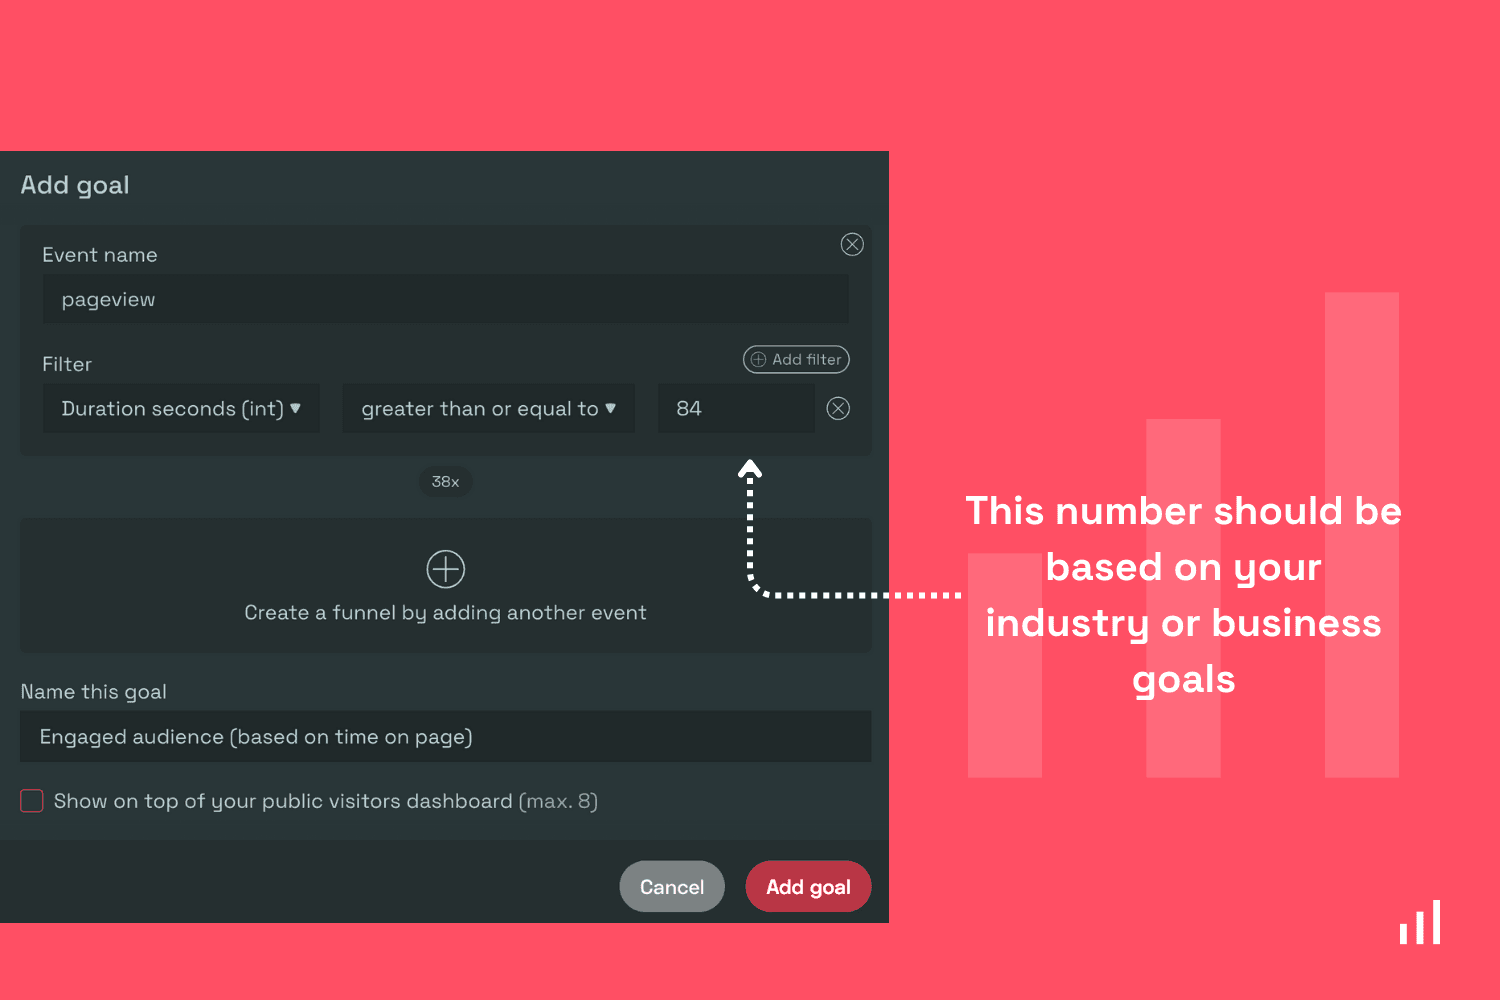
In this case, a good time on page number would be 4.20 minutes / 3, which translates to 1.4 minutes or 84 seconds.
Track the effectiveness of email and ads campaigns
Tracking the performance of your marketing strategies is a must so that you can understand the ROI based on effort and money invested. Among e-commerce sites, email marketing and ads are popular strategies.
The performance of these can be easily done by using links with UTM parameters. Here’s a guide on how to use UTM parameters to track everything.
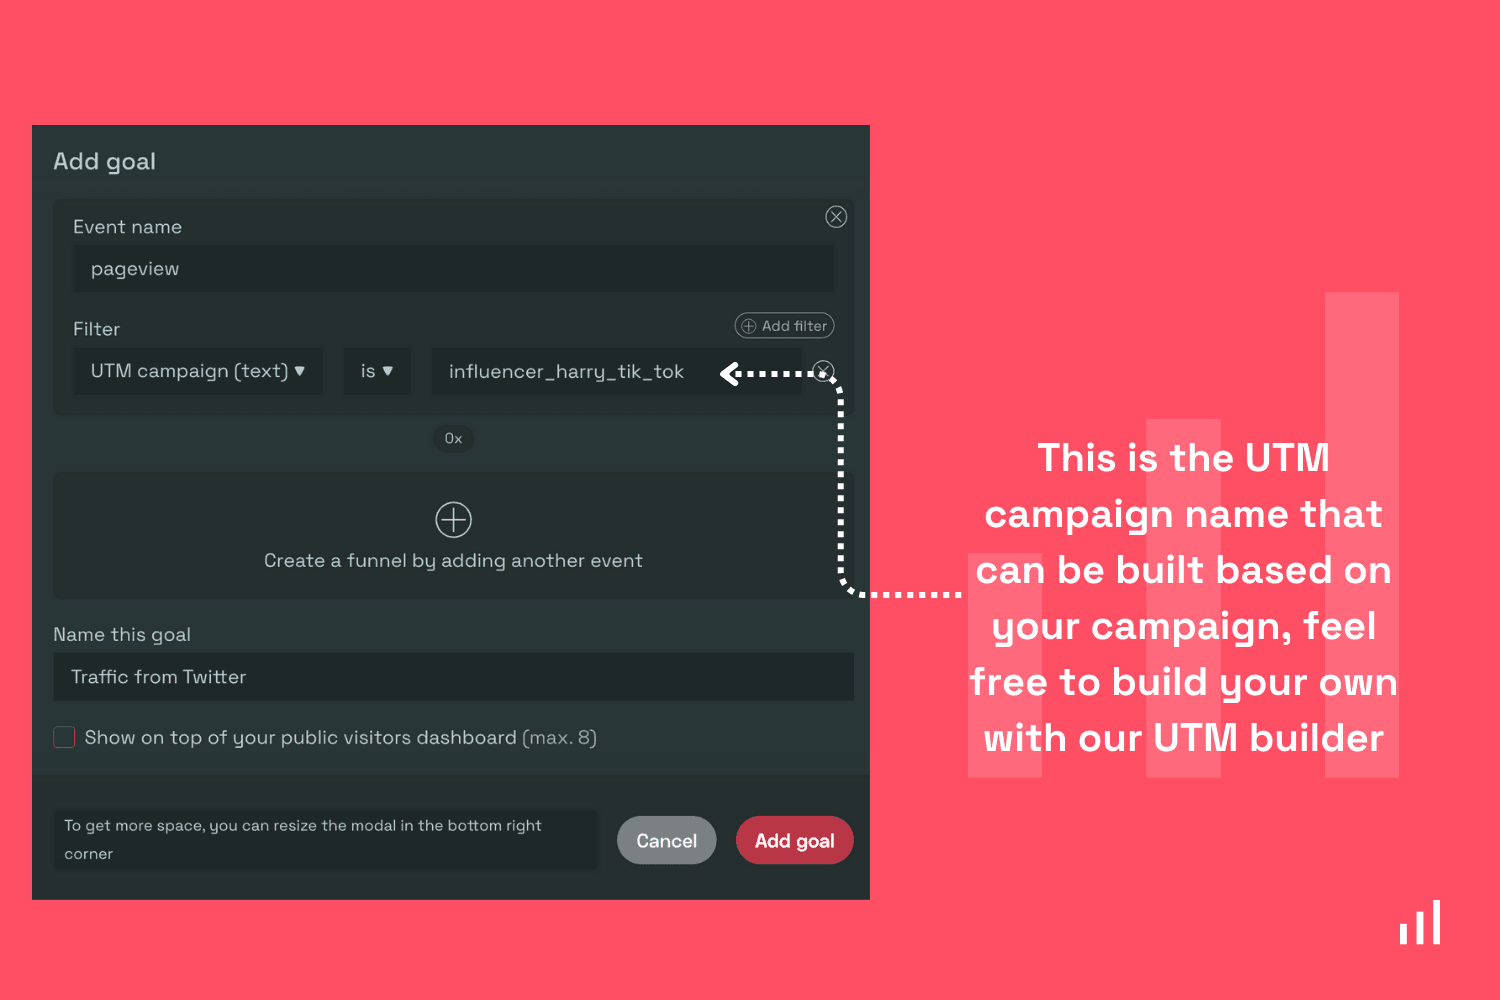
You can define these UTM parameters on Simple Analytics and easily track performance based on the UTMs used.
Using this metric, you can take a call on whether your campaigns are effective or not.
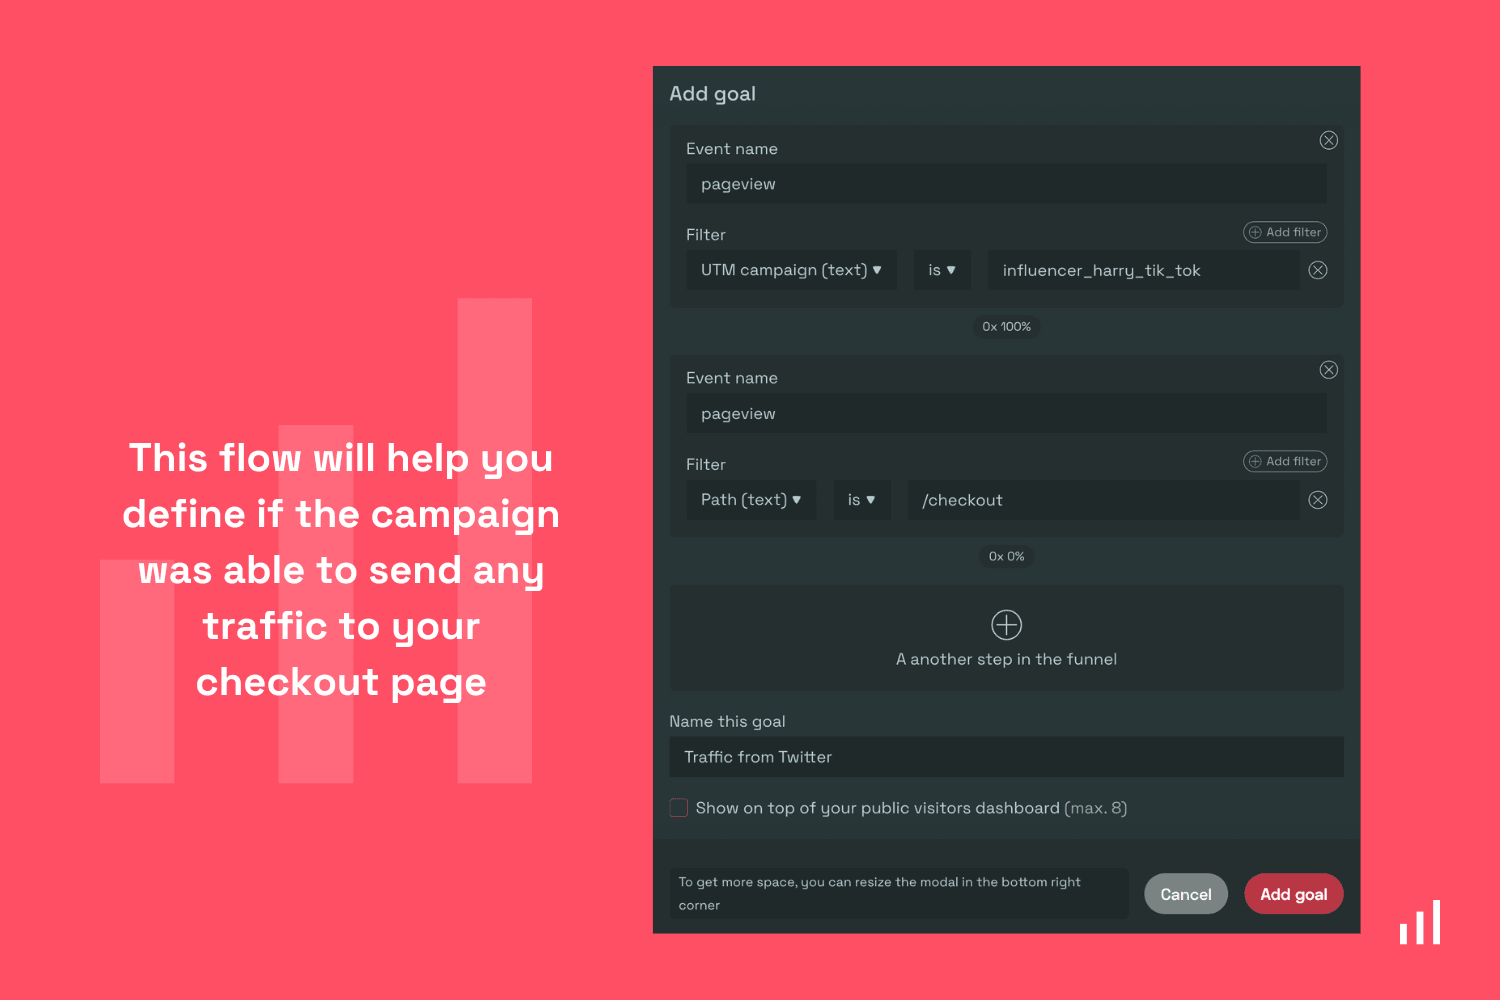
This is especially helpful when you have a paid campaign, and this metric can easily tell you the effectiveness based on the traffic achieved. If you want to check stuff like traffic which actually added product to the cart and moved to the checkout page, then that can also be done; here’s how.
E-commerce businesses tend to get a lot of traffic from socials, too; this can be organic or inorganic, and either way, it is important to keep track of it as well.
Here’s how easily you can track it with Simple Analytics.
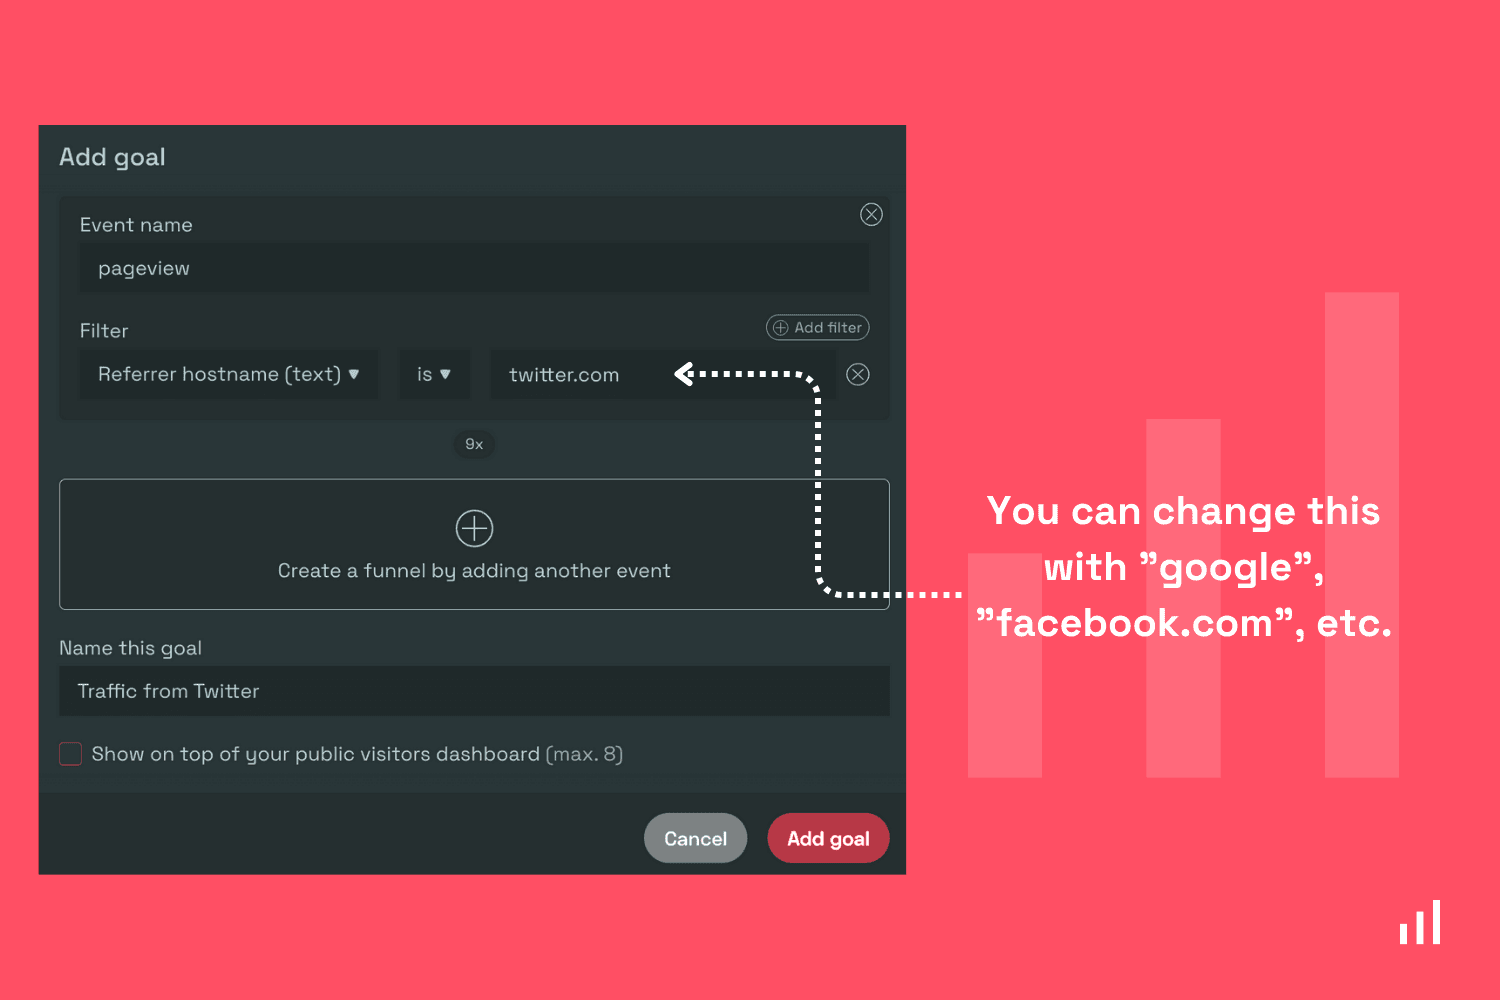
The above examples show how you can track the traffic coming from Twitter, the same can be done for Facebook, Instagram, and even Google.
Conclusion
Tracking your marketing efforts is as important as implementing them. Simple Analytics can help you do just that while being 100% GDPR-compliant plus, you get the most user-friendly dashboard you can customize.
Setting up goals in your dashboard allows you to easily monitor user flow through your e-commerce funnel. The aim is to track and keep improving all the important metrics over time.
We also have a blog to track your content marketing metrics; do check that too.