



惯性聚合 高效追踪和阅读你感兴趣的博客、新闻、科技资讯
阅读原文 在惯性聚合中打开

推荐订阅源

The Hacker News
The Hacker News
GbyAI
GbyAI
雷峰网
雷峰网
罗磊的独立博客
WordPress大学
WordPress大学
博客园_首页
Hugging Face - Blog
Hugging Face - Blog
The Cloudflare Blog
云风的 BLOG
云风的 BLOG
F
Full Disclosure
Google DeepMind News
C
Cyber Attacks, Cyber Crime and Cyber Security
NISL@THU
NISL@THU
S
Schneier on Security
T
Tor Project blog
C
Cybersecurity and Infrastructure Security Agency CISA
Recent Announcements
酷 壳 – CoolShell
酷 壳 – CoolShell
C
Check Point Blog
P
Palo Alto Networks Blog
C
CERT Recently Published Vulnerability Notes
S
Secure Thoughts
Application and Cybersecurity Blog
Last Week in AI
Last Week in AI
T
Threatpost
I
Intezer
Y
Y Combinator Blog
G
GRAHAM CLULEY
MyScale Blog
MyScale Blog
阮一峰的网络日志
阮一峰的网络日志
T
The Exploit Database - CXSecurity.com
Scott Helme
Scott Helme
A
Arctic Wolf
Martin Fowler
Martin Fowler
Hacker News: Ask HN
Hacker News: Ask HN
V
V2EX
B
Blog RSS Feed
The Last Watchdog
The Last Watchdog
博客园 - 司徒正美
Simon Willison's Weblog
V
Vulnerabilities – Threatpost
OSCHINA 社区最新新闻
OSCHINA 社区最新新闻
N
News and Events Feed by Topic
www.infosecurity-magazine.com
让小产品的独立变现更简单 - ezindie.com
P
Proofpoint News Feed
CTFtime.org: upcoming CTF events
AI
AI
C
Cisco Blogs
T
The Blog of Author Tim Ferriss

Blog — PlanetScale

Keeping a Postgres queue healthy — PlanetScale Patterns for Postgres Traffic Control — PlanetScale Graceful degradation in Postgres — PlanetScale High memory usage in Postgres is good, actually — PlanetScale Stripe Projects partnership: Provision PlanetScale Postgres and MySQL databases from the Stripe CLI — PlanetScale Enhanced tagging in Postgres Query Insights — PlanetScale Behind the scenes: How Database Traffic Control works — PlanetScale Introducing Database Traffic Control — PlanetScale Scaling Postgres connections with PgBouncer — PlanetScale Drizzle joins PlanetScale — PlanetScale Video Conferencing with Postgres — PlanetScale Faster PlanetScale Postgres connections with Cloudflare Hyperdrive — PlanetScale Introducing the PlanetScale MCP server — PlanetScale Database Transactions — PlanetScale Automating our changelog with Cursor commands — PlanetScale Postgres 18 is now available — PlanetScale Using MotherDuck with PlanetScale — PlanetScale $50 PlanetScale Metal is GA for Postgres — PlanetScale AI-Powered Postgres index suggestions — PlanetScale $5 PlanetScale is live — PlanetScale Announcing Vitess 23 — PlanetScale $50 PlanetScale Metal — PlanetScale Report on our investigation of the 2025-10-20 incident in AWS us-east-1 — PlanetScale $5 PlanetScale — PlanetScale Benchmarking Postgres 17 vs 18 — PlanetScale Larger than RAM Vector Indexes for Relational Databases — PlanetScale Partnering with Cloudflare to bring you the fastest globally distributed applications — PlanetScale Processes and Threads — PlanetScale PlanetScale for Postgres is now GA — PlanetScale Postgres High Availability with CDC — PlanetScale Announcing Neki — PlanetScale Caching — PlanetScale The principles of extreme fault tolerance — PlanetScale Announcing PlanetScale for Postgres — PlanetScale Benchmarking Postgres — PlanetScale Announcing Vitess 22 — PlanetScale The Real Failure Rate of EBS — PlanetScale IO devices and latency — PlanetScale Announcing PlanetScale Metal — PlanetScale PlanetScale Metal: There’s no replacement for displacement — PlanetScale Upgrading Query Insights to Metal — PlanetScale Automating cherry-picks between OSS and private forks — PlanetScale Database Sharding — PlanetScale Anatomy of a Throttler, part 3 — PlanetScale Introducing sharding on PlanetScale with workflows — PlanetScale Announcing Vitess 21 — PlanetScale Announcing the PlanetScale vectors public beta — PlanetScale Anatomy of a Throttler, part 2 — PlanetScale Instant deploy requests — PlanetScale Anatomy of a Throttler, part 1 — PlanetScale Increase IOPS and throughput with sharding — PlanetScale Tracking index usage with Insights — PlanetScale Faster backups with sharding — PlanetScale Building data pipelines with Vitess — PlanetScale The State of Online Schema Migrations in MySQL — PlanetScale Optimizing aggregation in the Vitess query planner — PlanetScale Dealing with large tables — PlanetScale Announcing Vitess 20 — PlanetScale Self-managed Vitess vs Managed Vitess with PlanetScale — PlanetScale Achieving data consistency with the consistent lookup Vindex — PlanetScale The MySQL adaptive hash index — PlanetScale Introducing global replica credentials — PlanetScale Profiling memory usage in MySQL — PlanetScale Summer 2023: Fuzzing Vitess at PlanetScale — PlanetScale How PlanetScale makes schema changes — PlanetScale Identifying and profiling problematic MySQL queries — PlanetScale The Problem with Using a UUID Primary Key in MySQL — PlanetScale Announcing Vitess 19 — PlanetScale PlanetScale forever — PlanetScale Introducing schema recommendations — PlanetScale Amazon Aurora Pricing: The many surprising costs of running an Aurora database — PlanetScale Three common MySQL database design mistakes — PlanetScale OAuth applications are now available to everyone — PlanetScale Deprecating the Scaler plan — PlanetScale PlanetScale branching vs. Amazon Aurora blue/green deployments — PlanetScale Databases at scale — PlanetScale Considerations for building a database disaster recovery plan — PlanetScale Working with Geospatial Features in MySQL — PlanetScale PlanetScale vs Amazon Aurora replication — PlanetScale Introducing the Vantage and PlanetScale integration — PlanetScale MySQL isolation levels and how they work — PlanetScale Introducing the schemadiff command line tool — PlanetScale $ pscale ping — PlanetScale Announcing foreign key constraints support — PlanetScale The challenges of supporting foreign key constraints — PlanetScale What is HTAP? — PlanetScale Introducing Insights Anomalies — PlanetScale Webhook security: a hands-on guide — PlanetScale Announcing the Fivetran integration — PlanetScale Introducing webhooks — PlanetScale What is MySQL replication and when should you use it? — PlanetScale Sync user data between Clerk and a PlanetScale MySQL database — PlanetScale Introducing database reports — PlanetScale Distributed caching systems and MySQL — PlanetScale What is MySQL partitioning? — PlanetScale MySQL High Availability: Connection handling and concurrency — PlanetScale Personalizing your onboarding with Markdoc — PlanetScale PlanetScale vs. Amazon Aurora — PlanetScale PlanetScale vs. Amazon RDS — PlanetScale PlanetScale is bringing vector search and storage to MySQL — PlanetScale
Query performance analysis with Insights — PlanetScale
Rafer Hazen · 2023-04-20 · via Blog — PlanetScale

Rafer Hazen |

Analyzing the performance of your database can be a tricky business. Even if your database is healthy and the majority of queries are fast, a handful of slow or improperly indexed query patterns can frustrate your users or spiral into bigger problems as your dataset and traffic grow.

To help developers identify and troubleshoot problematic queries, PlanetScale Insights now shows time-series metrics on a per-query pattern basis.

Query patterns

The fundamental unit of analysis in Insights is a query pattern, so it's worth discussing how and why Insights defines this concept. As you probably know, relational databases receive queries in the form of SQL statements:

select * from users where id = 123

Because PlanetScale databases often receive thousands or even millions of queries per second, reporting performance stats for every individual query isn't usually what we want. Instead, we'd like aggregate data for similar queries over time. It's better to know “This is how long id-based user lookups took over the last hour” versus “This is how long it took to look up user 123.”

To establish what queries should be grouped together, we use Vitess's SQL parser to find a normalized pattern for every query. The Vitess query serving layer converts SQL into an abstract syntax tree, which we then walk to replace literals with generic placeholders. Applied to the query above, we find the following normalized representation.

select * from users where id = ?

Beyond literal extraction, Vitess's AST normalization also helps eliminate surface-level syntactic differences, such as casing differences or the presence of redundant parentheses. With the normalized query in hand, we can calculate a fingerprint (a hash of the normalized SQL) and use it to group queries and emit aggregated telemetry, such as the number of queries, total execution time, and total rows read, returned, and written. We also send along a sketch of query execution times that allows us to show error-bounded percentiles (e.g., median and p95).

Time-series query data in action

To get an idea of how this data is useful, let's walk through a situation where PlanetScale engineers used this feature to troubleshoot a query in our primary production database.

As a matter of regular maintenance, we regularly review the most expensive and frequently executed queries in our production database. During this process, we noticed the following query, which deletes chunks of expired rows from a fairly large table. From the main Insights tab in PlanetScale, this query takes approximately 8 seconds to run on average.

Stats table for query

Clicking on this query, we see a graph of performance (median and p95 latency) over the last 24 hours. Looking at the median and 95th-percentile query latency data, we see an interesting pattern:
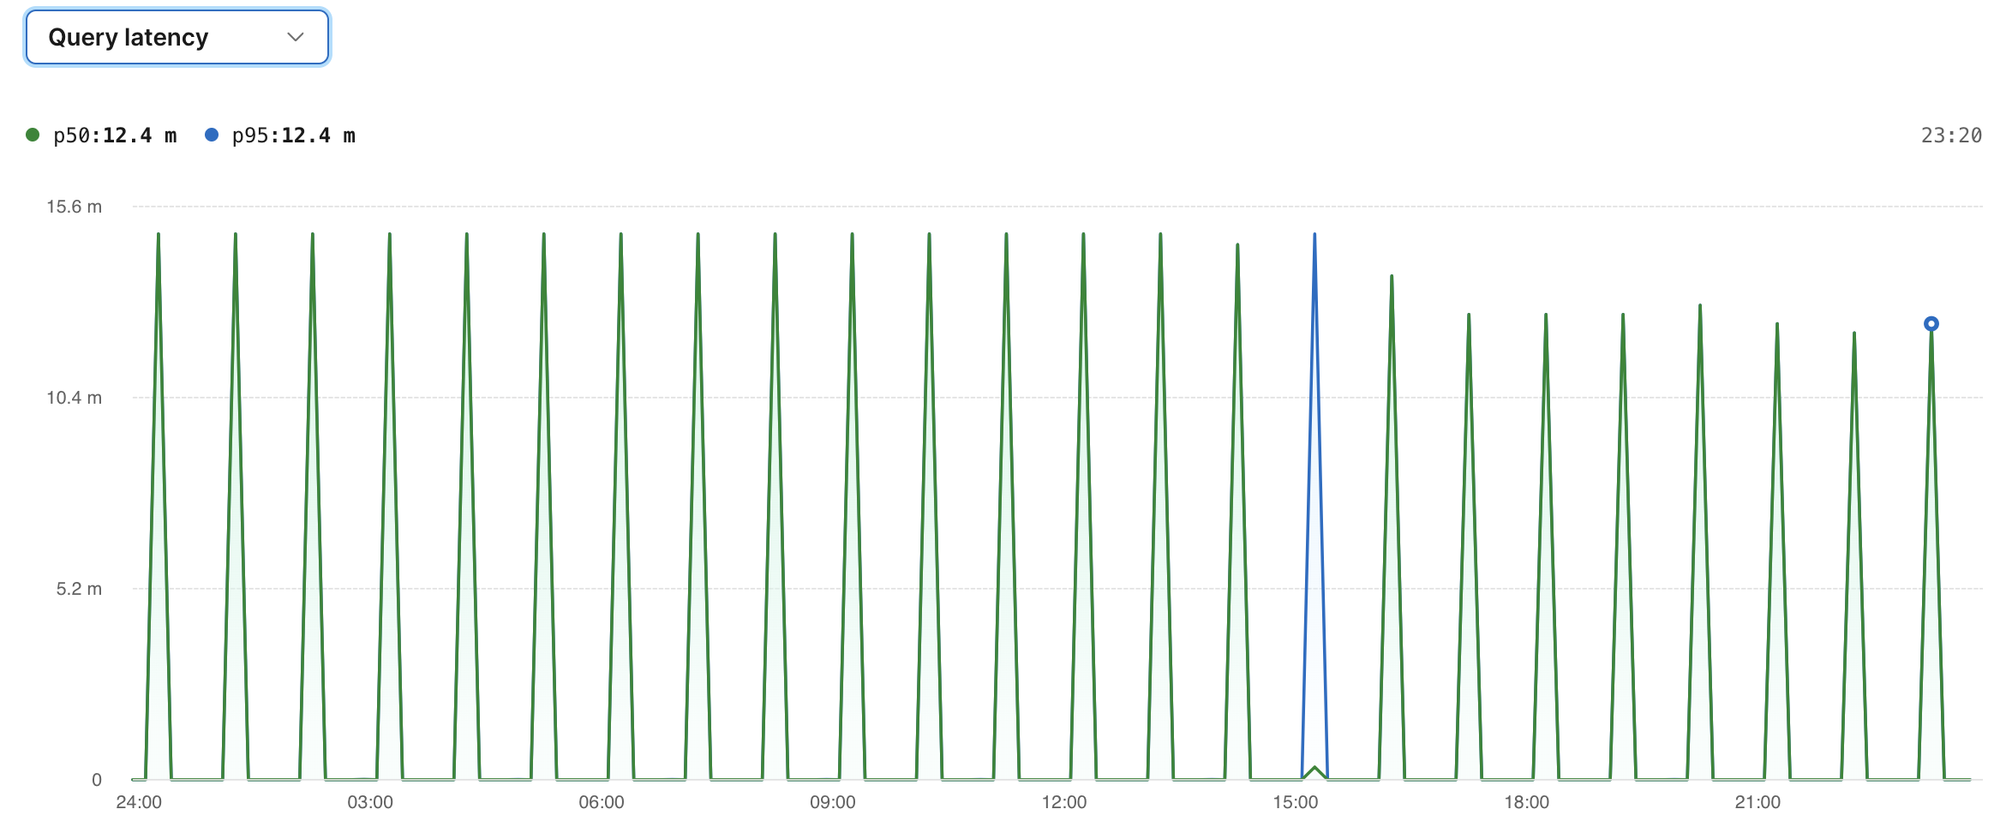
Query graph showing high latency

The background jobs to delete expired data are kicked off at 10 past the hour. For the first 10-minute period after the kickoff (10–20 past the hour), the mean and p95 latencies are fairly low — a few hundred milliseconds. In the next bucket (20–30 past the hour), however, the execution times explode to almost 15 minutes. There's definitely room for improvement here!

The query in question is a delete with a where clause and a limit that specifies only the first n should be deleted. The limit is added to avoid long-running deletes that could slow down other queries. In our case, the limit is set to 500. When the hourly run starts, there are many rows that meet the conditions in the where clause, so the first 500 matches are found relatively quickly. As the job progresses, and more and more of the matching rows have already been deleted, it becomes more expensive to find deletable rows. Toward the end of an hourly run, the query approaches needing to do a full table scan for each execution. Since there are over 100 million rows in the table, this operation becomes untenably expensive.

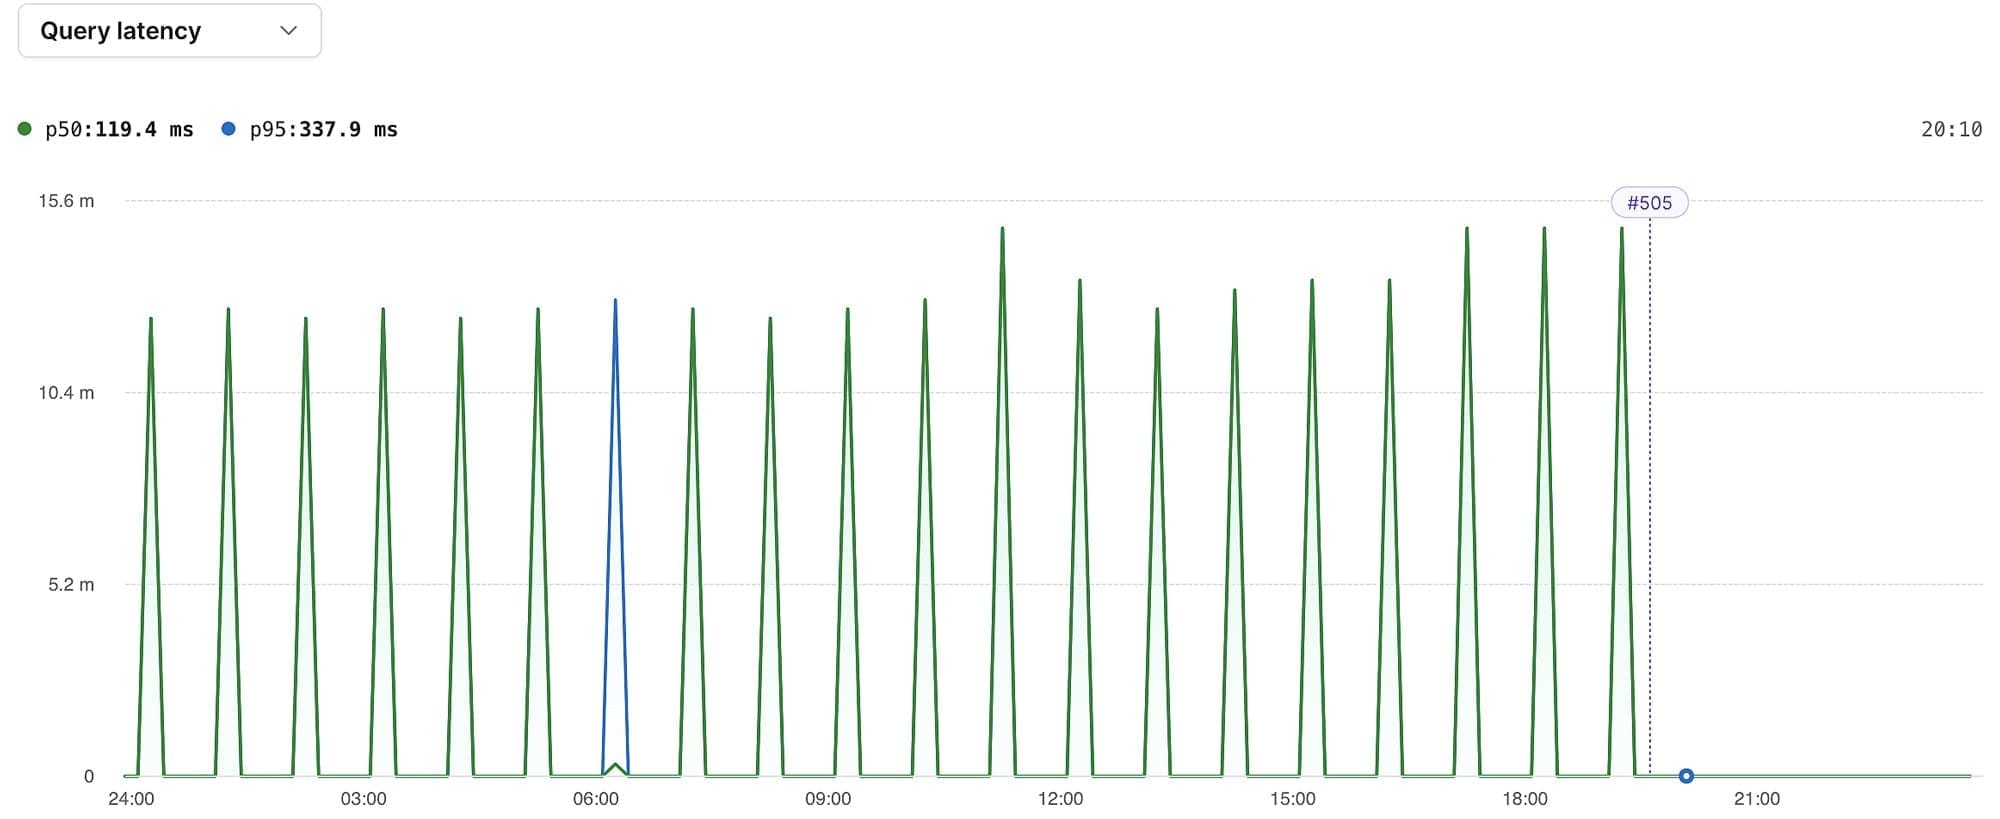
So what can we do to speed this up? Add an index, of course! Adding an index to the minute column lets the database quickly identify and delete the rows that match the where clause. Since we're using PlanetScale, it's easy to add an index without a performance hit or downtime while the index is building, even on busy tables with hundreds of millions of rows. After opening a deploy request with the index, getting approval from our team, and clicking “deploy changes,” our database starts building the index. When it's finished, we see a deploy marker on the query latency graph, labeled #505 — our 505th deploy request to this database. From this graph, we can confirm that query latencies have dropped so dramatically that they're not even visibly discernible from zero on the graph: Query graph showing latency improvements following index addition
If we fast forward to the next day, we see that query latencies are consistently under a few hundred milliseconds. Success!
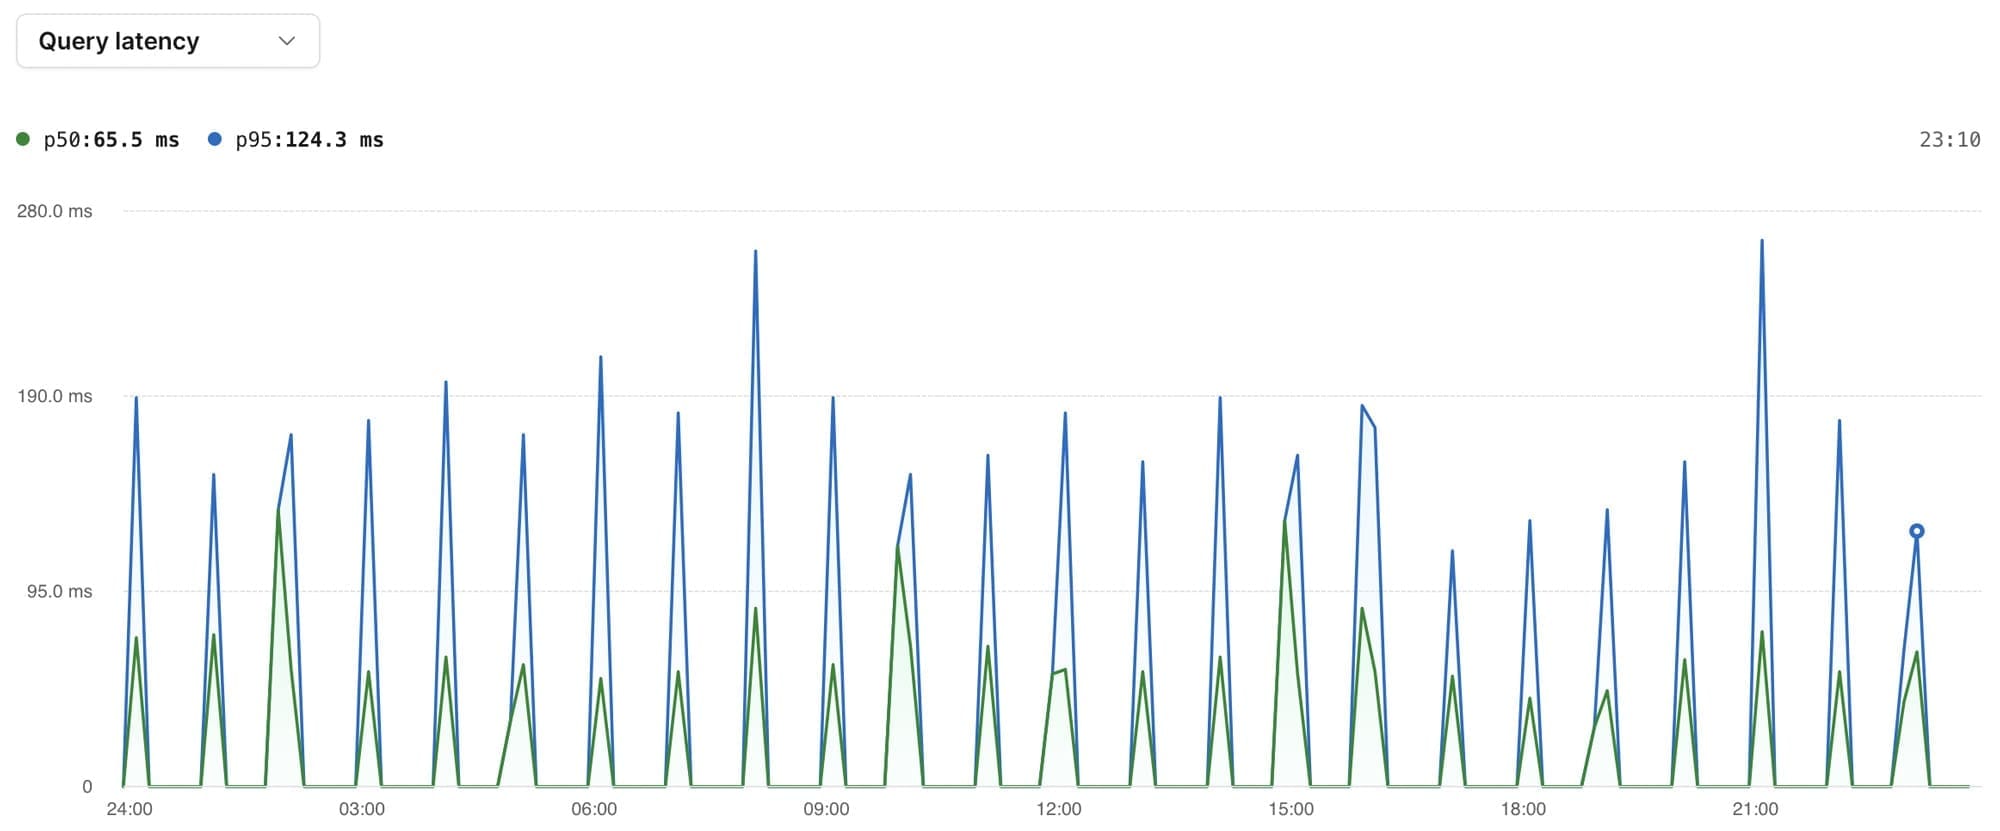
Query graphs showing latency improvements the day following index addition

Try it out now!

We've found that the ability to easily analyze time-series data for query patterns is a powerful tool for identifying and troubleshooting performance issues. Having this ability automatically built into your PlanetScale database makes it easy for teams of all sizes to decide where and when to optimize their database usage.

To see query pattern metrics in your database right now, click on a query from the table in your databases' Insights tab. Try it out, and let us know what you think!

For more information, check out the Insights docs.