Today, we released Database Traffic Control™, a feature for mitigating and preventing database overload due to unexpectedly expensive SQL queries. For an overview, read the blog post introducing the feature, and to get started using it, read the reference documentation. This post is a deep dive into how the feature works.
Background
If you already know how Postgres and Postgres extensions work internally, you can skip this section.
A single Postgres server is made up of many running processes. Each client connection to Postgres gets its own dedicated worker process, and all SQL queries from that client connection run, one at a time, in that worker process. When a client sends a SQL query, the worker process parses it, plans it, executes it, and sends any results back to the client. Planning is a key step, in which Postgres takes a parsed query and turns it into a step-by-step execution plan that specifies the indexes to use, the order to load rows from multiple tables, and the operators that will be used to filter, aggregate, and join those rows. Most queries can be run using several different plans, so it's the planner's job to estimate the cost of the possible plans and pick the cheapest one.
Every part of how Postgres handles queries can be modified by extensions. Extensions can add new functions, new data types, new storage systems, and new authentication methods, among other things. (They can also add new failure modes, but that's a topic for another day.) Extensions can also passively observe and report on traffic, like PlanetScale's own pginsights extension that powers Query Insights.
Much of what Postgres extensions can do, they do using hooks. A hook is a function that runs before, after, or instead of existing Postgres functionality. Want to observe or replace the planner? There's a hook for that. Want to examine queries as they execute? There are three hooks for that. As of this writing, there are 55 hooks available to anyone writing Postgres extensions.
PlanetScale's pginsights extension installs hooks for the ExecutorRun and ProcessUtility functions, among others, to run timers and measure resource consumption while SQL statements execute. Since each hook wraps the original Postgres functionality, that means pginsights sees each query just before it executes and again just after it completes. Any time that has elapsed and any resources the worker process has consumed are directly attributable to that query. The extension does some aggregation, sends aggregate data periodically to a data pipeline, and returns control to Postgres to accept the next query.
Insights, hooks, and blocking queries
When we first started planning for Traffic Control, we knew we would use a Postgres extension with a hook on ExecutorRun to decide whether or not each statement would be allowed to run. Initially, we wrote a new extension for this. We soon realized that there are two ways to choose which queries to block: based on static analysis of the individual query, or based on cumulative measurements of resource usage over time. We split the extension along those lines. Blocking based on static analysis got merged into the project that became pg_strict. Blocking based on cumulative resource usage became Traffic Control.
It turns out Traffic Control needed the same hook points and much of the same information that pginsights already had. So rather than duplicate all that code and impose the extra runtime overhead of another extension, we taught pginsights how to block queries.
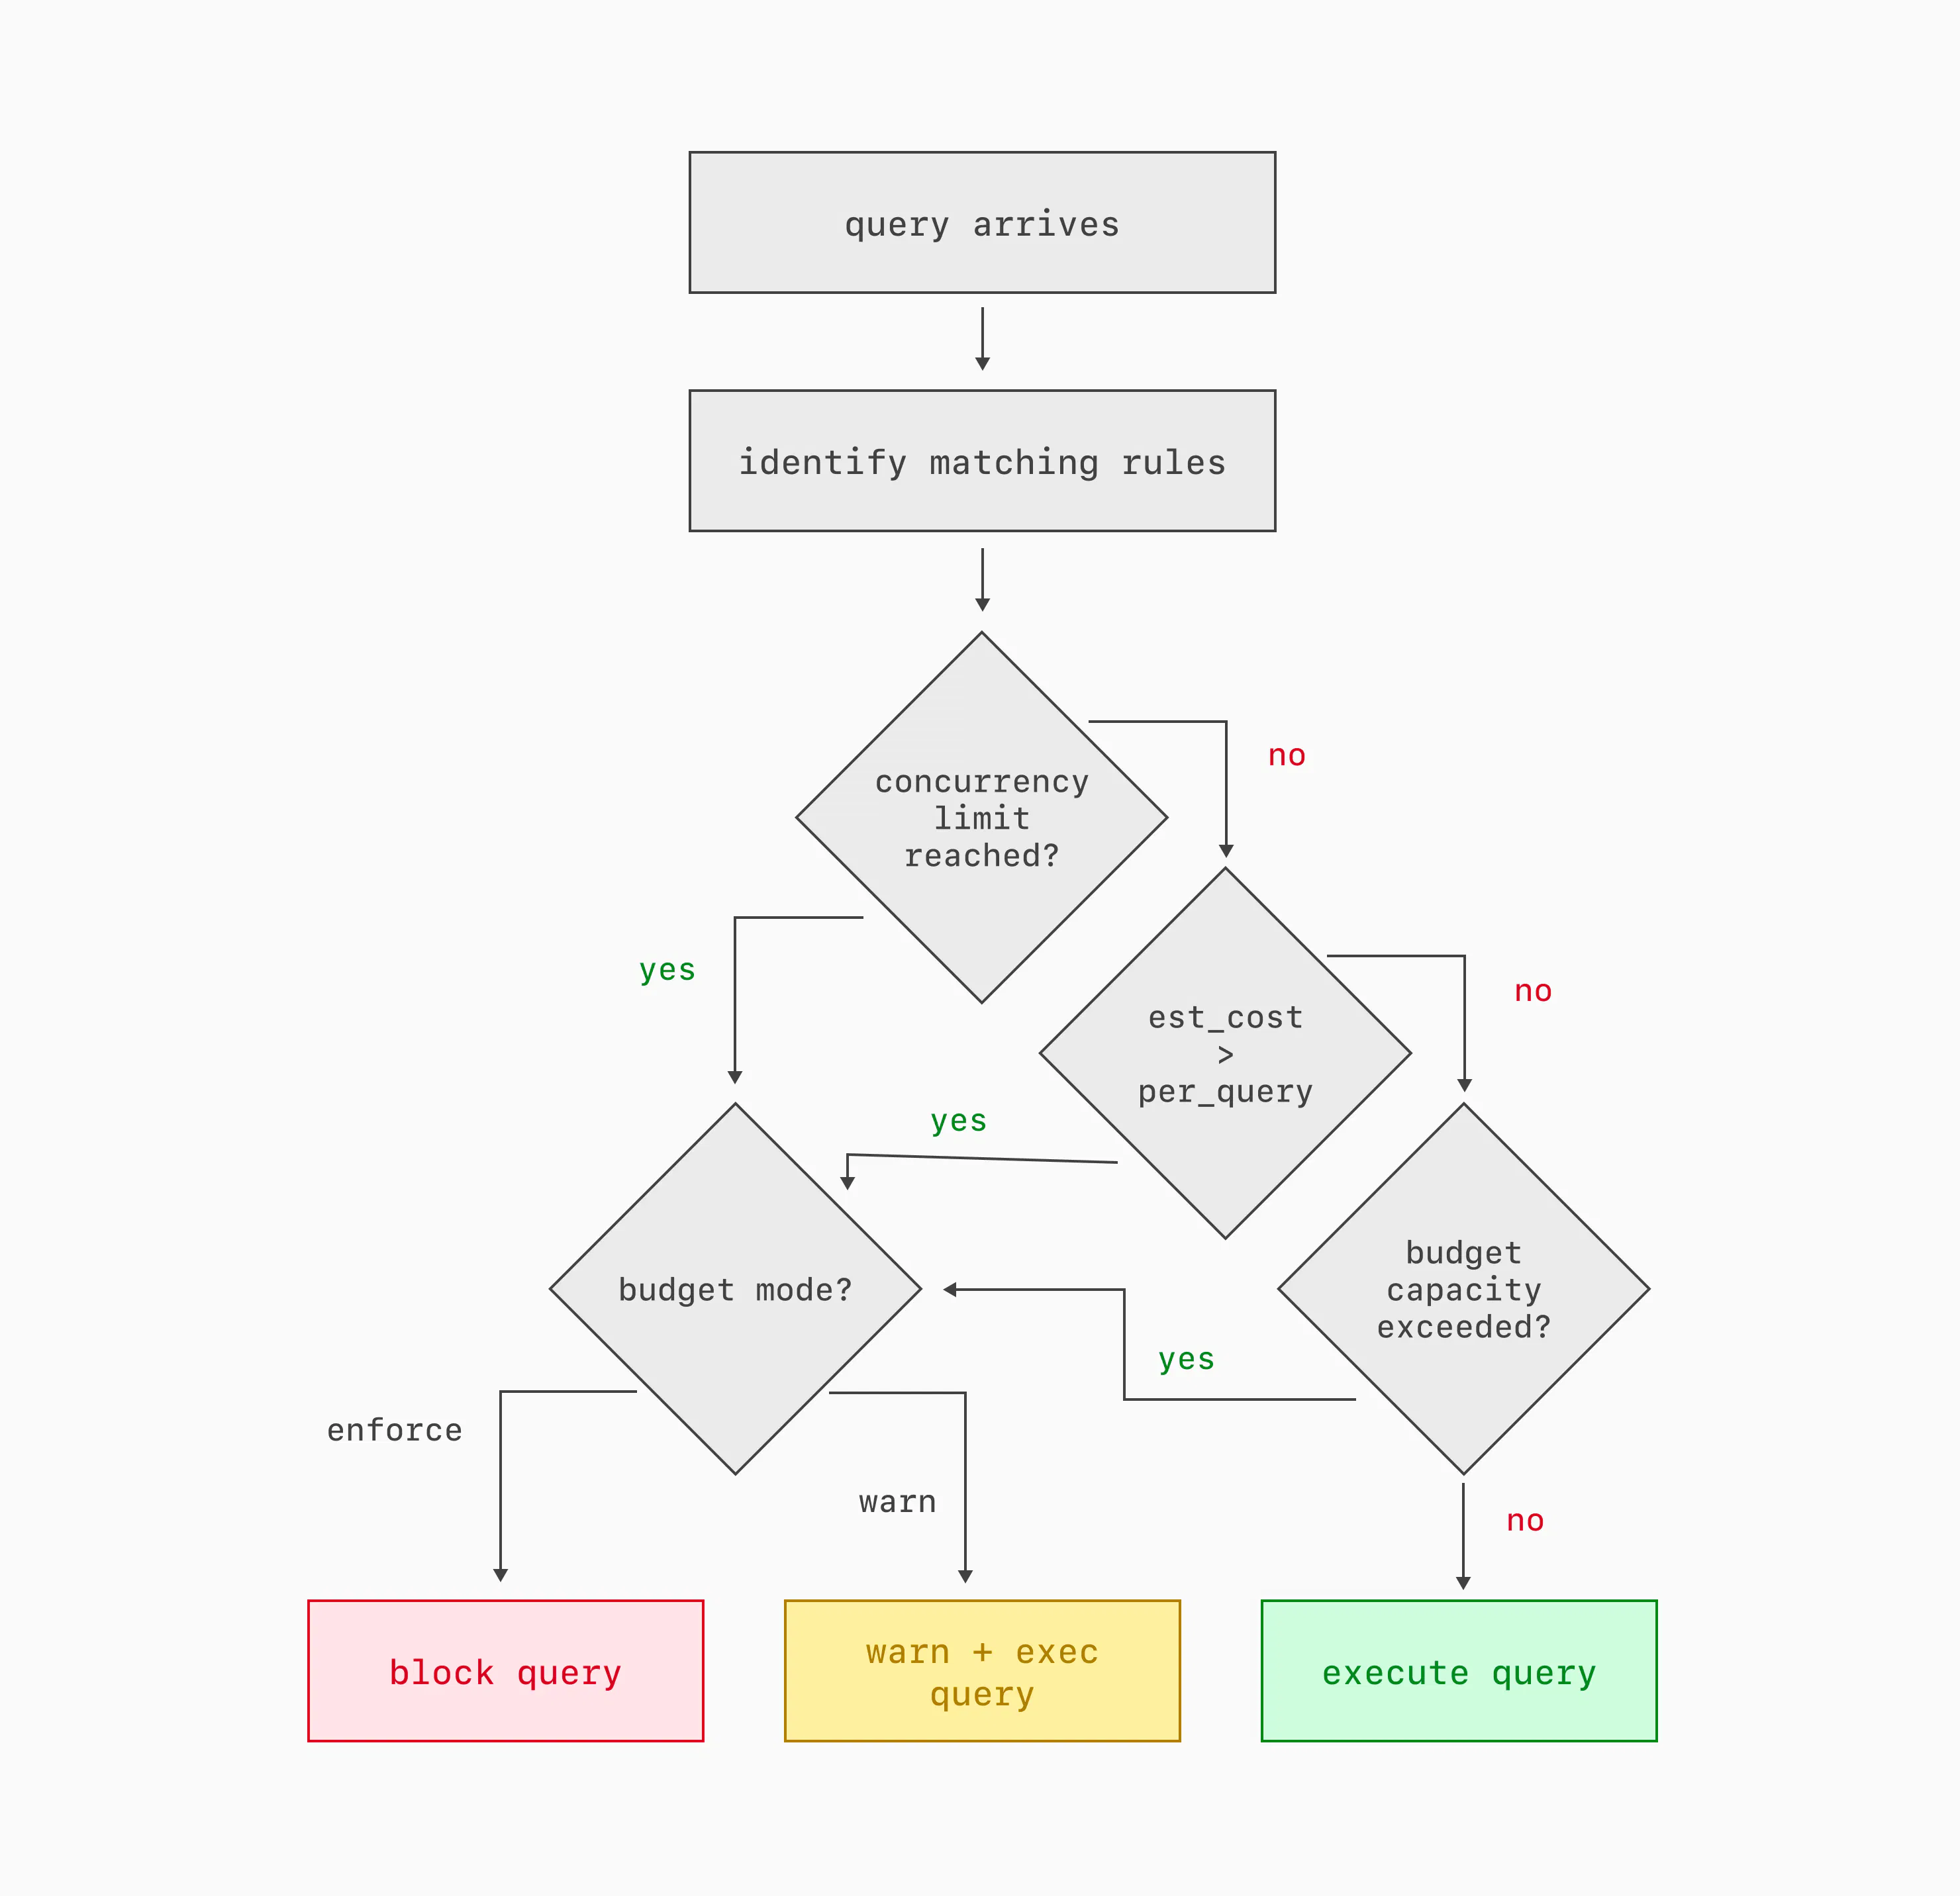
If there are any Traffic Control rules configured, then at the beginning of each query execution, the extension does four things:
- It identifies all of the rules that match the tags and other metadata of the query. Each rule identifies a budget; multiple rules can map to the same budget.
- It checks to see if any of the applicable budgets has reached its concurrency limit.
- It checks if the query's estimated cost is higher than any applicable budget's per-query limit.
- It checks to see if every applicable budget has enough available capacity for the query to begin execution. In the documentation, these parameters are described as the burst limit and the server share. As we'll see below, those parameters combine over time to describe the behavior of a leaky-bucket rate limiter.
If any budget fails any of these checks, then the query is warned or blocked, based on how the budget is configured.
Blocking a query just before it begins execution means the server spends no resources on the query, beyond the cost of the planner and the decision to block it. That's an improvement over schedulers like Linux cgroups, which let every task begin and simply starve them of resources if higher priority tasks exist in the system. It's also an improvement over the Postgres statement_timeout setting, which allows any overly expensive query to consume resources until it times out. Traffic Control blocks expensive, low priority queries before they begin.
Cost prediction
I glossed over something important in the last section: cost. The concurrency check is easy, because it just counts worker processes already assigned to the queries associated with a Traffic Control budget. But the other two checks — per-query cost and cumulative cost — require us to know what resources the query will consume before it even begins execution. How do we do that? We trust, but also don't trust, the planner.
A SQL query planner takes a parsed SQL statement and selects what it hopes is the most efficient series of steps to execute that query. To evaluate all the possible plans, the planner has to estimate the cost of each one. When you run EXPLAIN on a SQL statement, Postgres's planner shows the cost of each step in the chosen plan, as well as the overall total cost. The cost is measured in dimensionless units and is based on configurable weights assigned to each step the plan will take. There are a lot of variables that go into the plan cost, most of which you can ignore for the purposes of understanding Traffic Control. Just remember these two things: plan costs are roughly linear (a plan with double the cost should take something like double the time and resources to execute), and the relationship between plan costs and real-world resources is heavily dependent on what query you're running, what server you run it on, and what else is happening on that server at the moment.
Traffic Control compensates for those dependencies. We assume that there is an unknown constant k that we can multiply the plan cost by, to get the actual wall-clock time it will take to execute that query. But that constant is different for each query pattern and for each host. The constant may also change over time as the workload mix on the server changes and as tables grow and change. So it's not exactly a constant!
Traffic Control implements a hash table on each host, mapping query patterns to two averages: CPU time and planner cost estimates. Both are exponential moving averages, heavily weighting recent queries. Every time a query completes, we update both of those averages. The magical not-quite-constant k is the ratio of the two.
Each time a query comes in, Traffic Control multiplies the planner's estimated cost by k to guess how much CPU and/or wall-clock time the query will take. Based on that estimate, Traffic Control decides if the query can be allowed to begin. If it does, then at the end of query execution, Traffic Control updates the two averages for that query pattern so the k value will be more recent and more precise for the next query that arrives.
Leaky buckets
Two of the checks that Traffic Control performs for each query are easy: if the query's estimated cost is too high, block it. If too many queries in the same budget are already running, block it. But the final check — is there enough capacity in the budget to proceed — is harder. It's important, though! Many executions of a moderately expensive query can be even more damaging than a single very expensive query, and managing a budget over time is the best way to block queries that are only expensive in aggregate. Traffic Control considers the cumulative cost of queries in each configured budget.
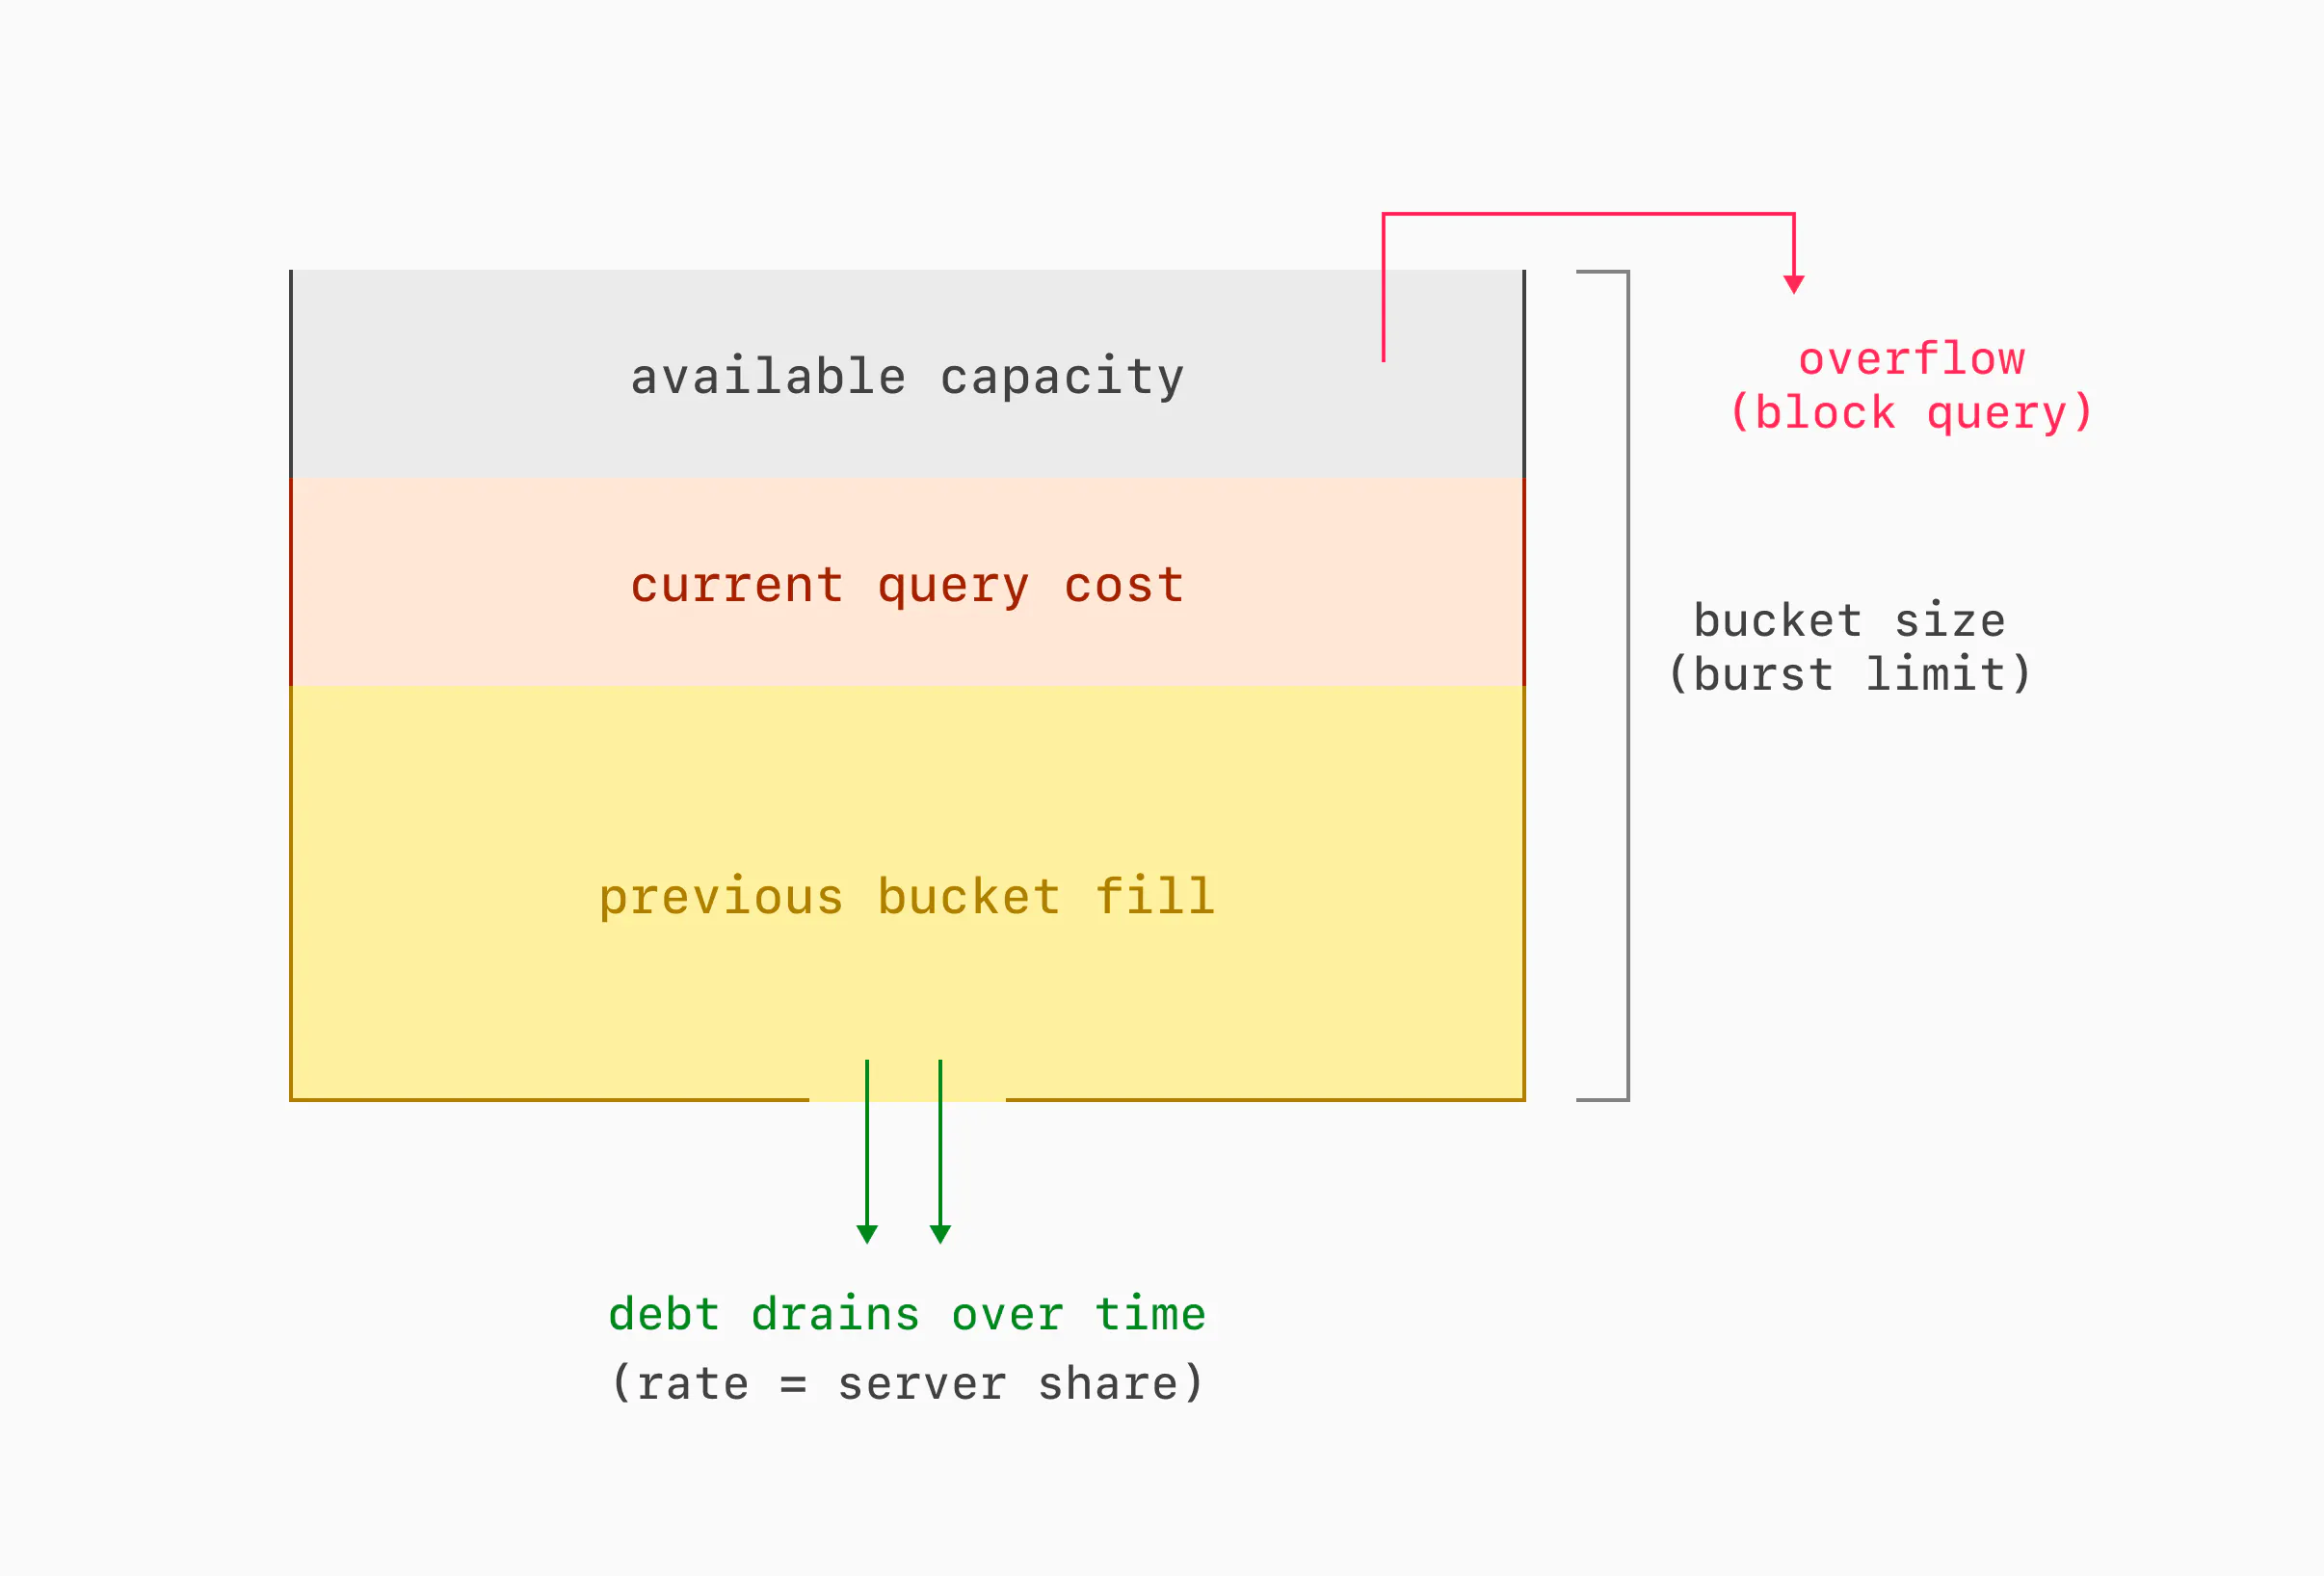
Each budget is modeled as a reverse leaky bucket. Here's how that works. Each query that executes accumulates debt in the bucket. Any query that would cause the bucket to overflow with debt is blocked. Debt drains out over time, until the bucket is empty. The bucket has two important parameters: its size and its drain rate. The size dictates the burst limit, or what total resources queries under a given budget can use in a short amount of time. The drain rate dictates the server share, or what fraction of overall resources queries under a given budget can use in the long term.
Traditionally, leaky buckets work the other way: they start out full, they fill (but never overflow) with credits at a configured rate, traffic consumes credits, and if a bucket is ever empty, traffic gets blocked. We inverted the model for a simple reason: an empty bucket doesn't need to be stored. Over time, we may need to store many buckets for changing rules and changing query metadata. We can drop buckets with a zero debt level, meaning that we only need to store recently active buckets, instead of every possible bucket. We store as many buckets as will fit in a configurable amount of shared memory, and we evict them implicitly when their debt falls to zero.
There is no periodic task that drains debt from all buckets. Instead, each bucket is updated only when read. There is also no periodic task to evict buckets with a debt level of zero. Instead, adding a new bucket to the table evicts any that have already emptied, or whichever bucket is expected to become empty soonest.
Rule sets
One important goal for Traffic Control is that it can efficiently decide when not to block a query. After all, Traffic Control has to make that decision before each query is even allowed to begin execution. So the budget here is measured in microseconds. But we also want developers and database administrators to be able to configure as many rules as it takes to manage traffic to their application. So it's crucial that we can evaluate many rules quickly. Enter rule sets: a data structure that allows evaluating n rules in O(1) time.
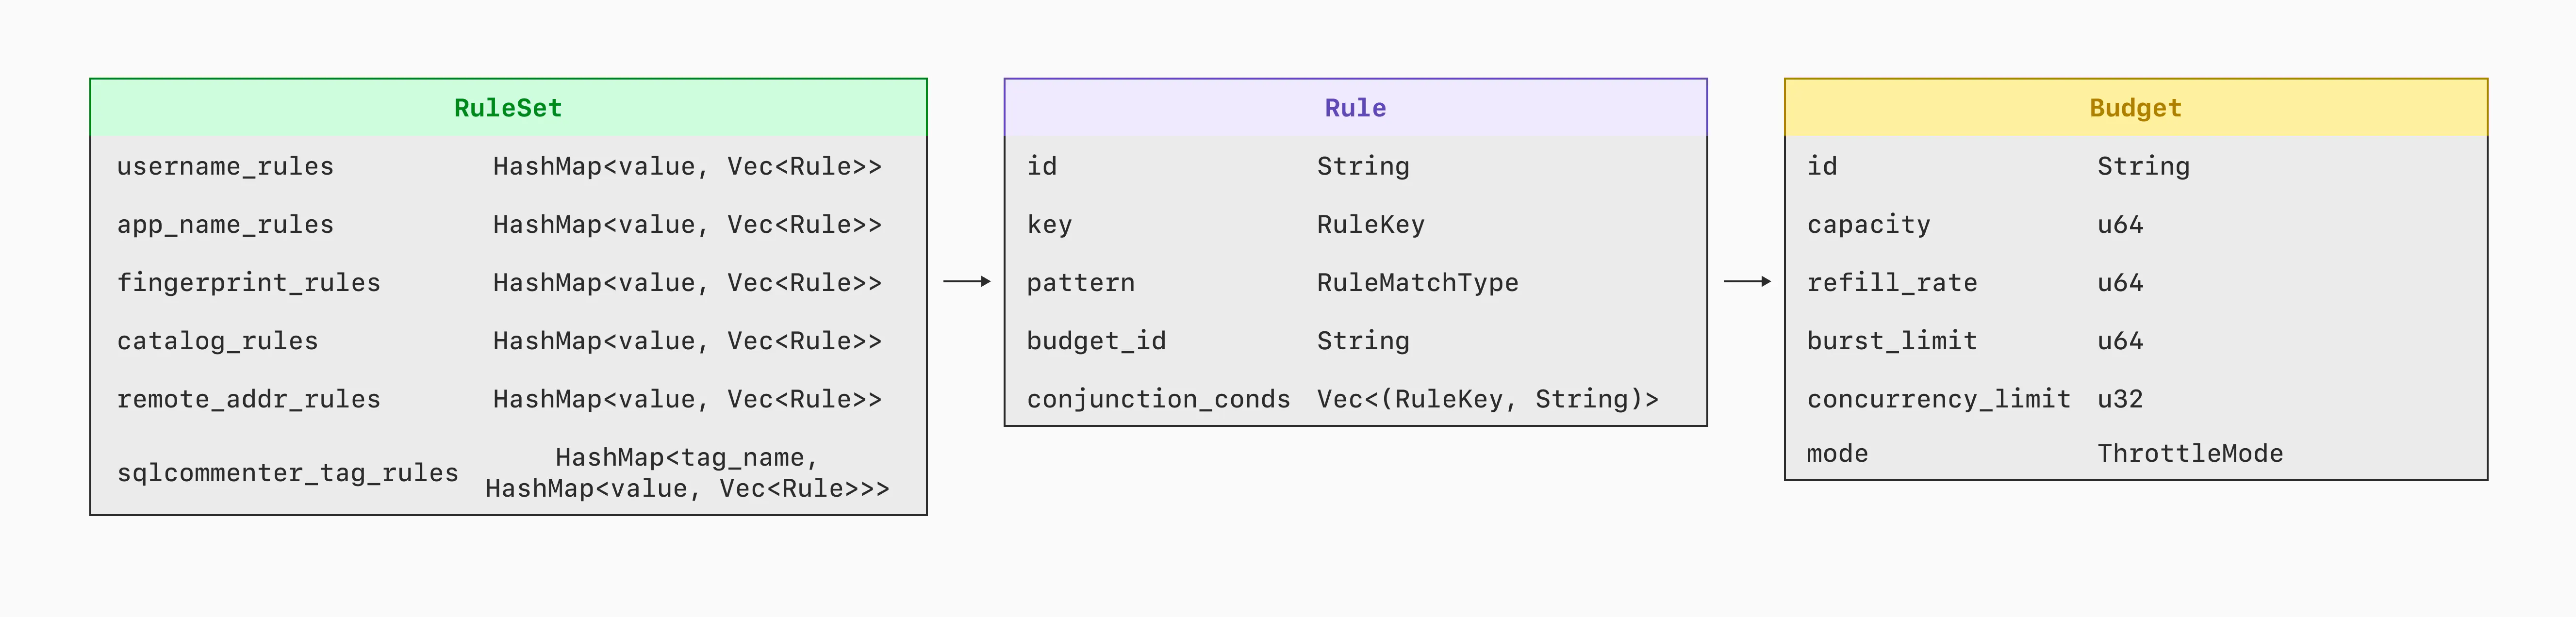
Each rule has the form <key, value>, and it matches any query that has that same value for that same key. It's complicated a bit by the fact that value can be an IP address with a CIDR mask.
A rule set maps each <key, value> pair to a rule. Now, when a query comes in with metadata like username=postgres, app=commerce, controller=api, the rule set can quickly identify the rule for each of those pairs. Hence, for this query, there are just three lookups in the rule set, regardless of how many rules are configured.
Note that a rule set only identifies rules to consider. Each rule's budget is only checked if all its conditions match the query. A rule set is all about checking as few rules as possible. So, the sequence is: the rule set identifies a list of rules, that list is narrowed down to just the rules that actually match, and then the budgets for all the matching rules get checked to see if the query can proceed.
There are three exceptions to the O(1) target for identifying rules:
- Rules for the
remote_addresskey check for a match for each mask length. So if you have rules for ten different mask lengths, the rule set has to do as many as ten lookups to find the rule with the longest matching prefix. - Any conjunction rule — that is, a rule with multiple
<key, value>pairs ANDed together — may be identified as a candidate for queries that match any one of the<key, value>pairs in the rule. So if you have conjunction rules with overlapping<key, value>pairs, the rule set may identify several or all of them as candidates for each query. - It is possible to add multiple rules for the exact same
<key, value>pair. If you do that, any query with that exact<key, value>pair will get checked against all of those rules.
Applying new rules
Traffic Control is meant to be used both proactively and during incident response. For incident response, it's important that rules take effect quickly. And they do! Rules created or modified in the UI generally take effect at all database replicas in just 1-2 seconds. How?
Rules and budgets are stored as objects in the PlanetScale app. Any change to Traffic Control rules made in the UI or the API gets stored as rows in the planetscale database. Then it's serialized as JSON in the traffic_control.rules and traffic_control.budgets parameters for Postgres. Some Postgres parameters require restarting the server, but those two don't. So they cut the line and get sent immediately to postgresql.conf files on each database replica. Postgres reads the new config, and each worker process parses it into a rule set as soon as it completes whatever query it's executing. The rule set is in place before the next query begins.
One big advantage of using Postgres configuration files, rather than sending configuration over SQL connections, is robustness on a busy server. You may want new Traffic Control rules most urgently when Postgres is using 100% of its available CPU, 100% of its worker processes, or both. Changing config files is possible even when opening a new SQL connection and issuing statements wouldn't be.
Wrap up
Traffic Control uses the hooks and the performance measurements that Query Insights already implemented, then bolts on a system for sorting query traffic into budgets and warning or blocking queries that exceed those budgets. Each query can be warned or blocked if it's individually too expensive, if too many other queries are already running under the same budget, or if recent and concurrent queries under the same budget have consumed too many resources in the aggregate. Traffic Control implements a dynamic model per query pattern that leverages the existing Postgres planner to estimate the real-world cost of a query before it begins to execute. Leaky buckets impose limits on both traffic bursts and the long-term average fraction of server resources assigned to any individual budget.
Taken as a whole, these elements implement Traffic Control, which gives developers and database administrators powerful new tools to identify, prioritize, and limit SQL traffic.