As part of yesterday's Traffic Control launch, we made enhancements to the Insights query tagging feature for Postgres databases. Insights has supported query tags for some time, but they were previously only attached as metadata on individual notable query logs. With yesterday's release, tags are now present in aggregated query data, which enables powerful new capabilities. It's now possible to view the complete distribution of tags assigned to a query pattern, search queries by tag, and see a per-tag breakdown of database-level statistics. This blog post gives an overview of the feature, and digs into the details of how we implemented it.
Query tags are string key-value pairs that are included in query SQL using specially formatted SQL comments. For example, the following query has the controller and action tags attached.
select * from users
  where id = 1
  /* controller='users',
     action='show' */;
Typically tags are specified at the application level and applied automatically to all queries issued by the database framework you're using. Common examples are controller, action, job, or source_location.
In addition to tags set by the database client, Insights automatically adds the following tags to all queries:
application_name- set by the Postgres driverusername- the Postgres user executing the queryremote_address- the remote IP address
Feature Overview
This feature introduces three new surfaces where tag information can be seen.
Query Pattern Tags
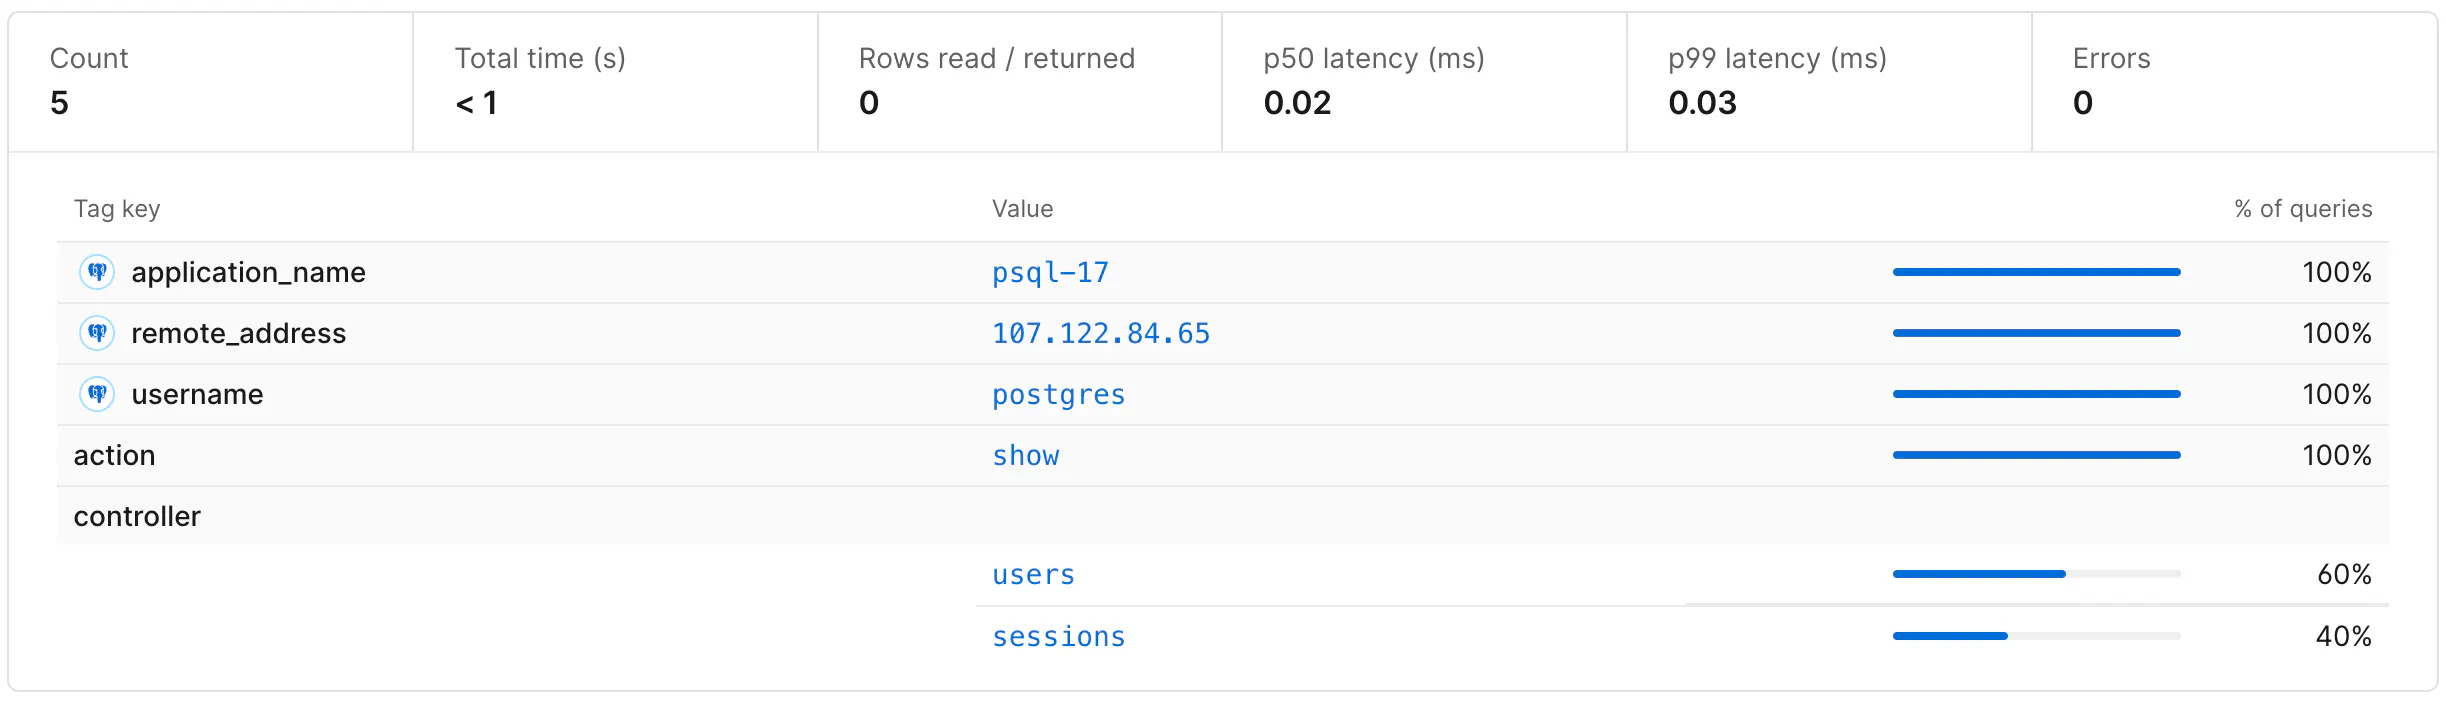
To see the set of tags associated with a given query pattern, click on a query pattern from the main Insights dashboard. This page lists the tags that have been submitted with a given query pattern over a particular time range, as well as the percentage of queries that included each tag value.
Database Tags
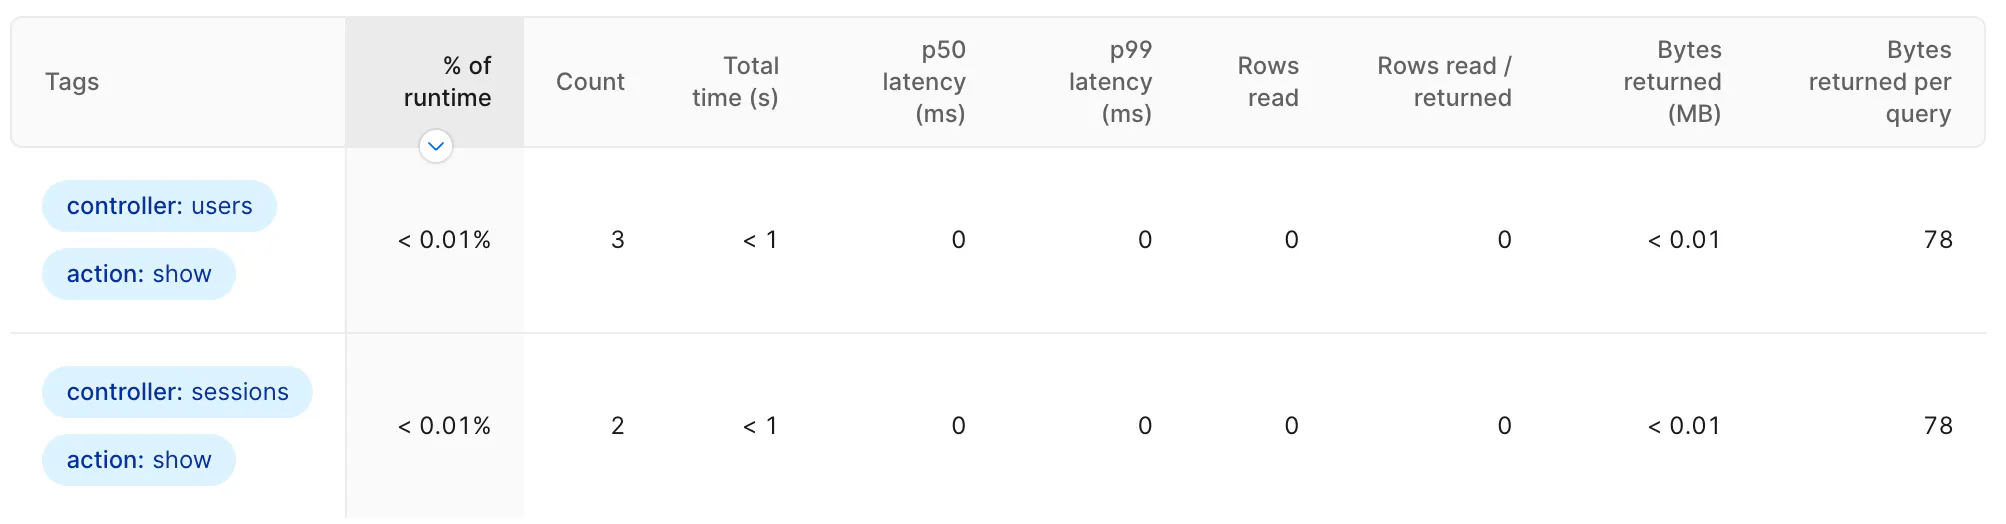
To see aggregate statistics for your entire database broken down by tag, go to the Tags section in the Insights sidebar and select the tag or set of tags that you want to view.
Query Filter
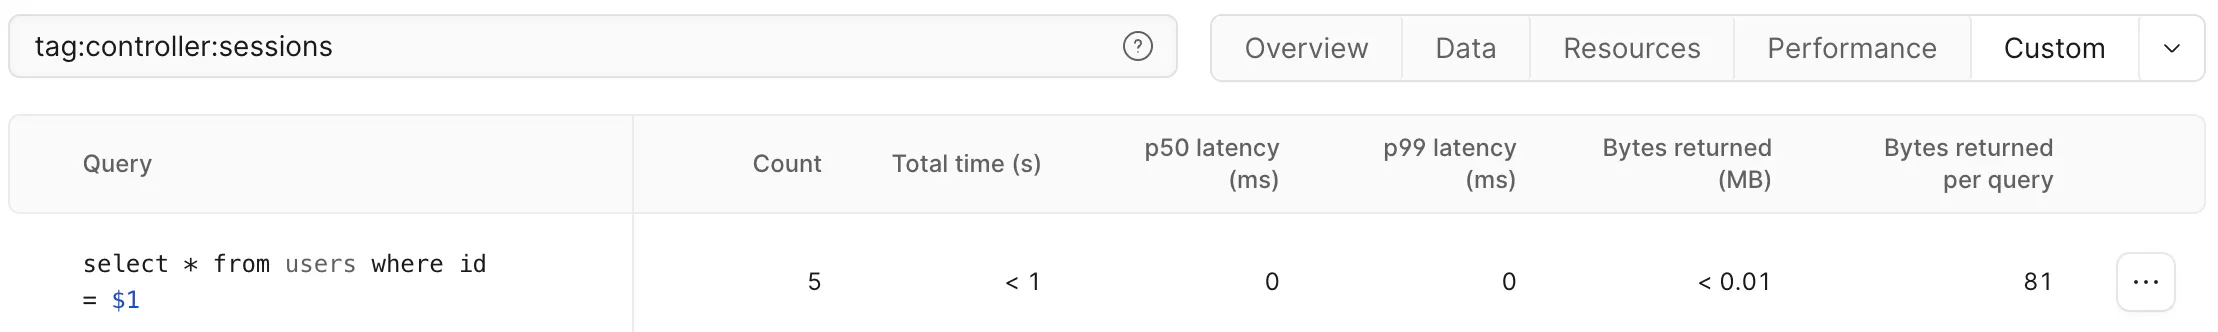
To see a list of query patterns that have a given tag value, go to the Insights dashboard and search for a particular tag with tag:MY_TAG:MY_VALUE. The returned query patterns and statistics are filtered to only queries with the specified tag pair.
Implementation
To understand how tagging works in Insights, it helps to understand the underlying data sources that power Insights. Query performance data is observed by the Insights Postgres extension, emitted to Kafka and written to ClickHouse. The extension publishes to two separate Kafka topics:
- Individual queries - any query reading more than 10,000 rows, taking longer than 1 second, or resulting in an error. One message is sent per qualifying query. This powers the Notable queries feature.
- Aggregate summaries - statistics like total query count, rows read, and cumulative query time. One message is sent for every query pattern every 15 seconds. This powers the majority of Insights including the query table, anomalies, and all query-related graphs.
Prior to this release, tag data was only attached to the individual query data stream. This adds important information to notable queries, but because the data wasn't present in the aggregate summaries, it wasn't possible to filter or group aggregate data by tag. Insights couldn't answer important questions like:
- What queries has this user executed?
- What percentage of my total query run time is coming from this controller?
- Which background jobs are executing this query?
Our goal with this release was to associate all query data with the relevant tags to make it possible to answer this class of questions.
To explore the various approaches for implementing tags, let's use the following query executions as an example:
select * from users where id = 1 /*controller='users'*/;
select * from users where id = 2 /*controller='sessions'*/;
select * from users where id = 3 /*controller='sessions'*/;
Since each of these queries has the same fingerprint (query with all literal values removed), without tags we would only need to send a single summary message. To include tags, we have several options. The first would be to continue sending only a single query summary event with a count of how many times each tag was observed. This would produce a summary message like the following (other stats fields are omitted):
{
	sql: "select * from users where id = ?",
	query_count: 3,
	total_time: "100ms",
	tags: {"controller=users": 1, "controller=sessions": 2}
}
This message tells us the given query was executed three times - twice from the sessions controller and once from the users controller - and had a cumulative execution time of 100ms.
At first glance, including tags in this manner is an attractive option. It's simple to implement - we just accumulate tags along with the other aggregate stats - and it doesn't increase the number of events that need to be emitted and stored. It has a serious shortcoming, however: it's not possible to attribute aggregated stats to any individual tag. For example, it's not possible to know the total time of queries emitted from just the users controller, because we can't tell what portion of the 100ms was associated with controller=users. The summary data for one tag is permanently combined with the data from all tags.
To overcome this limitation, we can instead emit a separate aggregate summary message for each set of unique tags. In our example this would mean we emit two separate messages to the insights pipeline:
{
	sql: "select * from users where id = ?",
	query_count: 1,
	total_time: "20ms",
	tags: {"controller": "users"}
}
{
	sql: "select * from users where id = ?",
	query_count: 2,
	total_time: "80ms",
	tags: {"controller": "sessions"}
}
This approach makes it possible to fully disambiguate aggregated statistics based on the attached tags. We can tell that the users controller was responsible for exactly 20ms of total execution time and the sessions controller was responsible for exactly 80ms.
This comes at a cost though: we have to emit a separate message for each unique tag combination. This can be problematic for high-cardinality tags (tags with a large number of distinct values). Consider a customer that has set a request_id tag on all of the queries issued from their web tier. Where we previously would be able to collapse 500 user-lookup queries into a single summary message, we now have to send 500 messages because they each have a unique request_id. In the worst case, this means that the summary data stream must send one summary message per query execution, and we've lost all of the scalability advantages of aggregating query statistics. For large clusters executing millions of queries per second, this would be prohibitively expensive to process and store, and would consume considerable resources on the database host where telemetry data is emitted.
To prevent this from overwhelming the pipeline, we implemented several strategies to dynamically reduce the cardinality of tags and therefore decrease the number of messages that must be handled by the Insights pipeline.
Cardinality Reduction
The core idea is simple: when a tag (or set of tags) would result in sending too much telemetry data, we collapse that tag by replacing specific values (like request_id="a" and request_id="b") with a value that indicates it has been removed: request_id=*. This lets us more aggressively merge aggregates and reduce the total number of messages sent, while ensuring that we're capturing 100% of the summary data.
We employed two separate approaches for tag collapsing.
Per-tag Limits
This mechanism tracks the number of unique values seen for each tag key, scoped per query pattern. If that count exceeds a predefined limit (currently 20), we proactively collapse that key for all queries for the next hour. This catches inherently high-cardinality tags like request_id or user_id.
An important part of this approach is that cardinality is monitored per query pattern and not globally. Consider the source_location tag that contains the file and line number showing where the query was initiated in the client app. Overall this tag is high-cardinality, because each query pattern likely has its own unique value for source_location, but it is highly correlated with the query pattern so it doesn't actually result in additional messages being sent to the pipeline - we are already sending a separate query summary message for each query pattern. Monitoring cardinality per-pattern allows high-cardinality tags that are highly correlated with query pattern to pass through without being collapsed.
Per-interval Limits
Within each 15-second interval, we track all aggregates keyed by their unique set of tag key-value pairs. Because we must emit a message for each unique combination of tags, even individually low-cardinality tags could produce an unacceptably large number of combinations of tags. For example, if a query pattern has 6 tag keys that each have 10 distinct values, there could be 10^6 individual tag combinations. To prevent an explosion in the number of messages that must be tracked, we perform dynamic cardinality reduction on a per-interval basis for any individual query pattern that has more than a fixed number of tag combinations.
To reduce the combined cardinality of a given set of aggregates, we find the highest cardinality tag and collapse it (replace all values with a single value). We successively perform this operation until the number of aggregates is beneath the fixed threshold (currently set to 50 in production).
To illustrate this operation, consider five executions of the same query pattern.
select * from users where id = ? /*controller='users',    host='app-1'*/
select * from users where id = ? /*controller='users',    host='app-2'*/
select * from users where id = ? /*controller='sessions', host='app-3'*/
select * from users where id = ? /*controller='sessions', host='app-4'*/
select * from users where id = ? /*controller='sessions', host='app-1'*/
Without any limits, this produces five separate aggregate messages. To reduce the aggregate message count, we identify that the host tag has the highest cardinality (4 unique values) and replace all of its values with a placeholder and merge the remaining results. This yields only two combinations that must be emitted to the pipeline, one for each of the two unique controller tag values.
Tracking Tag Collapsing
When a tag must be collapsed due to either of the cardinality limitation mechanisms, we record the fact that the key has been collapsed in the emitted aggregate message. This allows us to detect when collapsing has occurred and display a message noting the percentage of tag values where the value is unknown.
Conclusion
Query tagging is a powerful feature. Being able to slice your Insights data by arbitrary tags gives you a much clearer picture of your database performance. We're excited for you to try it.