












For relational databases, creating and maintaining the right indexes for your workload is critical to ensuring good performance. Unfortunately, creating good indexes isn’t a one-time activity performed only when adding new tables. Tables grow, schemas evolve, and, most importantly, the queries sent by your application change over time. To ensure your application’s queries are indexed correctly, it’s important to be able to observe which indexes are (or are not) actually being used.
To help with this, we’ve added a new capability to PlanetScale Insights: index usage tracking. With this feature, it’s easy to see which indexes your queries are using and how that usage is changing over time.
Let’s dive right in.
Feature walkthrough
To see the index usage graph for a query pattern, go to your insights dashboard, click on a SELECT query, then click on the new Indexes tab in the upper right hand corner. Here’s an example of what the index usage page looks like.
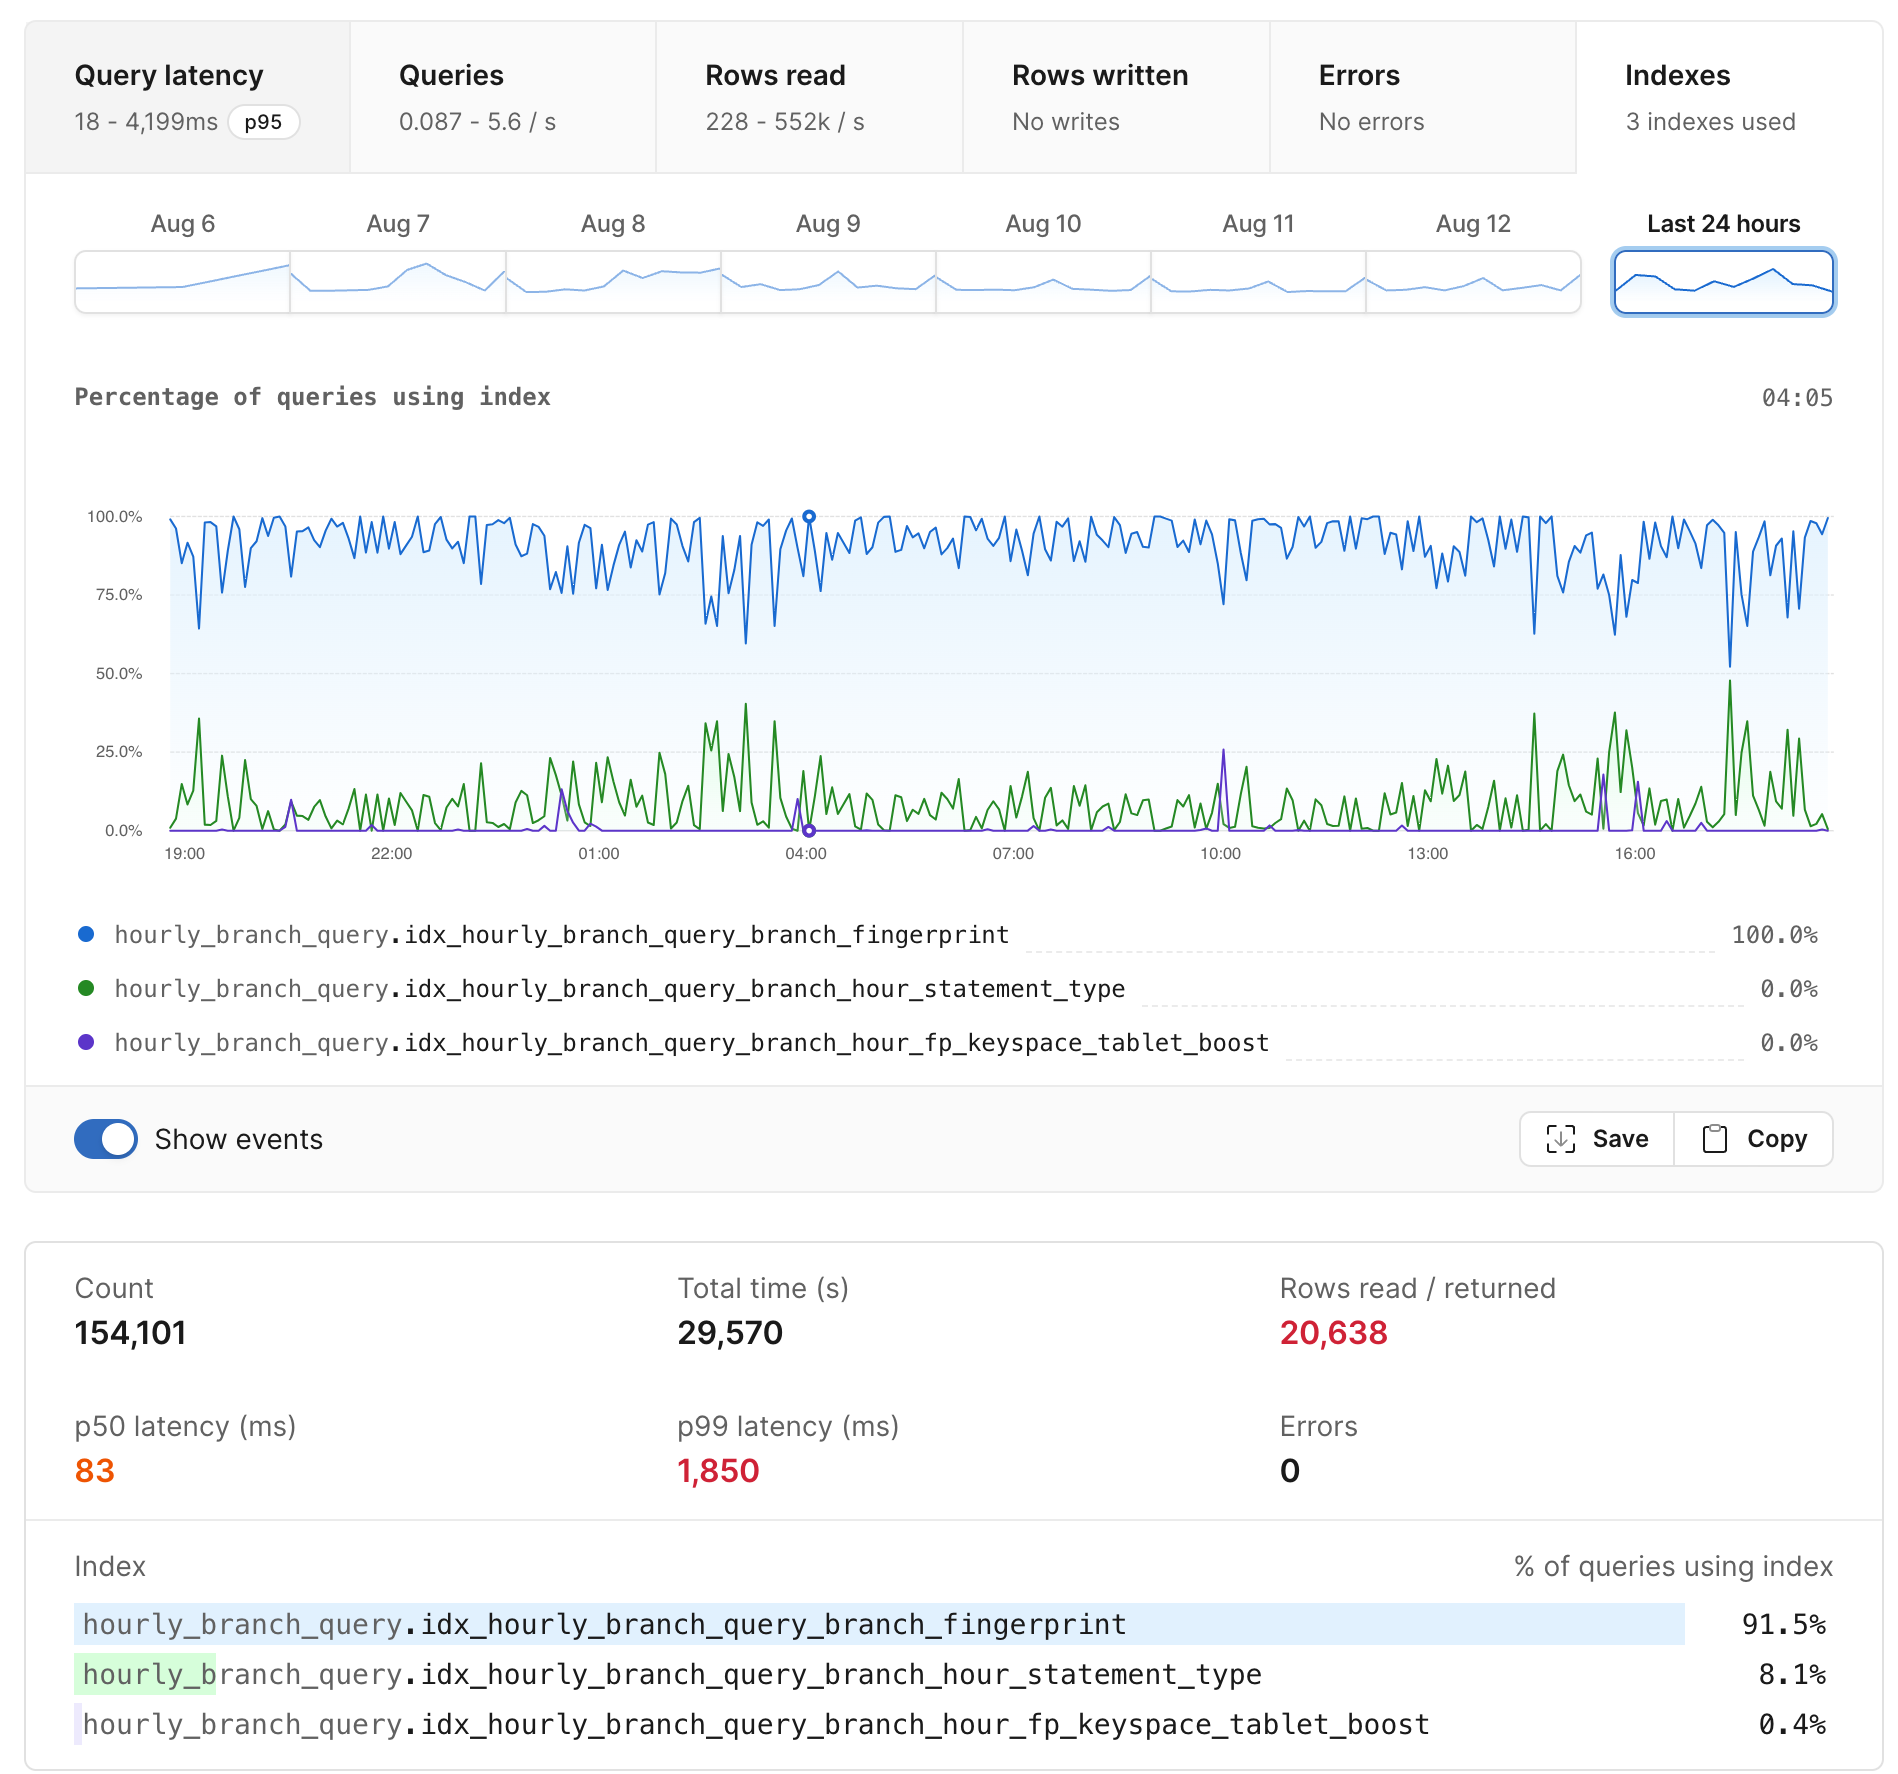
The main graph shows a time series of the percentage of queries that use each index. The bar graph at the bottom shows cumulative usage over the entire time span. In the example above we see that MySQL is selecting from one of three indexes each time it executes the query pattern.
This view shows us which indexes a given query is using, but we can also ask the question in reverse: which queries are using a given index? To answer this, go to the main Insights page, and add index:$TABLE_NAME.$INDEX_NAME as a search term. For example:
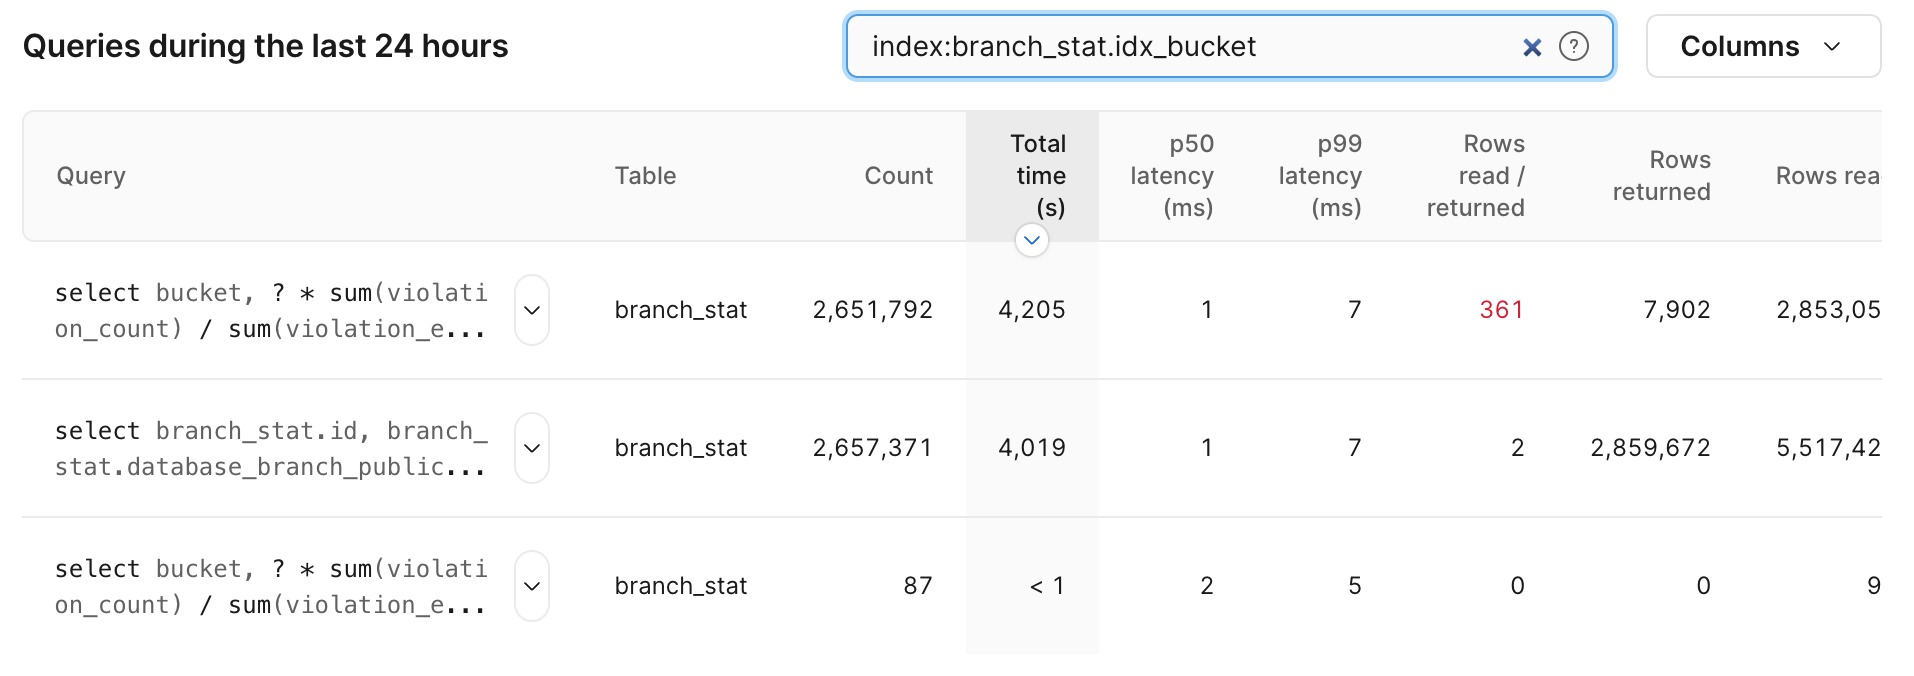
Note: index information is only reported for
SELECTqueries, so it’s important to independently verify that indexes aren’t being used inUPDATEorDELETEqueries before removing an index.
We can also use insights to find a list of query patterns that use no indexes at all by entering indexed:false in the insights search box.

These index-related search terms can be combined with existing search terms. For example, to find a list of all unindexed queries that have been executed at least a thousand times in the last 24 hours and have a p50 response time over 250ms, you’d enter indexed:false query_count:>1000 p50:>250.
To learn more about how and why we implemented this feature, read on.
Before building a new system to monitor index usage, we evaluated the available tools for monitoring and understanding index usage. We’ll explore these tools first to motivate the decisions we made in designing Insights usage tracking.
The first tool most developers reach for when trying to understand index usage is explain, and for good reason. Explain is an incredibly powerful tool that exposes a wealth of information about how MySQL executes your query, including index usage. It’s great for troubleshooting a problematic query or testing out a new index. Unfortunately, explain can only provide information for queries you explicitly provide. It doesn’t record information for the actual queries processed by MySQL, so it can’t show how a query pattern is using indexes over time, across shards, or with the different query parameters from your production workload.
For aggregate index usage from your production environment, MySQL’s built in performance schema provides counters for how many times each index has been used in the table_io_waits_summary_by_index_usage table. This is a useful facility, but comes with a number of limitations that make it difficult to use in practice:
- Stats are in the form of global counts for each MySQL server, and are reset when MySQL is restarted. This means you can’t see usage trends over time, and counts may be reset at any time.
- Counters are only provided at the index level, so it’s not clear which query patterns are using which indexes.
To make it easy to understand index usage patterns, we wanted a system that:
- Breaks down index usage information per query pattern.
- Stores index usage as a timeseries, so it’s obvious when something has changed.
- Provides cumulative data for all your queries, without sampling or extrapolating based on explain plans.
With these goals in mind, our first task was to extract query index usage information from MySQL. Since PlanetScale databases exclusively use the InnoDB storage engine, we were able to focus our efforts there. The InnoDB storage handler includes an index-initialization function that MySQL calls (once) prior to using an index in a query. By recording the index name passed to this function in a per query data structure, we’re able to find the set of all indexes used by each query. When the query is finished we return the list of used indexes in the final packet returned by MySQL to the client, and ultimately to VTGate, Vitess’s query proxying layer.
With the per-query index information in VTGate, we aggregate index usage information per query-pattern and send it into the Insights pipeline every 15 seconds. This approach allows us to aggregate the time series count of indexes used for 100% of queries with negligible overhead in MySQL.
Try it out now
Index usage information is available on all PlanetScale databases. We’ve found this feature useful in managing our own databases and we hope you do too.