









I’ve got Netlify Analytics turned on for a few of my websites.
I use it send myself a little daily digest that alerts me when folks link to my writing, be it an individual sending me a few referrals, a newsletter sending me a few hundred, or Hacker News sending me thousands.
But sometimes I want to know more than, “What happened with traffic in the last 24 hours?”
Sometimes I want to know, “What happened with traffic in the last month?” I can log in to Netlify to answer that question.
Sometimes I want to know, “What happened with traffic in the last six months?” Netlify doesn’t have an answer for that because they only store the last thirty days of traffic data.
I’ve known about this limitation for years and always thought, “I really should just start saving that data for myself.”
But, you know, laziness. How bad do I really want it? The answer, it seems, was “I only want it if it’s _easy_”.
Enter Val Town.
Val Town makes this kind of task easy. Each “Val” is it’s own little bucket of scoped computing primitives for just such a task:
All of this might seem like overkill for a single-script task like mine. But I like it. The scoped nature of each of these primitives makes composition easy without the kind of entanglement I’d have to fight to keep isolated if I were co-locating this task with other small tasks.
I don’t want to think about a shared schema for this task and whatever other tasks I might think of in six months. I don’t want to have to reason about evolving an architecture and maintaining a codebase of miscellaneous, unrelated tasks. Vals are perfect for this.
So the way I have this setup is: run the .ts file every 30 days which fetches the last 30 days worth of analytics data from Netlify and stores it in SQLite. (You can see my Val here.)
At that point, I have the data I need to curiously ask any question, e.g.
The answers to these questions get more and more interesting over time, as the long tail of web dynamics play out: search engine traffic, serendipitous rediscovery of old posts in light of new trends, etc.
“But how do you actually view the data you’re storing to get answers to these kinds of questions?”
Great question. Val Town has a UI where I can see the raw data I’m storing (which I chose to store exactly as I got it from Netlify, rather than doing some pre-processing first):
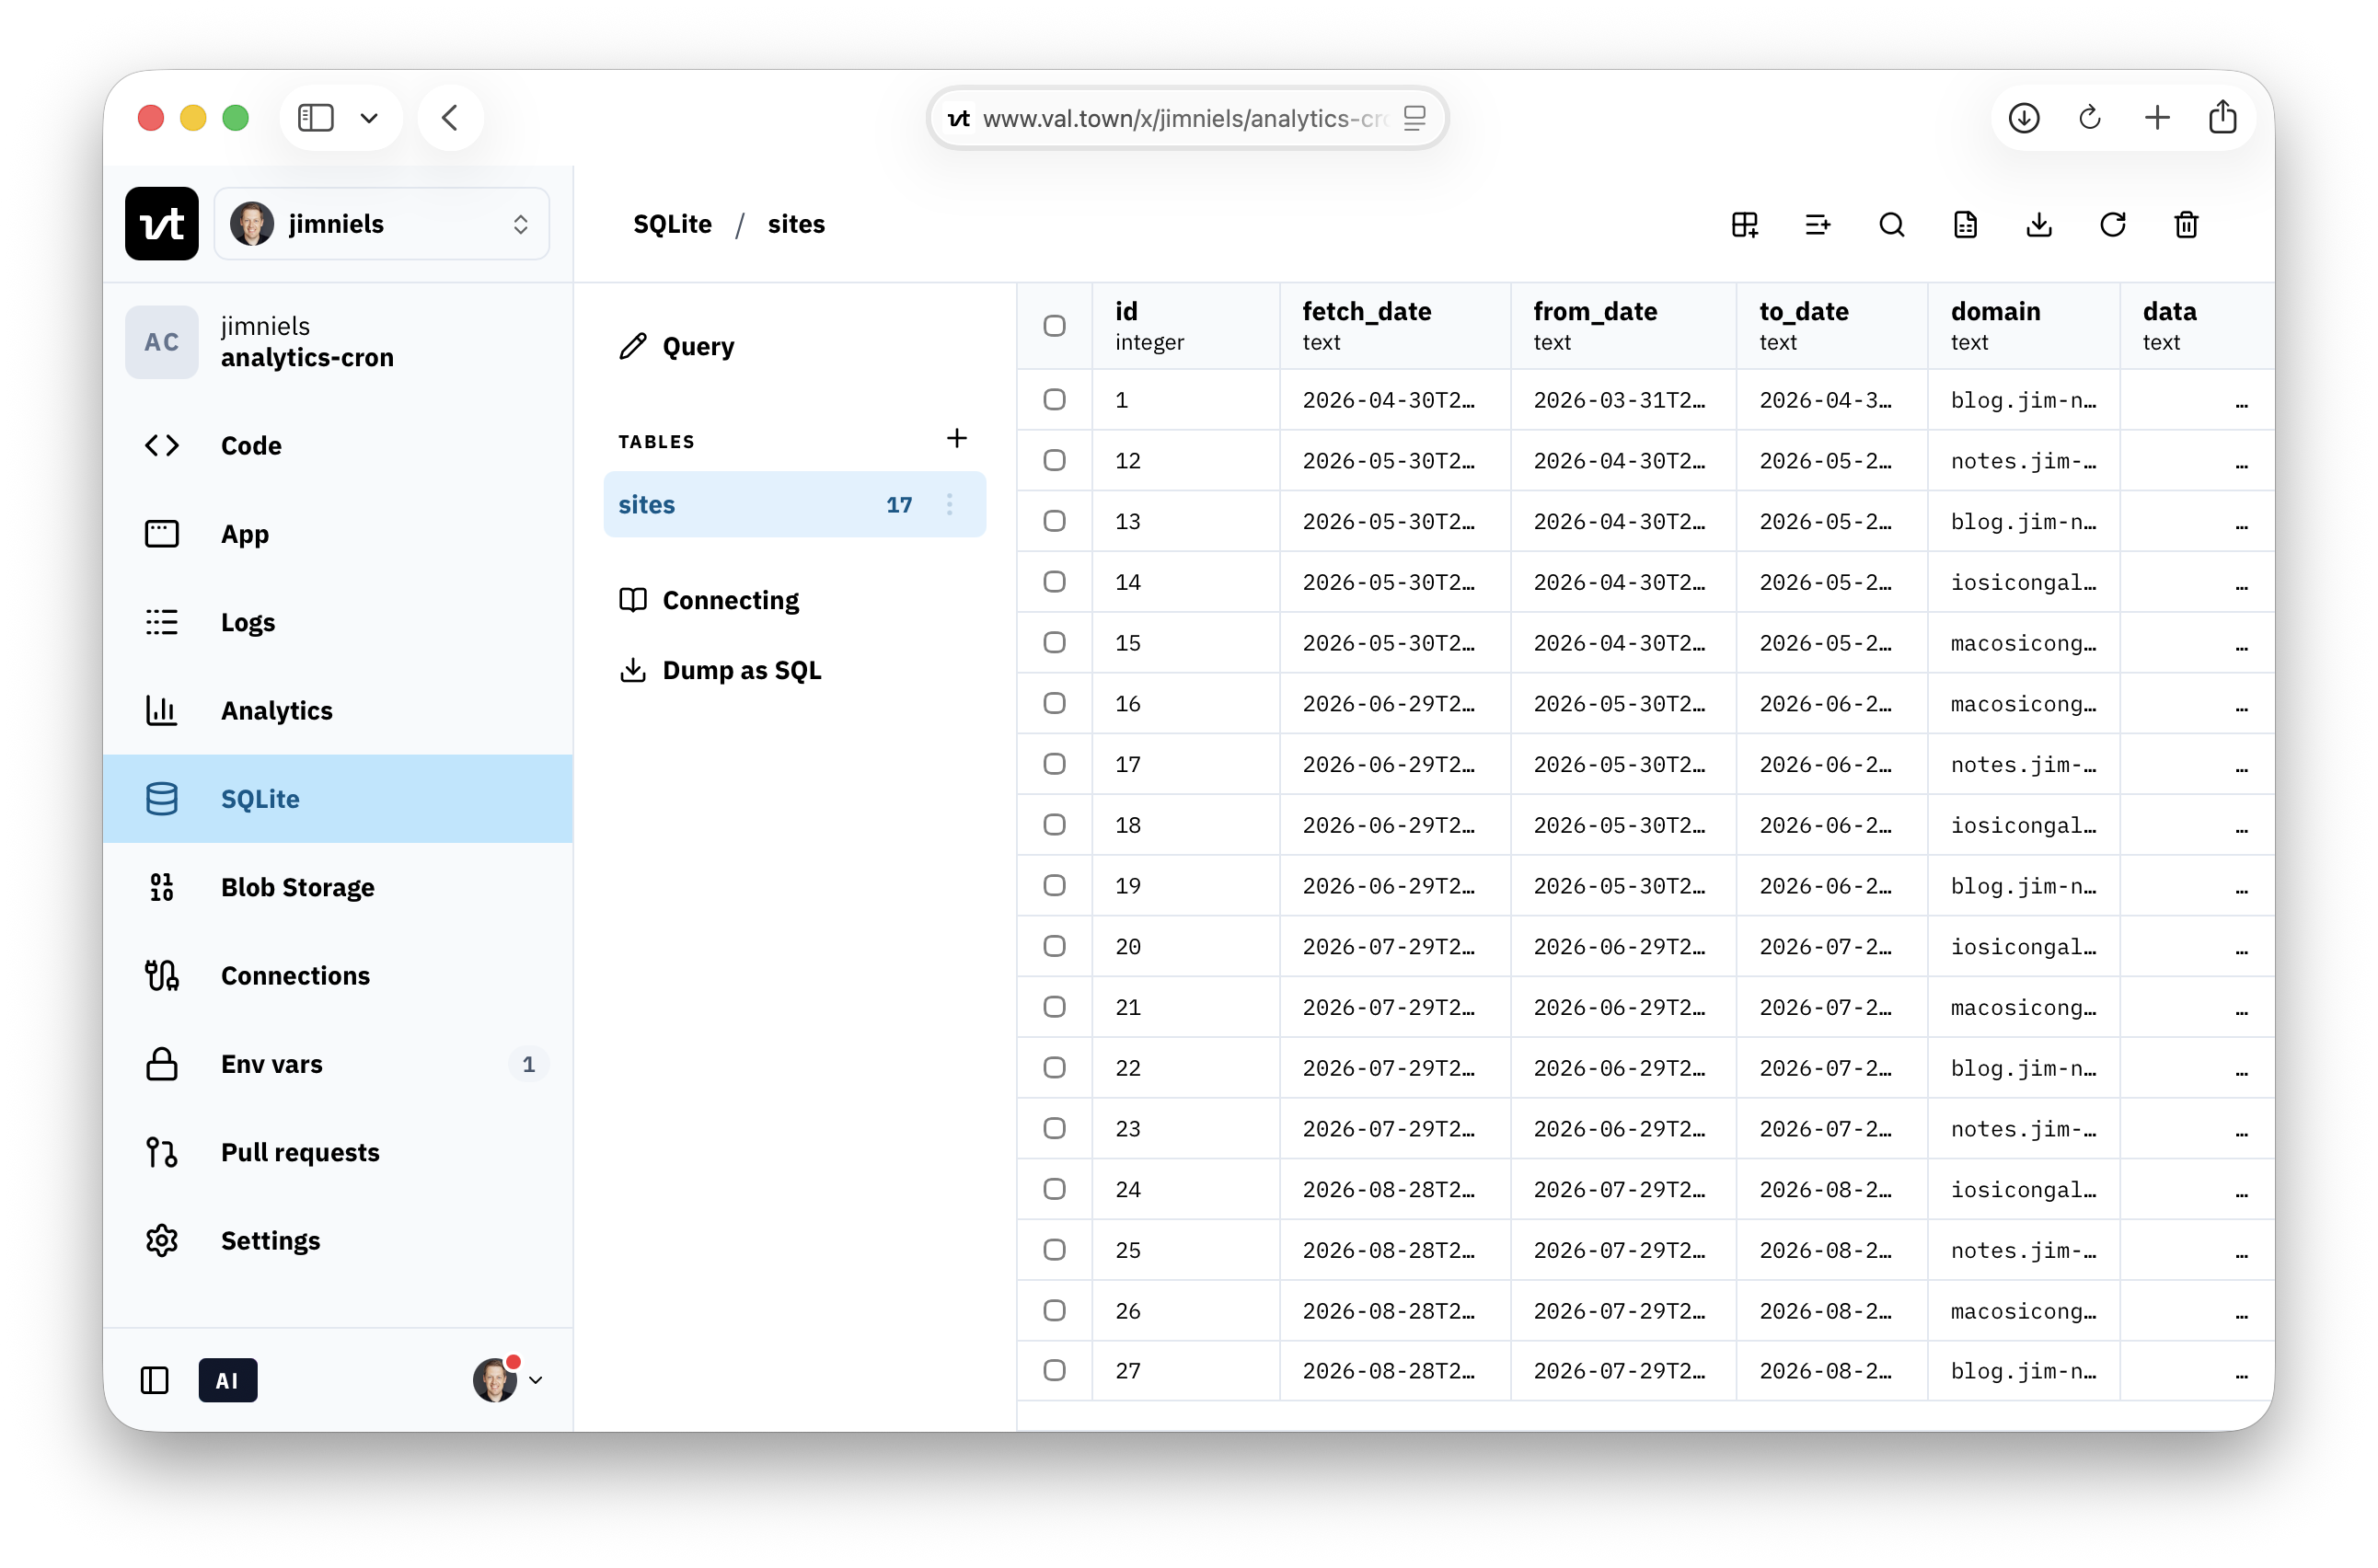
But that’s not very useful. I need to parse that data and turn it into some kind of useful analysis.
And you know what tool is super useful for understanding data? A spreadsheet.
If I were using Excel, I’d probably have to figure out a way to dump the SQL, convert the JSON to some kind of CSV, then import it. And every time I wanted to see the “latest” data, I’d have to run that workflow.
Enter Quadratic.
Val Town has an API where I can fetch the latest data via code, and Quadratic is a spreadsheet that runs code. So seeing “the latest data” from my pipeline in Val Town is as easy as pressing a “re-run code” button in Quadratic.
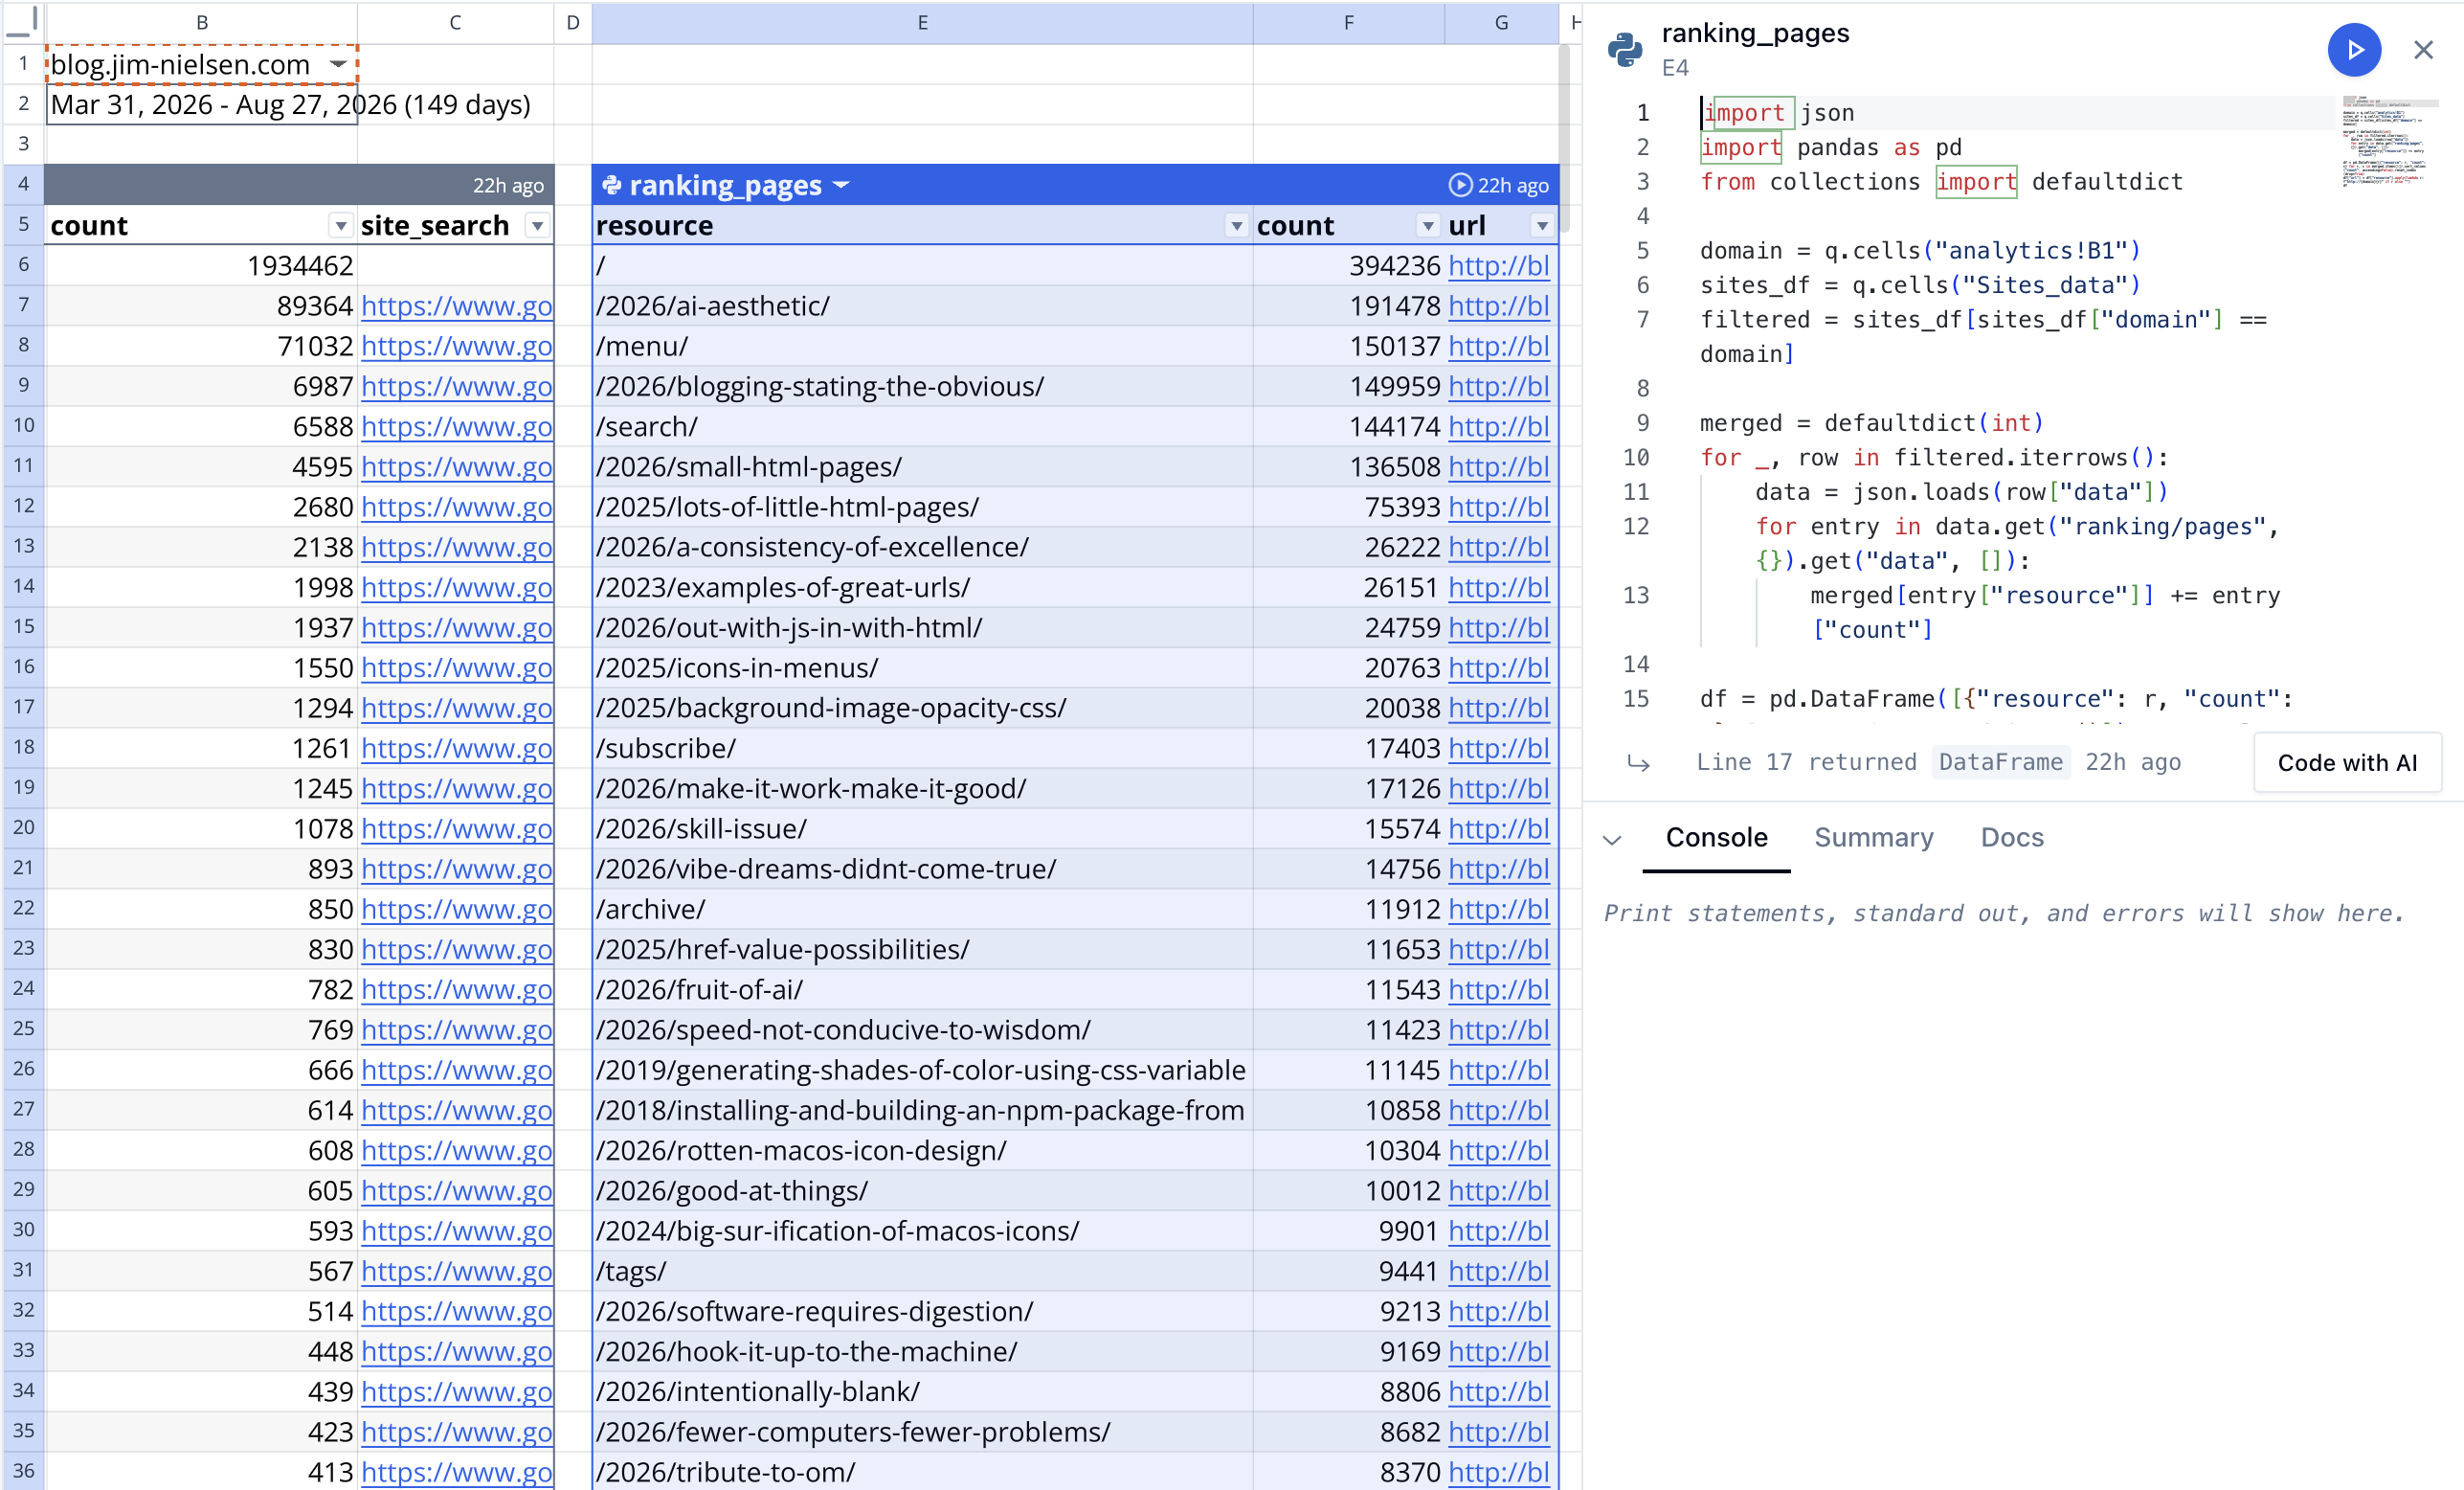
Quadratic serves as a kind of “front-end” to my data pipeline. Easy to pull the raw data, transform it however I need, and create a “dashboard” I can revisit whenever I want to see the latest insights or ask new questions.
And, since I’m storing data for a couple different sites in Netlify, I have a single cell in my spreadsheet where I can swap out the domain — say from blog.jim-nielsen.com to iosicongallery.com — and the entire dataset and dashboard redraw.
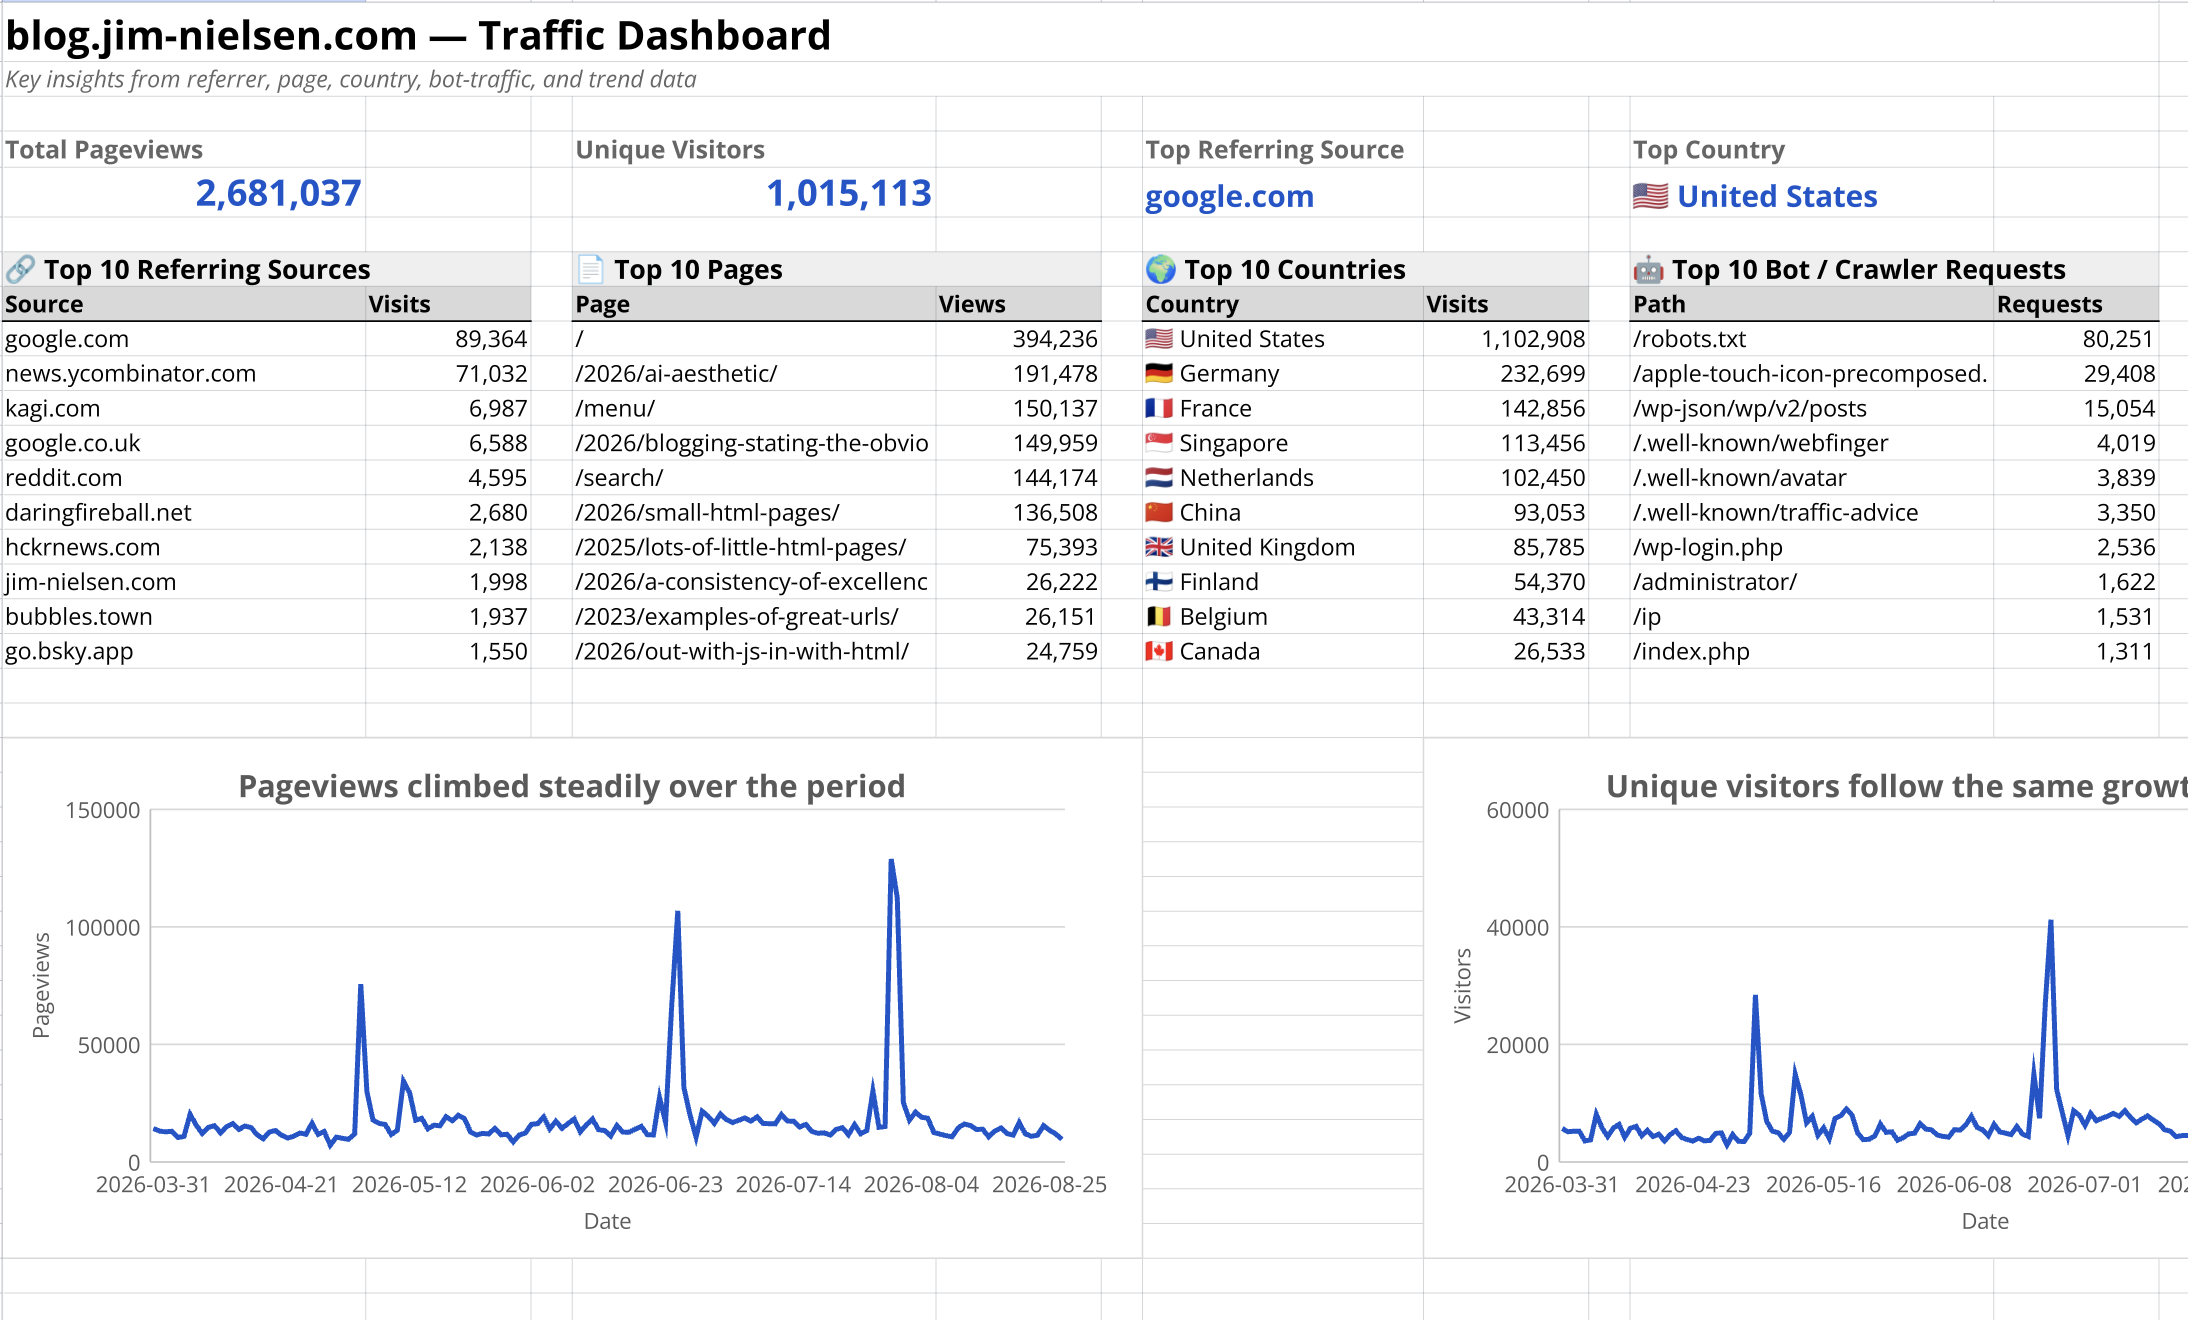
I know, I know. There are lots of products for stuff like this. And there’s probably a million other ways to do what I’m doing, all peculiar in their own way. But this one is mine.
And now I can sleep at night knowing that every 30 days my little Val Town robot is gonna go store the last 30 days of data that Netlify is throwing away.
One person’s garbage is another person’s treasure trove of data.
此内容由惯性聚合(RSS阅读器)自动聚合整理,仅供阅读参考。 原文来自 — 版权归原作者所有。