




We’ll show you how to create simple KPI dashboards using Google Sheets and our export history CSV feature.
Overview
If you’re monitoring multiple pages, you can make use of the generated GTmetrix data in more ways than just in the GTmetrix web application.
View GTmetrix + Google Sheets Example
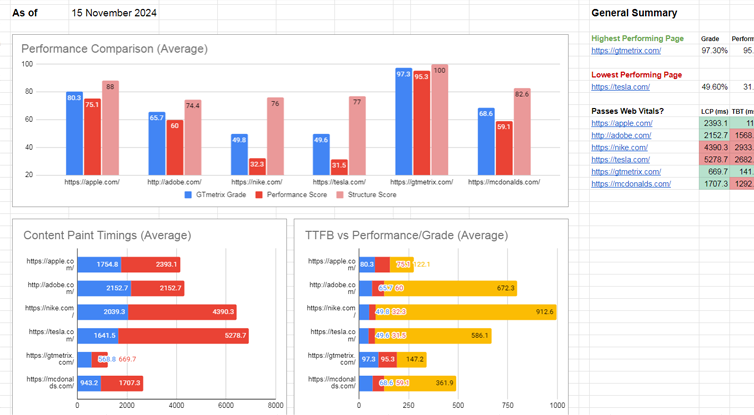
Create your own KPI Dashboard with Google Sheets and GTmetrix History exports.
We’ll show you how you can import this data using =IMPORTDATA("linktocsv.csv") to do a simple KPI dashboard, with an example for you to customize.
With our history export “Link to CSV” feature, you can get a direct link to performance history data and import it to Google Sheets (or any other supporting tool) and have it dynamically updated with the latest report data.
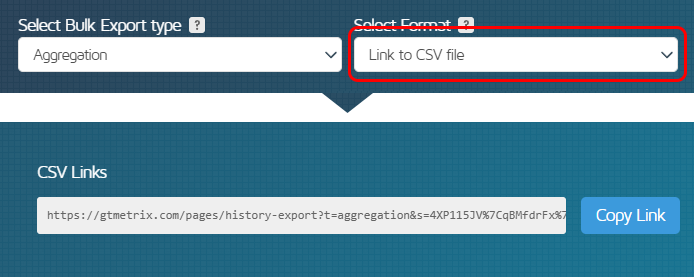
With our Link to CSV file feature, you’ll get a single URL to the CSV file containing all selected pages and desired metrics.
Setting up the Import
It’s simple to get your GTmetrix Report History imported into a sheet. Here’s how to get started:
1) Ensure you have a GTmetrix API Key generated
To ensure your link to CSV is accessible, you’ll need to generate an API key.
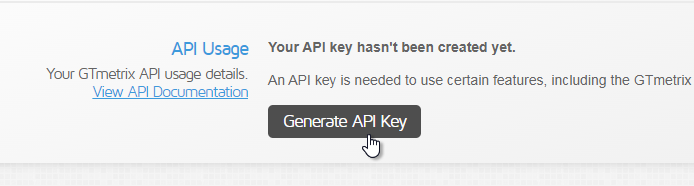
Generate your API key in your Account page.
Visit your Account page and generate one if you haven’t already done so.
2) Export GTmetrix Report History for desired reports
Choose the GTmetrix Report you wish to export history for. You can do this in multiple ways:
- Single Report
- View a single GTmetrix Report and visit the History Tab
- Click Export History
- Select “Link to CSV file” as the format
- Copy the link
- Bulk Reports
- On the Dashboard (or Bulk Status Completed page), select reports you wish to export
- Click on the Bulk Actions dropdown, then “Export Reports”
- Select Collection or Aggregate depending on your needs
- Select “Link to CSV file” as the format
- Copy the link(s)
More on how to bulk export history data in our detailed article here.
3) Create a spreadsheet and import data
In Google Sheets, create a new sheet and in one of the cells, type the formula for importing data:
=IMPORTDATA("linktocsv.csv")
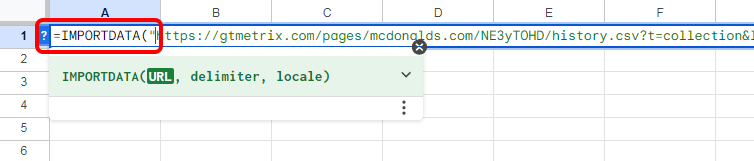
Use =IMPORTDATA() to dynamically import GTmetrix history data into your Google Sheet
where linktocsv.csv is the GTmetrix link to the CSV file obtained from the Bulk Export History widget.
Allow access when prompted to:

Allow Google Sheets to access data from external parties
That’s it! Your data should now be imported and updating dynamically:
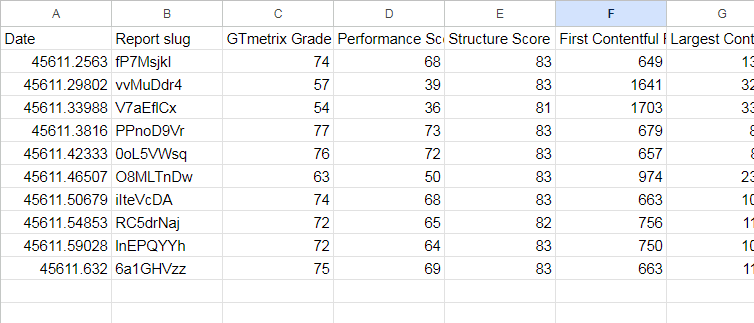
Your GTmetrix Report history data is now imported and updating dynamically
From here, you can use any spreadsheet formula function you wish on the GTmetrix data provided, create graphs and charts relevant to you, correlate performance with other data you may have on your website (Analytics, sales, etc.) – it’s up to you!
Important Notes
There are a few things to note and adjustments needed to get data to display correctly.
1) Take note of units
Units are displayed in their column headings, but remember that:
- Grades and Scores are in percentages
- Timings are in milliseconds (ms)
- Page Sizes are in bytes
2) Adjust format to display dates properly
Google Sheets will attempt to display dates as some odd number value instead of a formatted date.
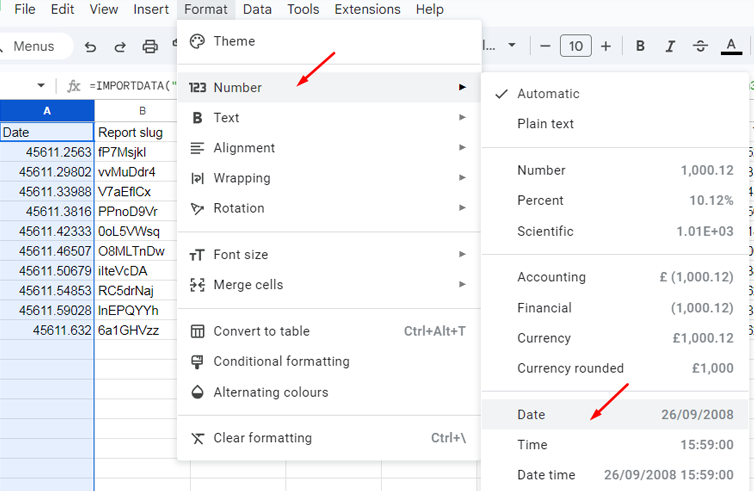
Change the cell format for the Date column to display dates properly
You can change the format of the Dates column to ensure dates are displayed correctly by selecting the column, clicking on Format -> Number -> Your preferred date format.
Example Google Sheet
We created a simple KPI Dashboard using Google Sheets and some popular domains:
View GTmetrix + Google Sheets Example
Feel free to duplicate this sheet and add your own data, charts and visualizations!
Are you using our history CSV in an interesting way?
Let us know! We have users integrating their history CSV file with Google Sheets/Excel graphing, internal tracking and BI tools, Google Drive linking and more.
Get more history visualization and longer data retention
Keep track of your performance history and track trends over time.
Get more history visualization and longer data retention
Keep track of your performance history and track trends over time.
Upgrade to GTmetrix PRO and get to more history visualization and longer report retention.