mtr is a great tool for troubleshooting connection problems and is one of the first things I install on a Linux machine. It is a traceroute on steroids. It provides additional information and can pinpoint problems with specific nodes on the network.
We'll focus on mrt on Linux and ICMP only, and I hope I can give you some insight into this simple but helpful tool.
To get started, run the following command to get an interactive/ live view of the results:
mtr DESTINATION
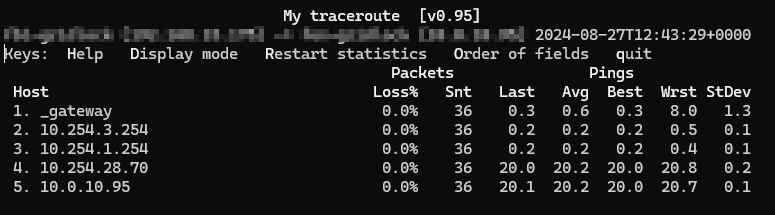
                               My traceroute  [v0.95]
mtr-server-name (192.168.10.175) -> dest-server-name (10.0.10.95) 2024-08-27T13:47:28+0000
Keys:  Help   Display mode   Restart statistics   Order of fields   quit
                                           Packets               Pings
 Host                                    Loss%   Snt   Last   Avg  Best  Wrst StDev
 1. _gateway                              0.0%   138    0.4   2.5   0.3  75.8  10.1
 2. 10.254.3.254                          0.0%   138    0.2   0.2   0.1   3.8   0.3
 3. 10.254.1.254                          0.0%   138    0.3   0.2   0.2   0.4   0.0
 4. 10.254.28.70                          0.0%   138   20.0  20.1  20.0  20.4   0.1
 5. 10.0.10.95                            0.0%   138   20.2  20.4  19.9  45.0   2.5
 Host          Loss%   Snt   Last   Avg  Best  Wrst StDev
 1. 10.11.0.1   0.0%    2   18.1  18.3  18.1  18.4   0.2
 [...]
Host - Hop information, which can be changedLoss% - percentage of packet lossSnt - number of packets/cycles sentLast - is the Round-Tip-Time (RTT) of the last packet sent.Avg - average RTT of all packets sentBest - fastest RTT of all sent packetsWrst - worst RTT of all sent packetsStDev - standard deviation of all sent packetsThis is the default output explained, and it is all I need often enough. However, you can change the columns: the order, remove and even add additional columns with -o FIELDS, --order FIELDS:
                                    │L │ Loss ratio          │
                                    ├──┼─────────────────────┤
                                    │D │ Dropped packets     │
                                    ├──┼─────────────────────┤
                                    │R │ Received packets    │
                                    ├──┼─────────────────────┤
                                    │S │ Sent Packets        │
                                    ├──┼─────────────────────┤
                                    │N │ Newest RTT(ms)      │
                                    ├──┼─────────────────────┤
                                    │B │ Min/Best RTT(ms)    │
                                    ├──┼─────────────────────┤
                                    │A │ Average RTT(ms)     │
                                    ├──┼─────────────────────┤
                                    │W │ Max/Worst RTT(ms)   │
                                    ├──┼─────────────────────┤
                                    │V │ Standard Deviation  │
                                    ├──┼─────────────────────┤
                                    │G │ Geometric Mean      │
                                    ├──┼─────────────────────┤
                                    │J │ Current Jitter      │
                                    ├──┼─────────────────────┤
                                    │M │ Jitter Mean/Avg.    │
                                    ├──┼─────────────────────┤
                                    │X │ Worst Jitter        │
                                    ├──┼─────────────────────┤
                                    │I │ Interarrival Jitter │
                                    └──┴─────────────────────┘
mtr gives us more options. I'll show you the most common options here:
-h, --help-4 # IPv4-6 # IPv6-n, --no-dns-b, --show-ips-I NAME, --interface NAMEChoose a source IP address:
:-a ADDRESS, --address ADDRESS
-c COUNT, --report-cycles COUNT # number of cycles-i SECONDS, --interval SECONDS # time in seconds between ICMP requests, default is 1 second-s PACKETSIZE, --psize PACKETSIZE # payload in bytes, inclusive IP+ICMP headers. A negative number will randomize the size up to that number-f NUM, --first-ttl NUM # set start TTL-m NUM, --max-ttl NUM # set maximum TTL, default is 30There are more specific options for MPLS, Autonomous System (AS) numbers and so on.
By default, mtr starts in interactive or live mode.
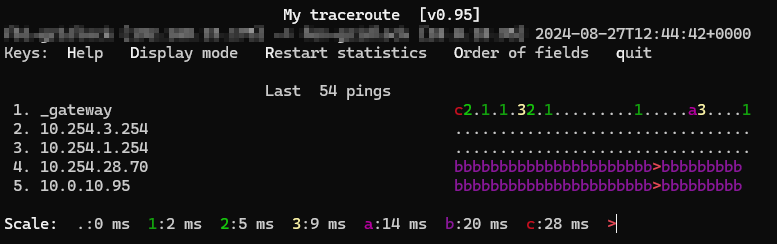
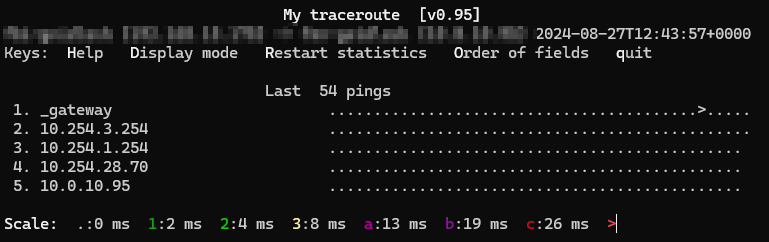
The most important shortcuts to control this mode are p to pause, SPACE to resume, r to reset all counters, n to toggle hostname resolution, d to switch the display mode, and h to show help and all other options.
The display modes you can choose:
This is not the official name, but it makes things a little bit clearer. If you want to automate your workflow and save the results to a file, use the -r / --report options. This will only show the results and let you pipe the results out. By default, the --report option sets the number of cycles to 10.
Use -F FILENAME, --filename FILENAME to import a list of hosts that get processed one after the other.
I haven't had any luck with showing the results live and saving them to a file at the same time. Instead, the following example runs 5 cycles, displays the final results in the terminal, and additionally saves them to a file named results:
user@pleasejustwork:~$ mtr -n -r -c 5 server-name | tee results
Start: 2024-07-08T15:57:45+0000
HOST: server-name                Loss%   Snt   Last   Avg  Best  Wrst StDev
  1.|-- 192.168.10.254             0.0%     5    0.4   0.3   0.3   0.4   0.0
  2.|-- 10.254.3.254               0.0%     5    0.2   0.2   0.2   0.3   0.0
  3.|-- 10.254.1.254               0.0%     5    0.3   0.3   0.3   0.4   0.1
  4.|-- 198.51.100.44              0.0%     5   13.2  13.6  13.2  14.8   0.7
  5.|-- 10.44.193.73               0.0%     5   13.5  13.5  13.5  13.6   0.1
  6.|-- 100.64.48.248              0.0%     5   13.5  13.8  13.5  14.0   0.2
  7.|-- 10.44.204.26               0.0%     5   18.9  18.9  18.9  19.0   0.0
  8.|-- 10.254.32.2                0.0%     5   19.0  19.0  19.0  19.1   0.0
  9.|-- 10.0.10.95                 0.0%     5   19.8  20.9  18.9  27.5   3.7

user@pleasejustwork:~$ cat results
Start: 2024-07-08T15:57:45+0000
HOST: server-name                 Loss%   Snt   Last   Avg  Best  Wrst StDev
  1.|-- 192.168.15.254             0.0%     5    0.4   0.3   0.3   0.4   0.0
  2.|-- 10.254.3.254               0.0%     5    0.2   0.2   0.2   0.3   0.0
  3.|-- 10.254.1.254               0.0%     5    0.3   0.3   0.3   0.4   0.1
  4.|-- 198.51.100.44              0.0%     5   13.2  13.6  13.2  14.8   0.7
  5.|-- 10.44.193.73               0.0%     5   13.5  13.5  13.5  13.6   0.1
  6.|-- 100.64.48.248              0.0%     5   13.5  13.8  13.5  14.0   0.2
  7.|-- 10.44.204.26               0.0%     5   18.9  18.9  18.9  19.0   0.0
  8.|-- 10.254.32.2                0.0%     5   19.0  19.0  19.0  19.1   0.0
  9.|-- 10.0.10.95                 0.0%     5   19.8  20.9  18.9  27.5   3.7
If you want to process the data in another system, it makes sense to save the results of mtr in a different format. mtr gives you some options:
-x, --xml
-C, --csv
-j, --json
Examples for the --csv format:
Mtr_Version,Start_Time,Status,Host,Hop,Ip,Loss%,Snt, ,Last,Avg,Best,Wrst,StDev,
MTR.0.95,1720455178,OK,server-name,1,192.168.15.254,0.00,5,0,0.46,8.96,0.33,43.25,19.16
MTR.0.95,1720455178,OK,server-name,2,10.254.3.254,0.00,5,0,0.26,0.25,0.22,0.26,0.02
MTR.0.95,1720455178,OK,server-name,3,10.254.1.254,0.00,5,0,0.23,0.71,0.23,2.29,0.89
MTR.0.95,1720455178,OK,server-name,4,198.51.100.44,0.00,5,0,13.33,13.48,13.24,14.27,0.44
MTR.0.95,1720455178,OK,server-name,5,10.44.193.73,0.00,5,0,19.36,16.65,13.57,22.82,4.24
MTR.0.95,1720455178,OK,server-name,6,100.64.48.248,0.00,5,0,17.40,15.67,13.96,18.63,2.19
MTR.0.95,1720455178,OK,server-name,7,10.44.204.26,0.00,5,0,21.51,21.03,19.04,22.59,1.57
MTR.0.95,1720455178,OK,server-name,8,10.254.32.2,0.00,5,0,18.90,19.87,18.90,21.62,1.22
MTR.0.95,1720455178,OK,server-name,9,10.0.10.95,0.00,5,0,19.07,22.28,19.07,33.95,6.53
So, I hope you found this short primer helpful and can use it in your next troubleshooting session.
此内容由惯性聚合(RSS阅读器)自动聚合整理,仅供阅读参考。 原文来自 — 版权归原作者所有。