




One of the main frustrations I have with Claude Code (or any coding agent) is its over-reliance on grep-style code search while it is working, when actually there are far more effective ways to do this with static code analysis.
This leads to many problems you'll probably be familiar with:
Of course, if you have used a statically typed language you'll know this is a solved problem, with very rich static analysis in IDEs allowing autocomplete and advanced refactoring in a few keystrokes.
I'm going to focus on the dotnet ecosystem in this article I'll link some options for other languages.
While I think there is a really interesting potential with using for MCP for this, I wanted to get started pretty quickly. I've used the Roslynator CLI before in CI/CD and thought it'd be perfect for this.
If you're not familiar with Rosyln it's the open source compiler for C# that Microsoft maintains (think of it similar to tsc for TypeScript, or CPython for Python). There is an awesome CLI tool called Roslynator which provides a CLI interface for performing static analysis on your project(s).
It's also very easy to use, and therefore very easy to add to your CLAUDE.md file (or equivalent).
roslynator list-symbols
This single command gives you every public method, property, and field in the assembly, complete with their full type signatures and generic constraints. You'll see extension methods along with their true locations (no more hunting through random static classes), plus all the assembly metadata and documentation comments that come with the package. It's essentially a complete X-ray of the API surface that Claude Code can actually read and understand.
I built a very simple dotnet console app using the SixLabors ImageSharp package. Running the command on my project gives output like this:
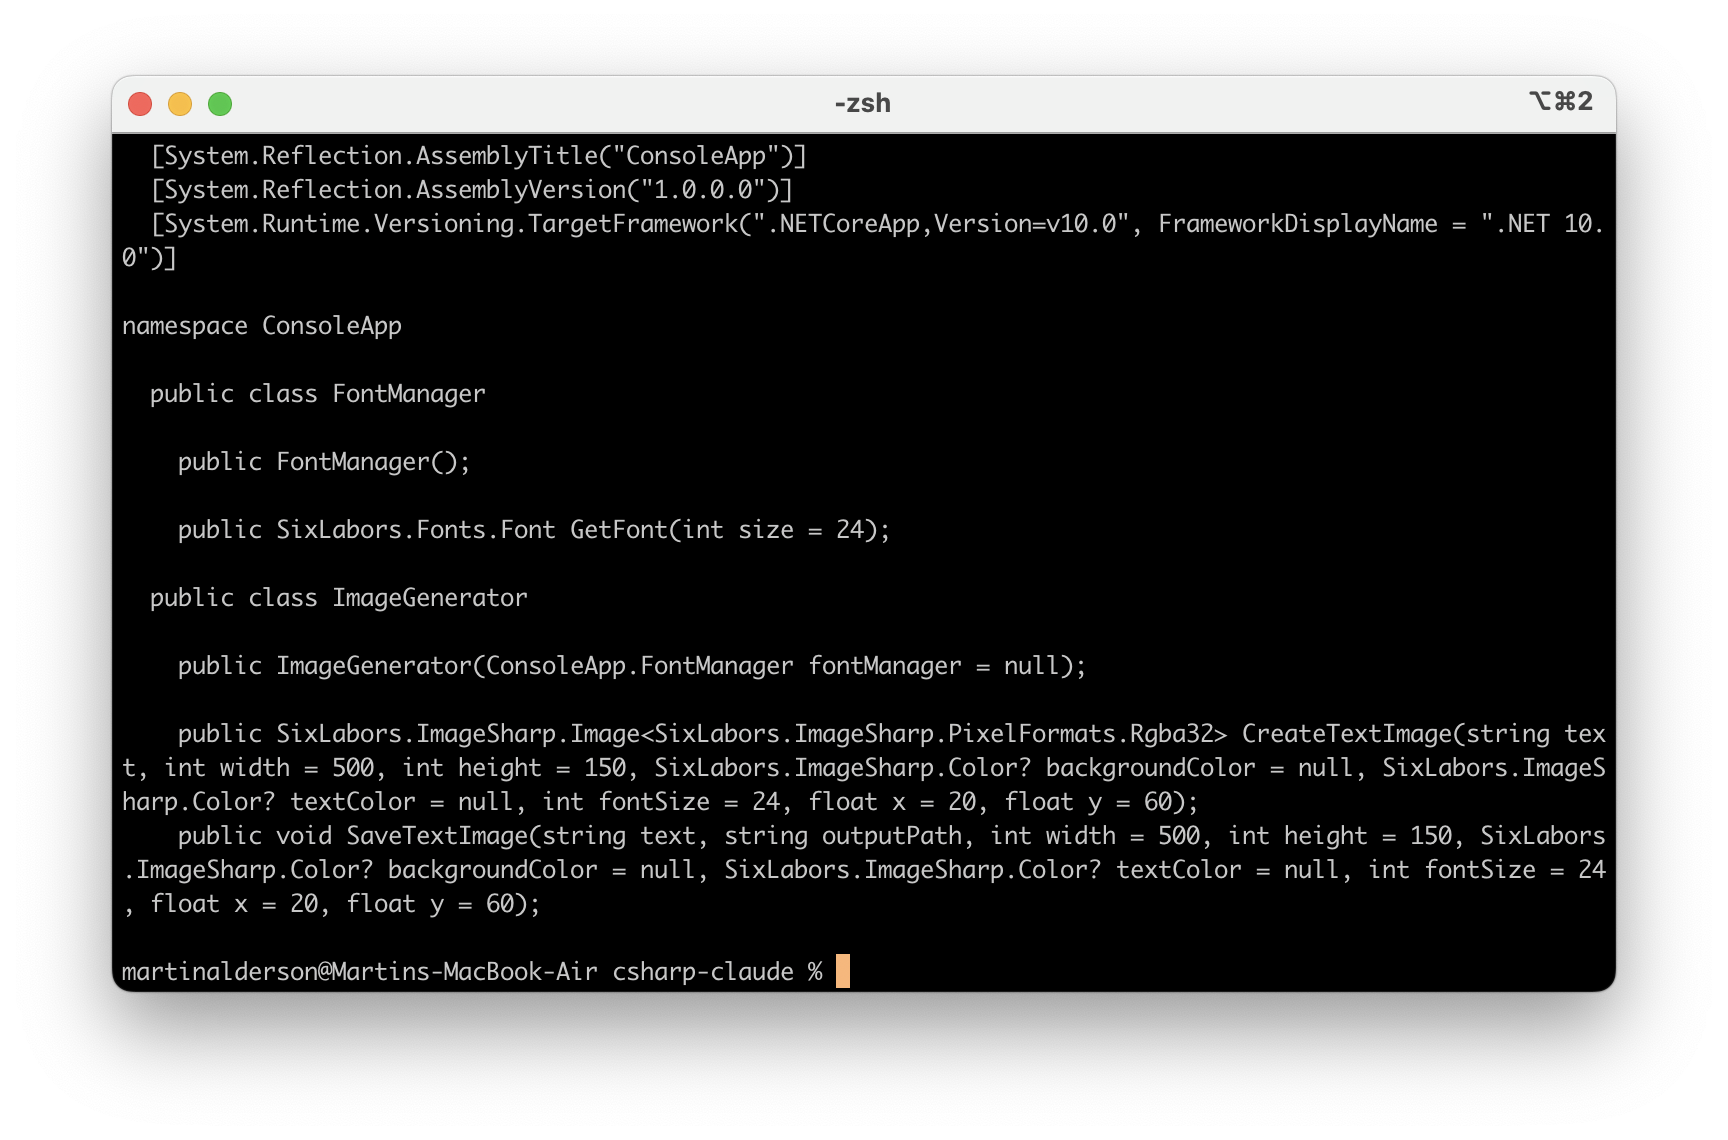 This is obviously a simple example, but this gets incredibly powerful when you have a complex codebase. Even in this simple example it can now know all the classes and their exact method signatures in your project.
The ImageSharp library is incredibly powerful and flexible, but has thousands of public methods. It's exactly the kind of library Claude Code has problems with and usually makes a total mess of things and I revert to copying and pasting documentation into prompts.
With some prompt help, Claude Code can quickly create commands like this:
 roslynator list-symbols ConsoleApp.csproj \
    --external-assemblies "~/.nuget/.../SixLabors.ImageSharp.Drawing.dll" \
    --visibility public --depth member | grep -i "drawtext"
This then returns the complete API surface for drawing text with this package, so it can then draw text perfectly without an endless loop of method names, web searches and me giving up and pasting the API docs into it (if they exist!.)
One issue arises though. This output is often so big Claude Code has trouble with it.
The next thing I did was gave Claude Code access to all this information ahead of time.
Let's have Roslynator document our entire project AND each third party library. I ended up with a folder structure like this:
  docs/
  ├── README.md                           # Overview and usage guide
  ├── project-api.txt                     # Your project's complete API
  └── thirdparty/                         # Third-party library APIs
      ├── SixLabors.Fonts-api.txt         # Font handling APIs
      ├── SixLabors.ImageSharp-api.txt    # Core image processing APIs
      └── SixLabors.ImageSharp.Draw...    # Drawing and text APIs
I quickly put together a shell script (which you can grab from this gist) which looks for all package references in the csproj, and then finds them in the nuget cache and documents them using Roslynator.
Now we can just add some simple instructions to CLAUDE.md to have it use this for our project.
# .NET API Discovery with Roslynator

  ## Installation
  ```bash
  dotnet tool install -g roslynator.dotnet.cli

  Key Commands

  # List all project APIs
  roslynator list-symbols MyProject.csproj --visibility public --depth member

  # Include external NuGet packages
  roslynator list-symbols MyProject.csproj --external-assemblies "path/to/package.dll"

  # Save to file for searching
  roslynator list-symbols MyProject.csproj --output api-docs.txt

  # Autogen full docs (rerun after adding packages or API changes)
  ./generate-docs.sh MyProject.csproj

  Documentation Structure

  Check the docs/ folder after running generate-docs.sh:
  - project-api.txt contains your project's complete API
  - thirdparty/ contains auto-discovered NuGet package APIs
This now gives Claude Code all it needs to know to be able to understand and work with any third party SDK, and complex structures. I've found it a huge leap forward in productivity with Claude Code - it reduces the frustrating edit - failed build - edit loop substantially especially on bigger projects.
You can use the exact same approach with any typed language. Here's some pointers for other environments which may or may not be up to date:
The TypeScript compiler itself has excellent static analysis capabilities built in. You can use tsc with the --declaration flag to generate .d.ts files, or use tools like:
typedoc --json api.json src/ generates complete API documentation in JSON formatFor Claude Code, TypeDoc's JSON output is particularly useful as it includes all method signatures, types, and JSDoc comments.
Go's tooling philosophy of simplicity extends to API discovery:
go doc -all github.com/gin-gonic/gin prints all exported symbols and their documentationgo list -json -deps ./... provides detailed package information in JSON formatguru describe gives detailed type information at any code positionFor third-party packages, go doc -all combined with module paths from go.mod gives you everything. The output is already in a clean, grep-friendly format that Claude Code can parse easily.
Java's rich reflection and bytecode analysis ecosystem makes this straightforward:
javap -public -cp library.jar com.example.ClassName shows all public methods and signatures from compiled classes-doctitle and -d flags, generates complete HTML documentation including third-party JARs on your classpathjdeps -apionly library.jar analyzes dependencies and public APIsClass.forName() and getMethods() can dump any JAR's complete API to a text fileFor Maven projects, mvn dependency:build-classpath gives you all JAR paths, which you can then feed to javap for complete API extraction of all dependencies.
What strikes me most about this approach is how much untapped potential exists in bridging traditional developer tooling with AI coding assistants. We've spent decades building sophisticated static analysis tools, debuggers, profilers, and linters - yet most AI agents are still fumbling around with basic text search like it's 1995.
This Roslynator integration is just scratching the surface. Imagine if Claude Code had native understanding of:
We're still in the stone age of AI-assisted development. Current AI coding tools are like having a brilliant junior developer who's been blindfolded and can only communicate through grep and bash. Meanwhile, we have all these powerful analysis tools just sitting there, waiting to be connected.
The good news is that the integration is often trivial - most of these tools already have CLI interfaces or can output JSON. The building blocks are all there. We just need to connect them.
Until Claude Code and other AI assistants build in native support for static analysis, we can bridge the gap ourselves with simple scripts and documentation. But I'm optimistic that this is temporary - the productivity gains are too obvious to ignore.
I can really see a next-gen coding agent which has all the tooling that a fully featured IDE has (like IntelliJ or Visual Studio), instead of what we currently have which feels much more like VS Code.
此内容由惯性聚合(RSS阅读器)自动聚合整理,仅供阅读参考。 原文来自 — 版权归原作者所有。