惯性聚合 高效追踪和阅读你感兴趣的博客、新闻、科技资讯
阅读原文 在惯性聚合中打开

推荐订阅源

freeCodeCamp Programming Tutorials: Python, JavaScript, Git & More
Jina AI
Jina AI
钛媒体:引领未来商业与生活新知
钛媒体:引领未来商业与生活新知
T
Troy Hunt's Blog
T
The Exploit Database - CXSecurity.com
Microsoft Security Blog
V
Visual Studio Blog
F
Fortinet All Blogs
博客园_首页
P
Proofpoint News Feed
V
Vulnerabilities – Threatpost
The Cloudflare Blog
C
Cyber Attacks, Cyber Crime and Cyber Security
cs.CL updates on arXiv.org
H
Heimdal Security Blog
cs.AI updates on arXiv.org
A
About on SuperTechFans
Cyber Security Advisories - MS-ISAC
AI
AI
奇客Solidot–传递最新科技情报
奇客Solidot–传递最新科技情报
S
Security Affairs
The Register - Security
S
Security @ Cisco Blogs
Hugging Face - Blog
Hugging Face - Blog
OSCHINA 社区最新新闻
OSCHINA 社区最新新闻
博客园 - 聂微东
Schneier on Security
WordPress大学
WordPress大学
Google DeepMind News
GbyAI
GbyAI
T
Tailwind CSS Blog
Hacker News: Ask HN
Hacker News: Ask HN
W
WeLiveSecurity
D
Docker
L
LangChain Blog
B
Blog RSS Feed
The Last Watchdog
The Last Watchdog
Cloudbric
Cloudbric
TaoSecurity Blog
TaoSecurity Blog
N
Netflix TechBlog - Medium
酷 壳 – CoolShell
酷 壳 – CoolShell
I
InfoQ
The Hacker News
The Hacker News
AWS News Blog
AWS News Blog
Exploit-DB.com RSS Feed
宝玉的分享
宝玉的分享
I
Intezer
云风的 BLOG
云风的 BLOG
V2EX - 技术
V2EX - 技术
K
KPMG report finds enterprise disconnect between AI and its ROI | CIO

Posts on Noah Bailey

How to turn anything into a router Deploy to Cloudfront from GitHub using OpenID Connect Backup Postgres databases with Kubernetes CronJobs The spelling error made 200 billion times a day Restarting Kubernetes pods using a CronJob You've just bought a new domain. Now what? Who Sawed My Motherboard??? Linux on the P8 Aliexpress Mini Laptop Recovering Mysql/Mariadb after a nasty crash Using EXIF data to pick my next lens Converting and developing RAW photos on Linux automatically Thank you, 2016 iPhone Don't Make It Work Self-hosted Surveillance with ZoneMinder Backups, Monitoring, and Security for small Mastodon servers Block web scanners with ipset & iptables Executing commands over SSH with GitHub Actions Debian Sid on encrypted ZFS Protect your dangerously insecure redis server Debian: the luxurious boring lifestyle Monitor radiation with a Raspberry Pi Simple Linux server alerts: Know your performance, errors, security, syslog, and security NUC crashes on debian 11 - How I fixed it Basic Linux server security with fail2ban, ossec, and firewall Windows 11 will create heaps of needless trash Domesticated Kubernetes Networking The Cursed Certificate Our mostly disposable and entirely stupid world Trying out OpenBSD (as a Linux geek) Making VoIP Calls with Antique Rotary Phones Monitoring WAN speed with speedtest-cli and ElasticSearch The Zeroshell botnet returns Installing Gentoo on a vintage Thinkpad T60 Malware emails 2: Russian boogaloo TP-Link Device Weirdness ElasticSearch broke all my nice things (a story of cascading failure) A New Botnet is Targeting Network Infrastructure Malware on the Wire: Monitoring Network Traffic with Suricata and ClamAV Cloud Threat Protection with OSSEC and Suricata Malware Emails From Jerks Surviving the Apocalypse with an Offline Wikipedia Server Being Attacked by Bots Linux Router, Firewall and IDS Appliance You Probably Don't Need a VPN Fix an Oversharded Elasticsearch Cluster Automating KVM Virtualization Update all your linux servers as fast as possible Cleanup Systemd Journald Storage Stop Putting Your SSH Keys on Github! Clustering KVM with Ceph Storage Stealing Windows Sessions FreeRadius Active Directory Integration Retrieving WPA2 Keys on Windows Deploy MDT Litetouch on Linux with TFTPD and Syslinux Generating MSI transform files with Orca The Inflatable Dinghy Generating Cisco IOS config files with Python Homebrew SAN Getting Cloudy
Monitoring WAN latency with InfluxDB
2020-12-08 · via Posts on Noah Bailey

This is a simple, ‘quick and dirty’ way to measure network latency over long periods of time. The only ‘complicated’ part is setting up InfluxDB, but I imagine that many folks already have it set up. To get started, check the official documentation.

Network latency will be measured with the good old ping command, then formatted with generic Unix tools. Then, statistics are stored using the influxdb write endpoint using the line protocol format. It’s a very simple and elegant API if you ask me.

Bash script

A simple bash script is created at /opt/pingmon.sh

#!/bin/bash
curl -i -XPOST "http://localhost:8086/write?db=netstats" \
    --data-binary "ping,dest=cloudflare $(ping -c 1 1.1.1.1 | \
    awk '/time=/{print $7}' | sed -e 's/time/rtt/g') $(date +%s%N)"

When run, this will output the InfluxDB line format:

ping,dest=cloudflare rtt=27.0 1607388217665469702

A few notes about the command:

  • InfluxDB requires nanosecond timestamps, so the Unix epoch plus the nanosecond timestamp is output by date +%s%N
  • The field time is reserved and cannot be used as part of a measurement, so the sed statement replaces ’time’ with ‘rtt’

Cron job

Using cron, the script is run every minute.

* * * * *     nobody    /opt/pingmon.sh

For security the script is run with absolutely no local access. If logging to a local file, it may be preferred to run as a local user instead.

More destinations

To better ‘map’ the internet, I can copy this line and change the ‘dest’ tag. For example, monitoring Google’s 8.8.8.8 ip:

curl -i -XPOST "http://localhost:8086/write?db=netstats" \
    --data-binary "ping,dest=google $(ping -c 1 8.8.8.8 | \
    awk '/time=/{print $7}' | sed -e 's/time/rtt/g') $(date +%s%N)"

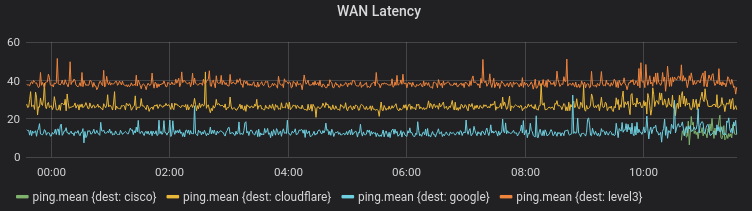
Dashboard

Finally, using Grafana we can chart out these trends over time. Grafana is one of the simplest ways to view influxdb data, and can be installed very easily.