








Debugging in production can be far more difficult and complex than local development — reasons range from limited visibility because of a lack of a step-by-step debugging, to needing to trace across distributed systems, and more. But fortunately there are actions to level up your debugging that you can take today.

Before we talk about how to improve debugging, what makes for “good” debugging? Good debugging requires good data. To help understand issues quickly, you should know:
In this blog post, we’ll go over the three pillars of observability — logs, traces, and metrics — and how they work together to answer important questions when debugging that will help you actually solve real problems. We’ll also show how you can instrument your existing server-side code by running it in Deno without any additional code.
Too often, we’re presented with logs like this:
[http] GET /api/book/1
[http] GET /api/book/2
[db] SELECT * FROM books WHERE id = 1
[db] SELECT * FROM books WHERE id = 2
error: Uncaught (in promise) PostgresError: 'name' column is null
  throw new PostgresError(`'name' column is null`);

    at query (file:/
    at queryBook (file:/
    at handleRequest (file:/
    at file:/
Does book 1 or book 2 have a null name field? 🤔
Without context, you can’t tell, because there are logs from two different parallel requests being interleaved here.
There is however a way out: if we associate a request ID with each log, then we
can determine which book had the null name field:
[req:1] [http] GET /api/book/1
[req:2] [http] GET /api/book/2
[req:1] [db] SELECT * FROM books WHERE id = 1
[req:2] [db] SELECT * FROM books WHERE id = 2
[req:1] error: Uncaught (in promise) PostgresError: 'name' column is null
  throw new PostgresError(`'name' column is null`);

    at query (file:/
    at queryBook (file:/
    at handleRequest (file:/
    at file:/
Now, we’re able to immediately understand the problem causing the error: book 1 is missing a name.
But augmenting our logging to include a unique request ID can be a hassle and
difficult to maintain. In our code, we’d have to generate and pass around
requestId to all downstream functions that might console.log:
 // ...

 app.get("/api/book/:id", async (req, res) => {
+  const requestId = Math.random();
+  console.log(`[req:${requestId}] [http] GET /api/book/${req.params.id}`);
-  console.log(`[http] GET /api/book/${req.params.id}`);
   const id = req.params.id;
   const book = await getBookFromDatabase(requestId, id);
   res.send(book);
 });

+ async function getBookFromDatabase(requestId: number, bookId: string) {
+   console.log(`[req:${requestId}] [db] getBookFromDatabase ${bookId}`);
-   console.log(`[db] getBookFromDatabase ${bookId}`);
    const book = books.get(bookId);
    if (book === undefined) throw new Error("No book found.");
    if (!book.author) throw new Error("Book is missing author.");
    return book;
  },
requestId, as well as include it in each console.log, making the code difficult to maintain and scale.
That’s where
Deno’s built-in OpenTelemetry support comes in -
you simply run the program with Deno, and all your console.log ’s
automatically have unique request IDs associated with them that Deno assigns
automatically for every incoming HTTP request:
Learn more about OpenTelemetry with Deno in our documentation.
Beyond the logs, oftentimes we want to answer questions such as:
Which caller passed the wrong arguments to this function?
Which one of the two call sites called this database query?
In order to answer that, we don’t just need to know what request an operation is a part of, but we also need to know the parent operation. Here, “operation” simply means something we want to track, such as an HTTP request or a database call.
In the world of telemetry, what we’re looking for are traces. They let us know who triggered what, when, and how long it took. This can then be displayed nicely in a graphical format, like this:
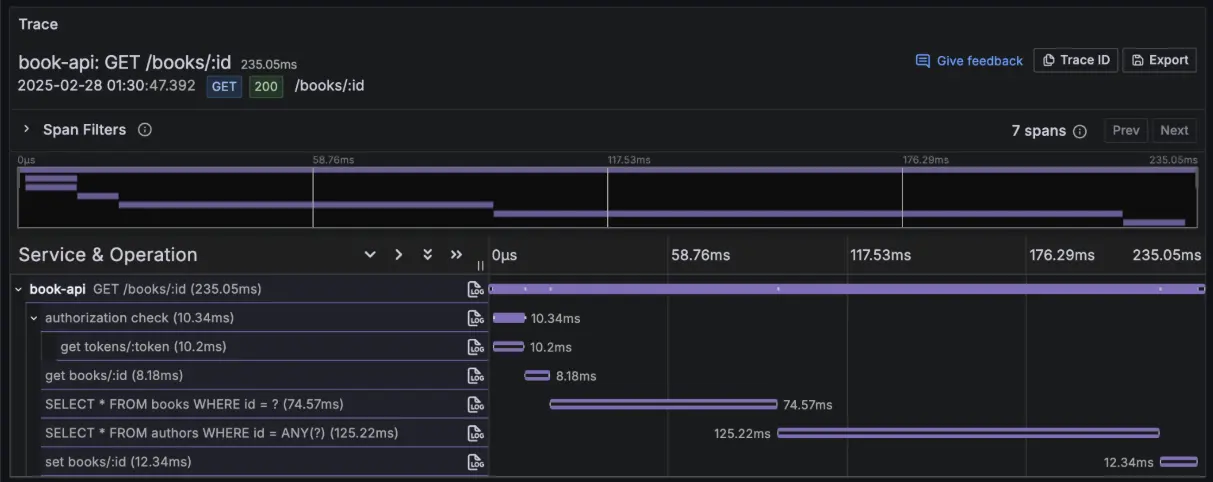
This trace, for instance, represents a single GET request, which triggered an
authorization check, two database queries, etc. You’ll notice that in this trace
you can see:
Here, this lets us know that these two database queries took the longest time.
In a trace, each operation is called a span. A span records how long the operation took, when it started, who triggered it, and which trace it is a part of.
In order to have each span nested correctly under it’s parent within the trace, we need a way to track the parent. This can be done by assigning each operation a span ID, and when we start a new operation (span), we can figure out what the current span ID is and use that as the parent span.
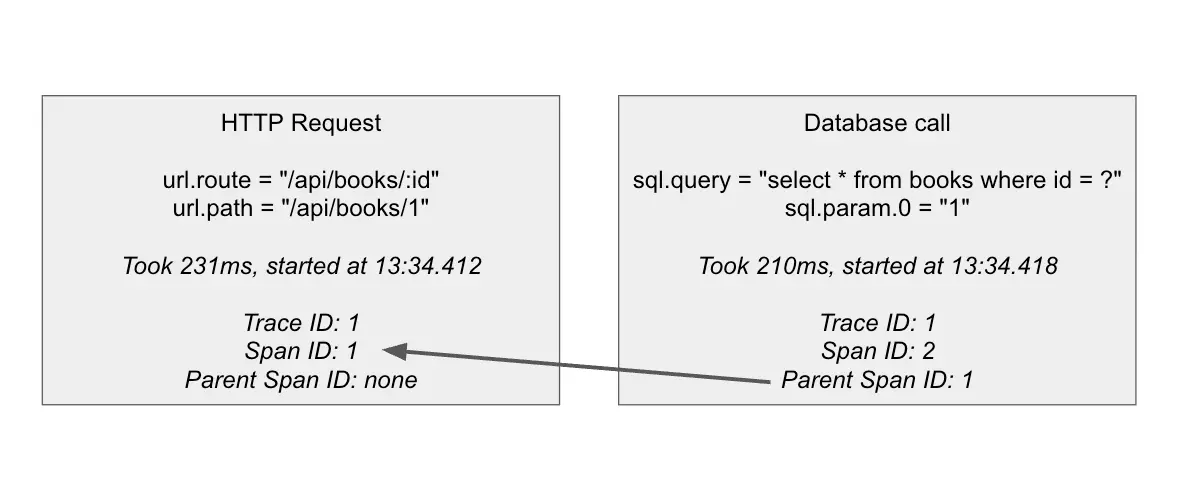
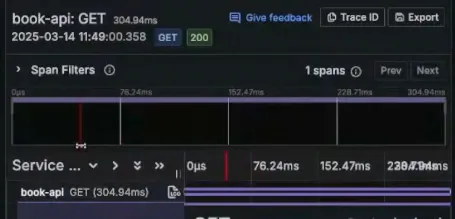
Out of the box, Deno will automatically create a span for each incoming HTTP request. This means that if you run your server with Deno, you’ll get a trace for each incoming HTTP request, and each trace will have a span for the request. This is done automatically, and you don’t need to do anything to configure it.
In a simple web app, that means you get a trace with a single span for every HTTP request:
Deno also creates spans for outgoing HTTP requests automatically. This means that if you make an outgoing HTTP request, Deno will automatically create a span for that request, and it will be a child of the span for the incoming HTTP request.
But we can improve our traces further by adding more spans, for example for the
database operation. We can implement that by starting a span before we make the
database call, and ending it after the database call is complete. To make this
easier, I like using a little utility function that wraps the startActiveSpan
function from the OpenTelemetry API. This utility function automatically handles
the span lifecycle for us, including setting the status code and recording
exceptions.
util.ts
import { Span, SpanStatusCode, trace } from "@opentelemetry/api";

const tracer = trace.getTracer("api");

export function withSpan<Args extends unknown[], T>(
  name: string,
  cb: (span: Span, ...args: Args) => Promise<T>,
): (...args: Args) => Promise<T> {
  return (...args: Args) => {
    return tracer.startActiveSpan(name, async (span) => {
      try {
        return await cb(span, ...args);
      } catch (err) {
        span.setStatus({ code: SpanStatusCode.ERROR, message: String(err) });
        span.recordException(err as Error);
        throw err;
      } finally {
        span.end();
      }
    });
  };
}
We can then use this utility function to wrap our getBookFromDatabase
function:
db.ts
import { withSpan } from "./utils.ts";

export const getBookFromDatabase = withSpan(
  "getBookFromDatabase",
  async function getBookFromDatabase(span, bookId: string) {
    span.setAttribute("book_id", bookId);
    console.log(`[db] getBookFromDatabase ${bookId}`);
    await new Promise((resolve) => setTimeout(resolve, 300));
    const book = books.get(bookId);
    if (book === undefined) throw new Error("No book found.");
    if (!book.author) throw new Error("Book is missing author.");
    return book;
  },
);
Now, when we send another cURL and view that request’s trace, we can see two
spans:
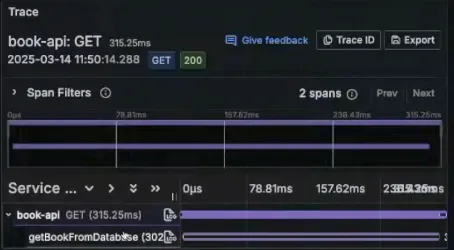
We’re now able to track all the operations triggered from a single HTTP request.
Here’s an end-to-end demo:
Debugging can get particularly difficult when dealing with multiple services, like in a microservices system. Tracing can help here too though, because traces can span across multiple services. All this requires is that you propagate the “parent operation” information from one service to another when making a request. This is called propagation.
This is made simple using W3C spec tracecontext, a standard format
representing the trace information to be propagated between services.
You could implement this yourself with a function like this on the sending side, where you manually inject the header into the request:
import { trace } from "npm:@opentelemetry/api";

export function fetchWithTrace(req: Request): Promise<Response> {
  const span = trace.getActiveSpan();
  if (!span) return fetch(req);
  const spanContext = span.spanContext();
  const traceparent = `00-${spanContext.traceId}-${spanContext.spanId}-01`;
  req.headers.set("traceparent", traceparent);
  return fetch(req);
}


const resp = await fetchWithTrace(new Request("https://example.com"));
You also have to then read back the traceparent header on the receiving side and create a new span with the traceparent information. This is a lot of work, and it’s easy to get wrong. You also have to remember to do this for every outgoing request, and every incoming request.
With Deno, you actually don’t have to do any of this. Deno automatically propagates the trace information for you between services. It can automatically inject trace information into outbound requests, and it can automatically read trace information from incoming requests.
Let’s create a new main.ts that simply calls the API server:
const resp = await fetch("https://localhost:8000/api/book/1");
const book = await resp.json();
console.log(book);
Now, run it with OTEL enabled:
$ deno run -A --unstable-otel main.ts
{ id: "1", title: "The Great Gatsby", author: "F. Scott Fitzgerald" }
When we check Grafana for our traces, you’ll notice that the latest trace does
not have the service name book-api. That’s because the trace originated from a
new service.

Clicking on that fetcher trace will show us three spans: one green and two
purple. Deno has automatically tracked a single trace across multiple services.
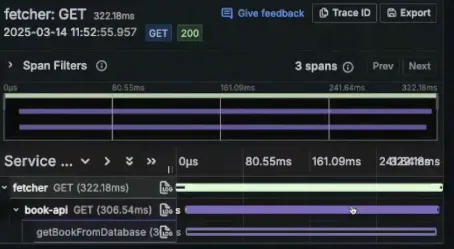
For more complex microservice architectures, you could imagine having deep nests of spans across multiple services.
Here’s a full demo from Luca showing how Deno can automatically collect traces across multiple services:
You probably don’t want to wait until your customer runs into an issue to let you know to fix something. The best way to get ahead of your customers when it comes to investigating production issues is through metrics (or more specifically, setting alert thresholds with metrics).
Metrics are aggregate data that show you how frequently something is happening. For instance, a common setup would be to trigger an alert when there are some percentage of requests with a 500 status code (for example 1% or 0.1%).
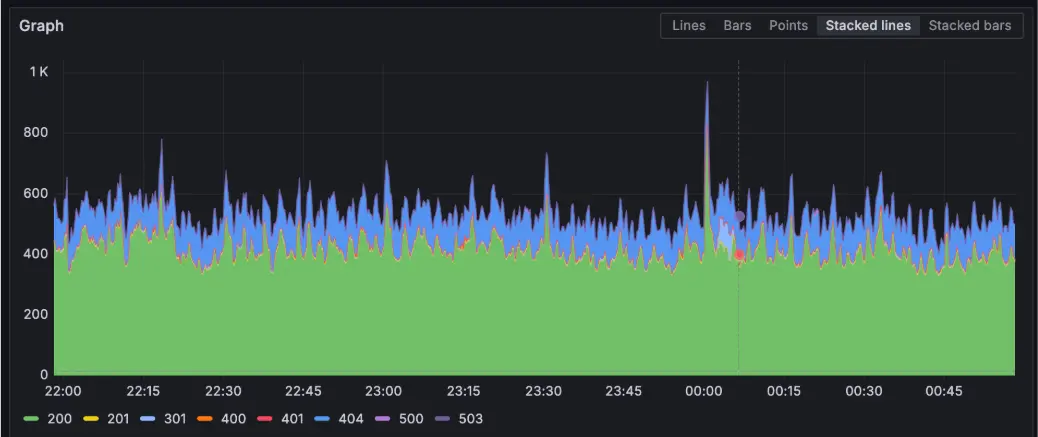
Running your program with Deno will automatically collect metrics:
In this post, we covered the three pillars of OpenTelemetry:
We also showed that Deno’s built-in OpenTelemetry support will automatically collect all of this information without any additional implementation or config. (You can also run your Node projects with Deno and automatically get this level of observability.) When running your program in Deno, you’ll get:
with much more to come.
Deno makes writing code simple. But we know that writing code is only half of the battle. The other half is debugging and maintaining that code. This is why debugging, especially in production, is now such a core part of the Deno runtime.
🚨️ Learn more about Deno 2.2 🚨️
- Built-in OpenTelemetry
- Custom lint rules
- Support for
node:sqlite- Updates to
deno check,deno lsp, anddeno taskand more!
此内容由惯性聚合(RSS阅读器)自动聚合整理,仅供阅读参考。 原文来自 — 版权归原作者所有。