





One important facet of running production software is observability—monitoring logs, traces, and metrics so you can identify and fix issues quickly. In Node.js servers, adding observability isn’t trivial. You have to add instrumentation code, modify your logger, and configure various services. What if you could see logs and traces immediately, without any additional work?
In this post, we’ll show how you can immediately see what a Node.js backend is doing—without making any code changes—by running it in Deno. Now that Deno can run Node programs and has built-in OpenTelemetry support, this is easier than ever.
Before we set up OTel with Deno, let’s go over how to set it up in Node.
Here’s a simple app (GitHub source) that displays a chat box, which takes your input and passes it to ChatGPT.
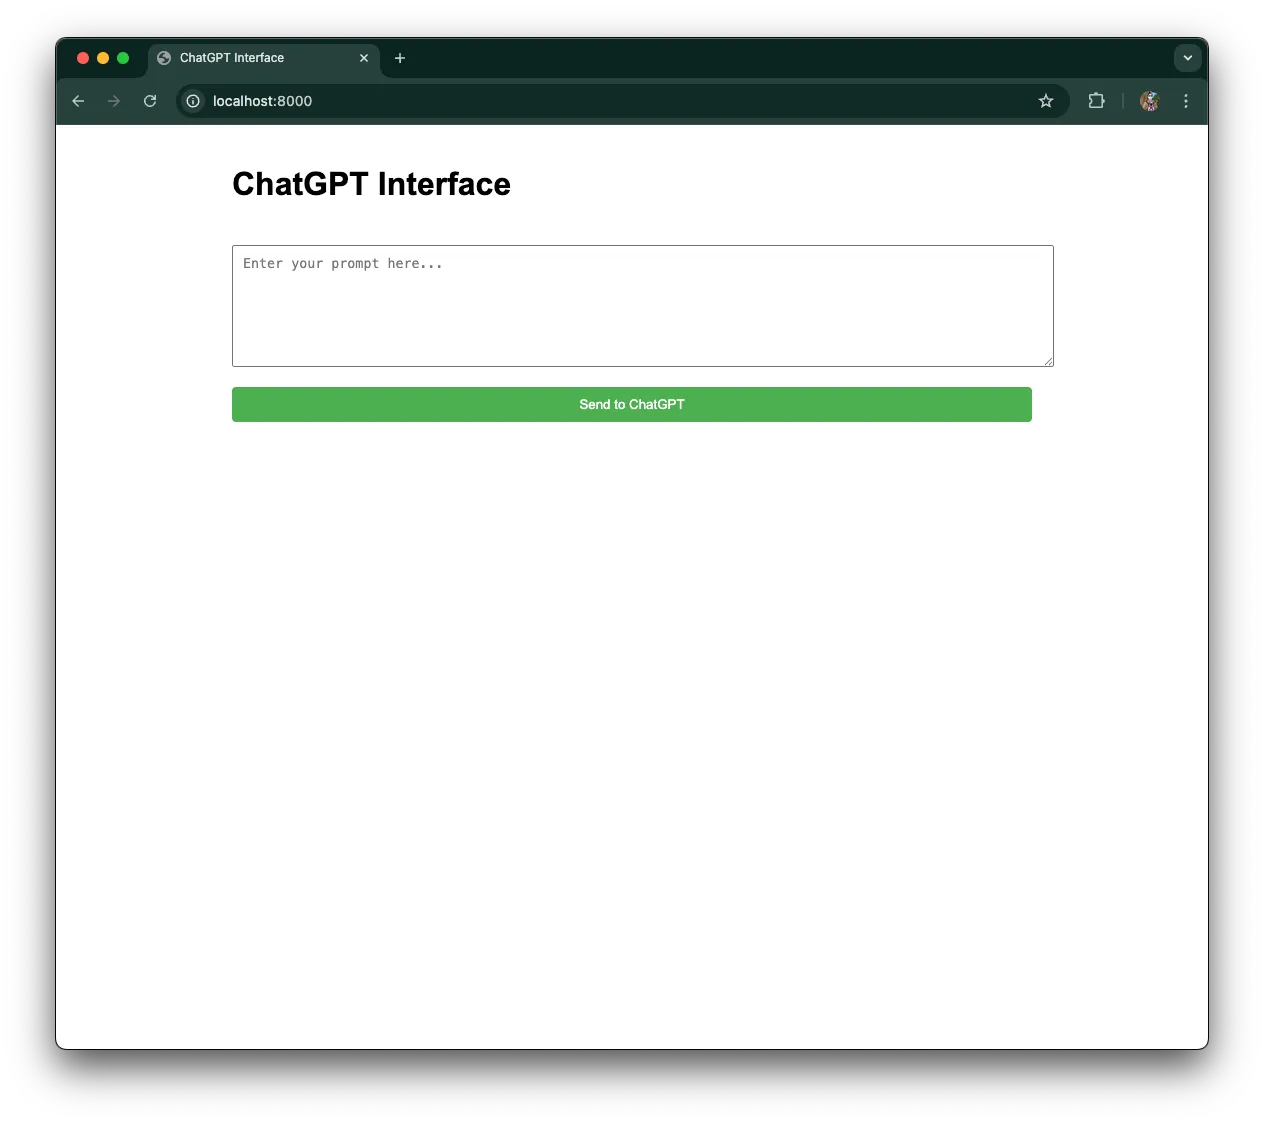
To follow along, clone this repo
and run the app in the node-express subdirectory.
Currently, we console.log at key points in the single-file app:
node server.js
Server is running on http://localhost:8000
Serving the chat interface...
Prompt: Tell me about the last time you felt sad.
Sending request to OpenAI...
Received response from OpenAI
Let’s add OpenTelemetry to the program and use Grafana’s open-source LGTM stack to introspect it. Since this post isn’t about setting up an OTel stack from scratch, we’ll describe it at a high level:
docker run command.Let’s start our server with new environment variables:
OTEL_SERVICE_NAME=chat-app OTEL_EXPORTER_OTLP_ENDPOINT=http://localhost:4318 node server.jsThen, we’ll start Grafana’s OTel LGTM stack:
docker run --name lgtm -p 3000:3000 -p 4317:4317 -p 4318:4318 --rm -ti \
    -v "$PWD"/lgtm/grafana:/data/grafana \
    -v "$PWD"/lgtm/prometheus:/data/prometheus \
    -v "$PWD"/lgtm/loki:/data/loki \
    -e GF_PATHS_DATA=/data/grafana \
    docker.io/grafana/otel-lgtm:0.8.1
Now, when you open Grafana at localhost:3000, click “Explore,” and select
“Tempo,” you’ll see traces.
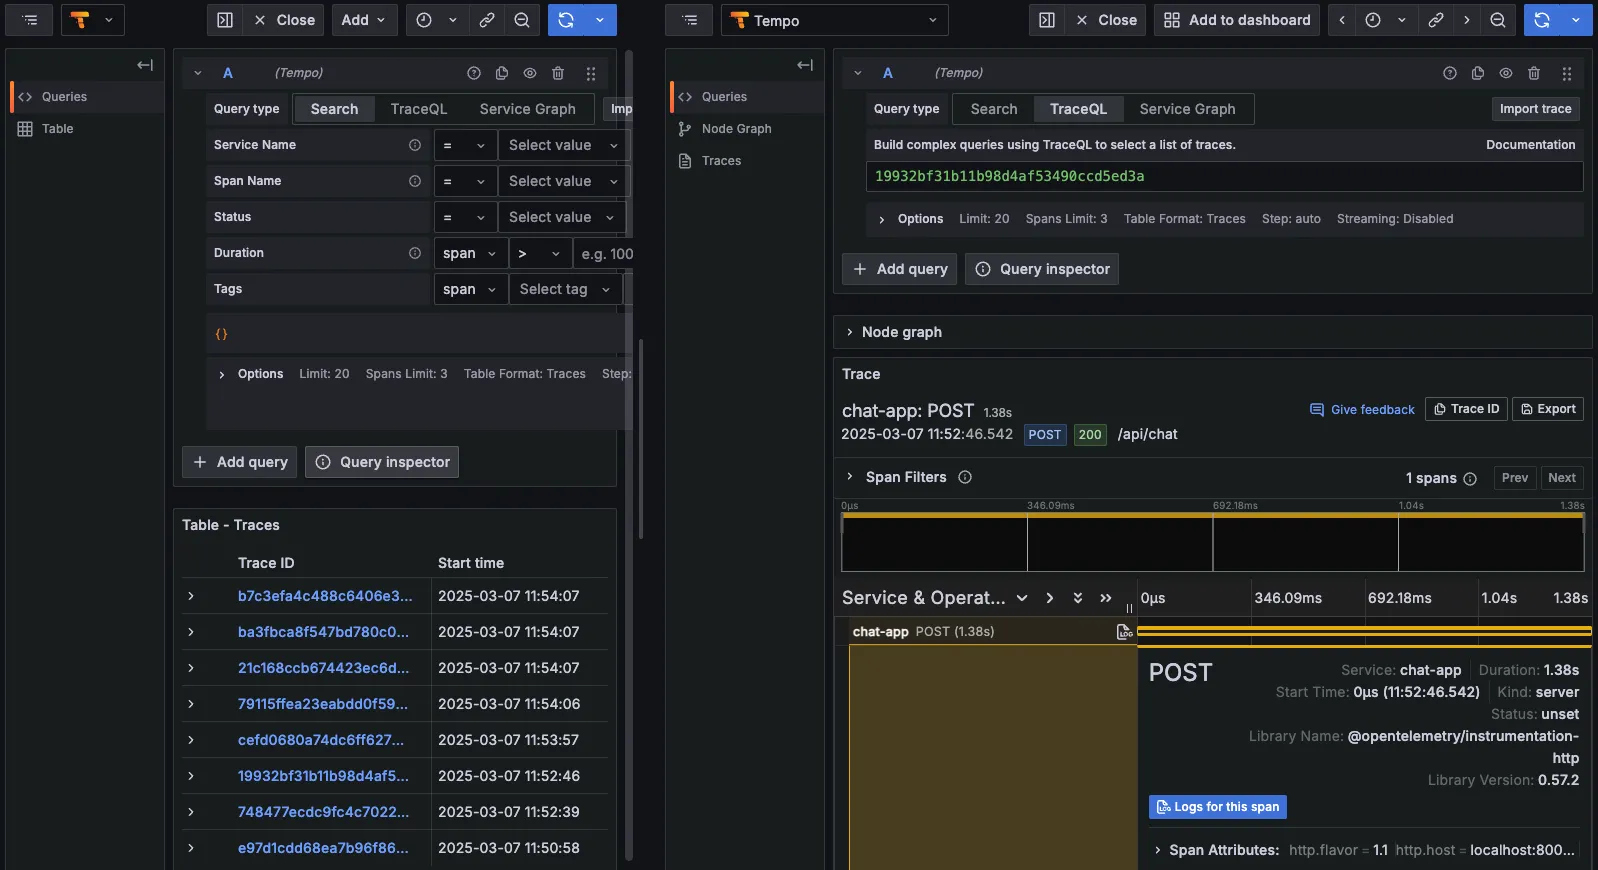
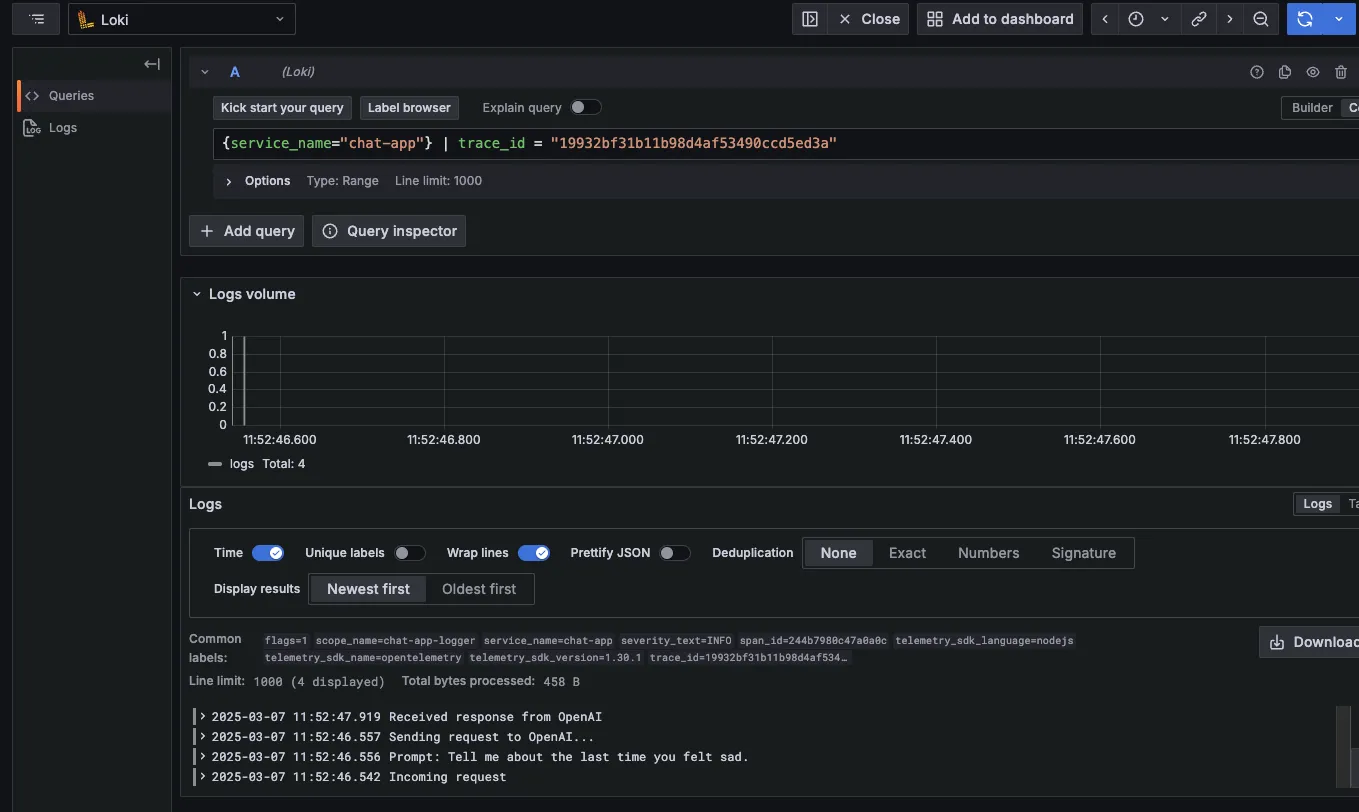
Clicking on the trace shows a POST request, which is a single span within that
trace. Clicking “Logs for this span” displays logs associated with this request:
In Node, setting up OTel required importing 8 new dependencies, an
additional 84 lines of instrumentation code, and replacing console.logs
with a custom logger configured to send log output to the OTel endpoint.
To see exactly what changes were required to integrate OpenTelemetry into our Node app, here’s the diff:
package.jsonpackage.json
   "main": "server.js",
   "type": "module",
   "scripts": {
-    "start": "node server.js"
+    "start": "OTEL_SERVICE_NAME=chat-app OTEL_EXPORTER_OTLP_ENDPOINT=http://localhost:4318 OTEL_LOG_LEVEL=error node server.js"
   },
   "dependencies": {
+    "@opentelemetry/api": "^1.9.0",
+    "@opentelemetry/auto-instrumentations-node": "^0.56.1",
+    "@opentelemetry/exporter-logs-otlp-http": "^0.57.2",
+    "@opentelemetry/exporter-metrics-otlp-http": "^0.57.2",
+    "@opentelemetry/exporter-trace-otlp-http": "^0.57.2",
+    "@opentelemetry/resources": "^1.30.1",
+    "@opentelemetry/sdk-node": "^0.57.2",
+    "@opentelemetry/semantic-conventions": "^1.30.0",
     "dotenv": "^16.4.7",
     "express": "^4.18.3"
   }
console.log calls in server.jsserver.js
 import dotenv from 'dotenv';
+import { logger } from './telemetry.js';
 import express from 'express';

 dotenv.config();

 // Code...

 // Middleware to parse JSON bodies
+app.use((req, _res, next) => {
+  logger.info("Incoming request", {
+    attributes: {
+      path: req.path,
+      method: req.method,
+    },
+  });
+  next();
+});
 app.use(express.json());

 // Serve static HTML
 app.get("/", (_req, res) => {
-  console.log("Serving the chat interface");
+  logger.info("Serving the chat interface");
   res.send(`<!DOCTYPE html>
 <html>
 <head>

 // Code...

 app.post("/api/chat", async (req, res) => {
   try {
     const { prompt } = req.body;
-    console.log("Prompt:", prompt);
+    logger.info(`Prompt: ${prompt}`);

     // Add your hardcoded system prompt here
     const systemPrompt =
       "You are a helpful AI assistant. Please provide clear and concise responses.";

-    console.log("Sending request to OpenAI...");
+    logger.info("Sending request to OpenAI...");
     const response = await fetch("https://api.openai.com/v1/chat/completions", {
       method: "POST",
       headers: {

       }),
     });

-    console.log("Received response from OpenAI");
+    logger.info("Received response from OpenAI");
     const data = await response.json();

     res.json({
       response: data.choices[0].message.content,
     });
   } catch (error) {
-    console.error("Error:", error);
+    logger.error(`Error: ${error}`);
     res.status(500).json({
       error: error.message,
     });

// Code...

 // Start the server
 app.listen(port, () => {
-  console.log(`Server is running on http://localhost:${port}`);
+  logger.info(`Server is running on http://localhost:${port}`);
 });
telemetry.js
+import process from 'process';
+import { NodeSDK } from '@opentelemetry/sdk-node';
+import { OTLPLogExporter } from '@opentelemetry/exporter-logs-otlp-http';
+import { OTLPTraceExporter } from '@opentelemetry/exporter-trace-otlp-http';
+import { OTLPMetricExporter } from '@opentelemetry/exporter-metrics-otlp-http';
+import { HttpInstrumentation } from '@opentelemetry/instrumentation-http';
+import {
+  LoggerProvider,
+  SimpleLogRecordProcessor,
+} from '@opentelemetry/sdk-logs';
+import { Resource } from '@opentelemetry/resources';
+import { trace, context } from '@opentelemetry/api';
+
+const resource = new Resource({
+  "service.name": process.env.OTEL_SERVICE_NAME || "chat-app",
+});
+
+const logExporter = new OTLPLogExporter({
+  url: "http://localhost:4318/v1/logs",
+});
+
+const loggerProvider = new LoggerProvider({
+  resource, // ✅ Attach the resource with the updated attribute
+});
+
+loggerProvider.addLogRecordProcessor(new SimpleLogRecordProcessor(logExporter));
+
+const logger = loggerProvider.getLogger("chat-app-logger");
+
+const customLogger = {
+  info: (message, attributes = {}) => {
+    const activeSpan = trace.getSpan(context.active());
+    const traceId = activeSpan
+      ? activeSpan.spanContext().traceId
+      : "no-trace-id";
+    logger.emit({
+      traceId,
+      body: message,
+      severityText: "INFO",
+      attributes,
+    });
+  },
+  error: (message, attributes = {}) => {
+    const activeSpan = trace.getSpan(context.active());
+    const traceId = activeSpan
+      ? activeSpan.spanContext().traceId
+      : "no-trace-id";
+    logger.emit({
+      traceId,
+      body: message,
+      severityText: "ERROR",
+      attributes,
+    });
+  },
+};
+
+const sdk = new NodeSDK({
+  traceExporter: new OTLPTraceExporter({
+    url: "http://localhost:4318/v1/traces",
+  }),
+  metricExporter: new OTLPMetricExporter({
+    url: "http://localhost:4318/v1/metrics",
+  }),
+  instrumentations: [
+    new HttpInstrumentation(),
+  ],
+  logExporter,
+  resource,
+});
+
+// Start the SDK and handle the promise properly
+sdk.start();
+
+process.on("SIGTERM", () => {
+  sdk.shutdown()
+    .then(() => logger.info("Telemetry shutdown complete"))
+    .finally(() => process.exit(0));
+});
+
+export { customLogger as logger };telemetry.js was created to configure auto-generating traces, metrics, and logging, as well as exporting telemetry data to the OTel collector endpoint.
Note: if you want to explore these files directly, check out the “original” Node app (without OTel) and the identical Node app but with OTel setup.
But what if there was an easier way to get logs and tracing without the instrumentation and configuration steps?
Deno added built-in OTel in 2.2, allowing us to spin up the OTel
stack in a single command.
It automatically collects and exports
traces, metrics, and logs from console.log, fetch, and Deno.serve().
With Deno 2.2+, you can immediately see traces and logs in Grafana by just
passing a few additional environment variables and the --unstable-otel flag:
OTEL_DENO=true OTEL_SERVICE_NAME=chat-app deno \
  --unstable-otel -NRE --env-file server.js
Note: The --unstable-otel flag enables Deno’s built-in OpenTelemetry,
which is still experimental and subject to change.
We can spin up the same OTel-LGTM stack:
docker run --name lgtm -p 3000:3000 -p 4317:4317 -p 4318:4318 --rm -ti \
    -v "$PWD"/lgtm/grafana:/data/grafana \
    -v "$PWD"/lgtm/prometheus:/data/prometheus \
    -v "$PWD"/lgtm/loki:/data/loki \
    -e GF_PATHS_DATA=/data/grafana \
    docker.io/grafana/otel-lgtm:0.8.1
After playing with the app a bit to generate some logs, when we visit
localhost:3000, click on “Explore,” then “Tempo,” we can see traces.
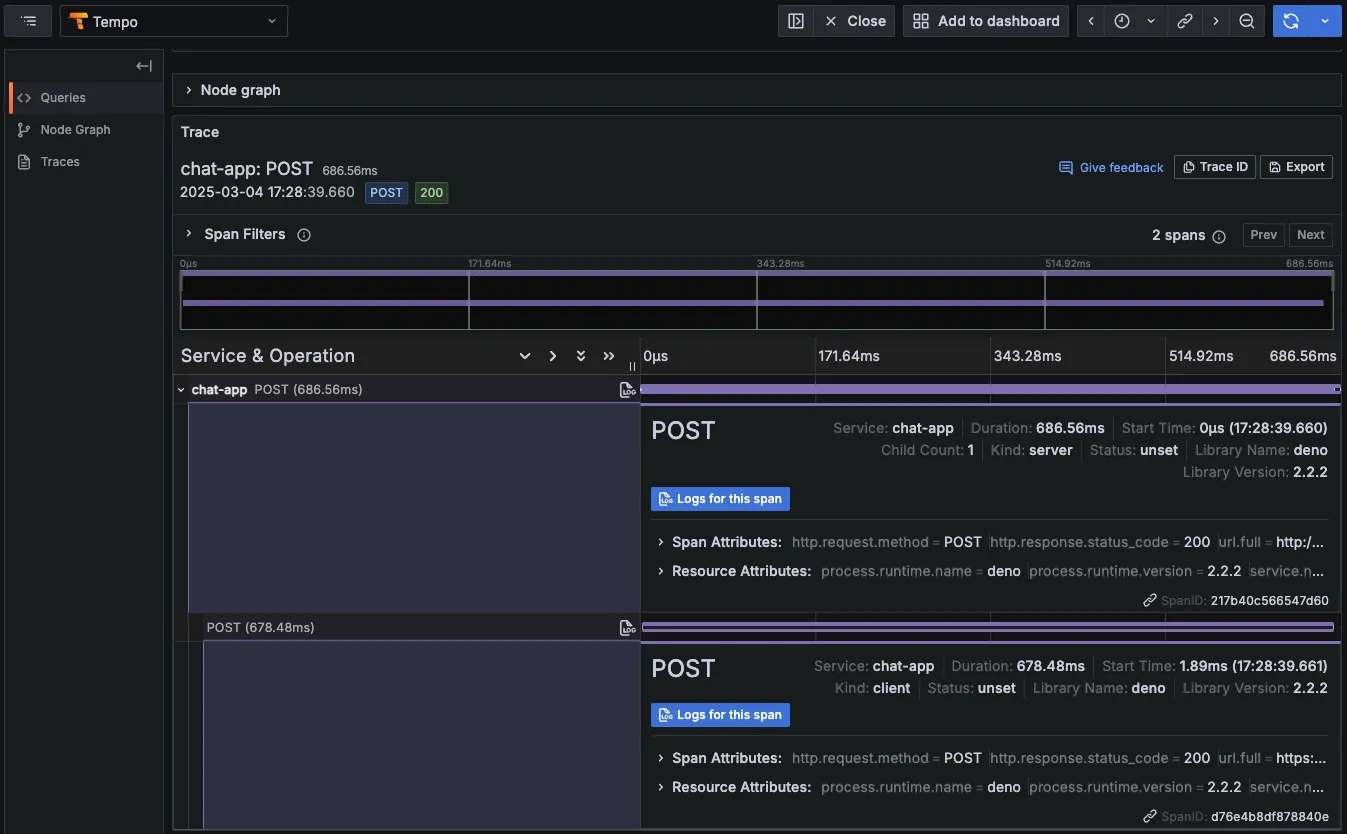
Clicking “Logs for this span” shows the logs associated with the same HTTP request:
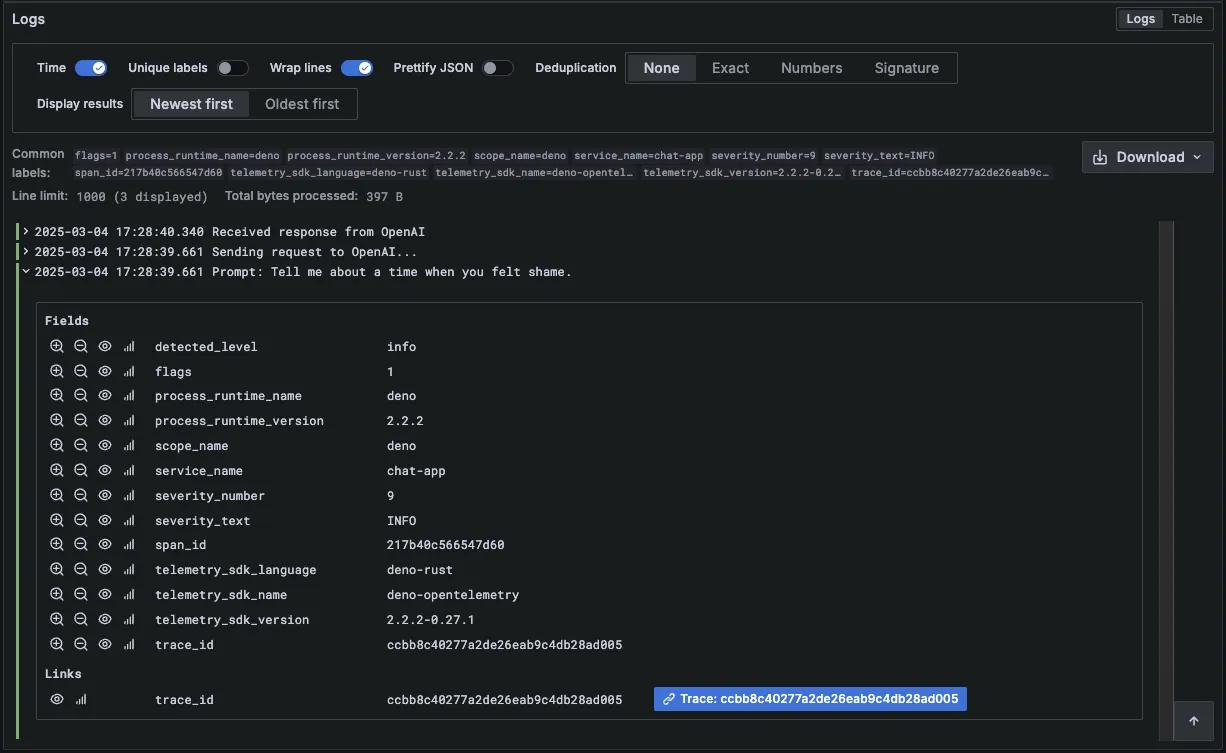
We’ve expanded the last console.log, and we can see that Deno and OTel have
automatically attached metadata to help contextualize this log. Logs from
JavaScript code are exported with the relevant span context if they occur inside
an active span.
All of this works without adding any additional instrumentation code or configuration. If there’s a Node.js server where you want immediate logging and tracing, try running it with OTel-enabled Deno.
Learn more about advanced use cases with Deno’s built-in OTel support.
OpenTelemetry has drastically simplified ingesting and exporting telemetry data, and now that it’s built into Deno, adding observability is easier than ever. Without extra config or instrumentation, you can immediately get logs and tracing from HTTP requests and console logs.
We’ll continue improving our built-in OTel integration, with many updates on the way. We’ll also publish more resources on setting up OTel and sending telemetry data to your preferred observability stack.
🚨️ Deno 2.2 released! 🚨️
此内容由惯性聚合(RSS阅读器)自动聚合整理,仅供阅读参考。 原文来自 — 版权归原作者所有。