






As deals around AI and data centres continued to stack up at the AI Impact Summit, the mood elsewhere wasn’t as cheerful. It’s the software sector we are talking about. The rout in global software stocks has been a bottomless pit so far. Software companies apparently face an existential threat from AI. The debate rages on whether the selloff is overdone or the disruption is serious, an outcome that no one can predict at this point in time.
Though the threat has existed for around two years now and stocks, too, have been on a slump since last year, the recent rout signals the market’s acknowledgement that the threat is real. Stocks of global software bellwethers have fallen anywhere between 15 per cent and 35 per cent over the past 30 days. Accenture and EPAM Systems are among the biggest losers with losses of 25 per cent and 35 per cent. Back home, the Nifty IT index has declined 16 per cent over the same period.
Gauging the carnage
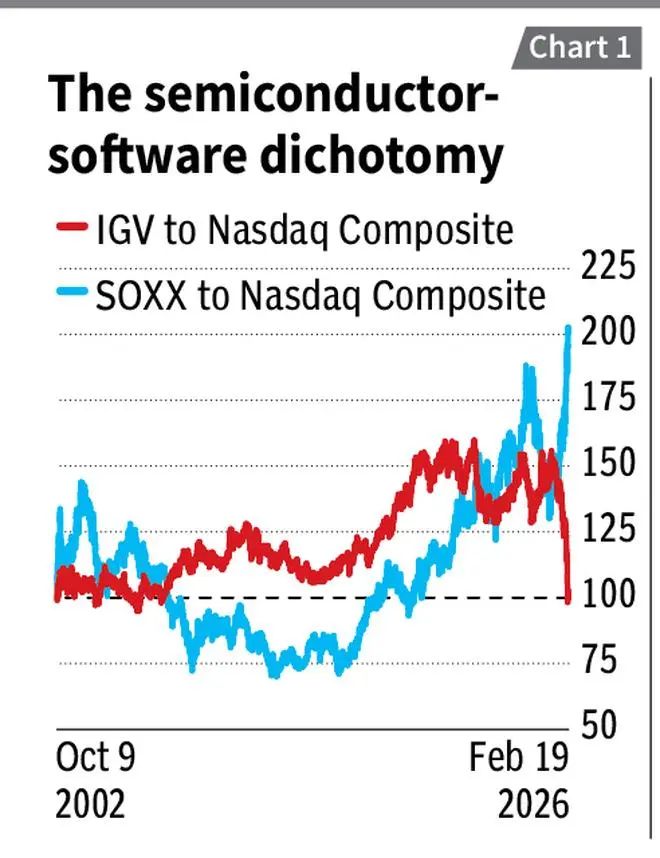
We use ratio charts here to better gauge the extent of this carnage. Chart 1 represents the price of iShares Expanded Tech-Software Sector ETF (IGV) to the Nasdaq Composite index’s value. IGV is used as a proxy of the sector. Stocks of front-line software firms such as Microsoft, Palantir, Oracle, Salesforce, Palo Alto Networks, Adobe and Crowdstrike are among the top 10 holdings of the ETF today. The top 10 holdings constitute about 60 per cent of the ETF’s portfolio.
The ratio chart has been rebased to 100 with the base set at the market’s bottom formed in early October 2002, after the dotcom bust. A ratio of above 100 indicates the relative outperformance of the software portfolio (IGV) against Nasdaq Composite, which is also a tech-heavy index. As can be seen from Chart 1, the ratio, which stayed above 100 for almost the entirety of the period under analysis, is now back to 100 – same level as the bottom after the dotcom bust. This implies that the entire outperformance of software stocks from the start of the great technology bull market, which started in 2002, has now been entirely undone in a few months!
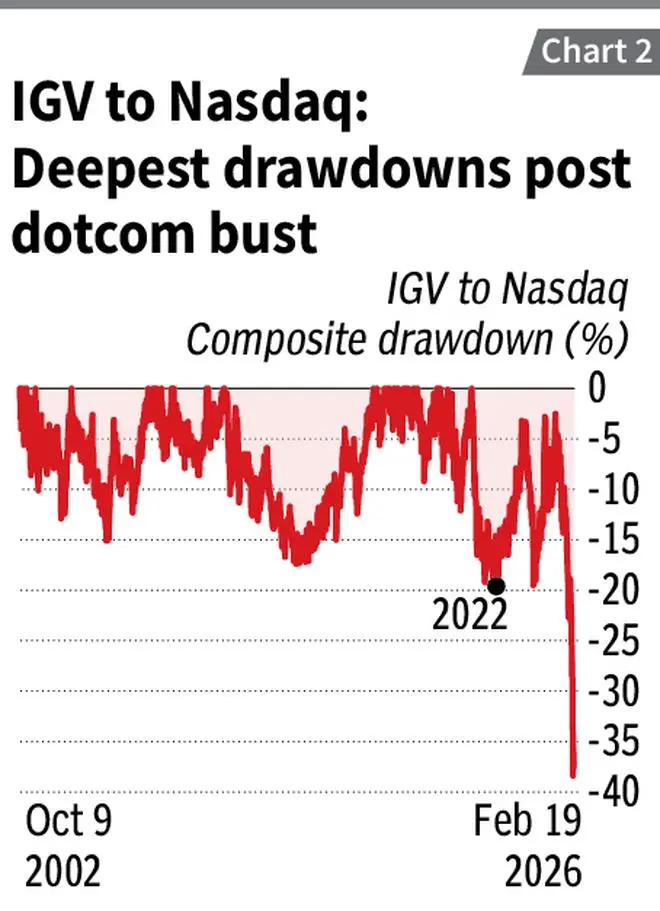
Further, if a drawdown chart of this ratio were to be constructed, it would reveal that the current drawdown of 37 per cent surpasses all other drawdowns over this period, including the one during 2022, when stocks reacted to interest rate tightening and firms scaling back after the post-pandemic boom (Chart 2). Thus, this represents the worst underperformance of software stocks relative to the Nasdaq Composite index.
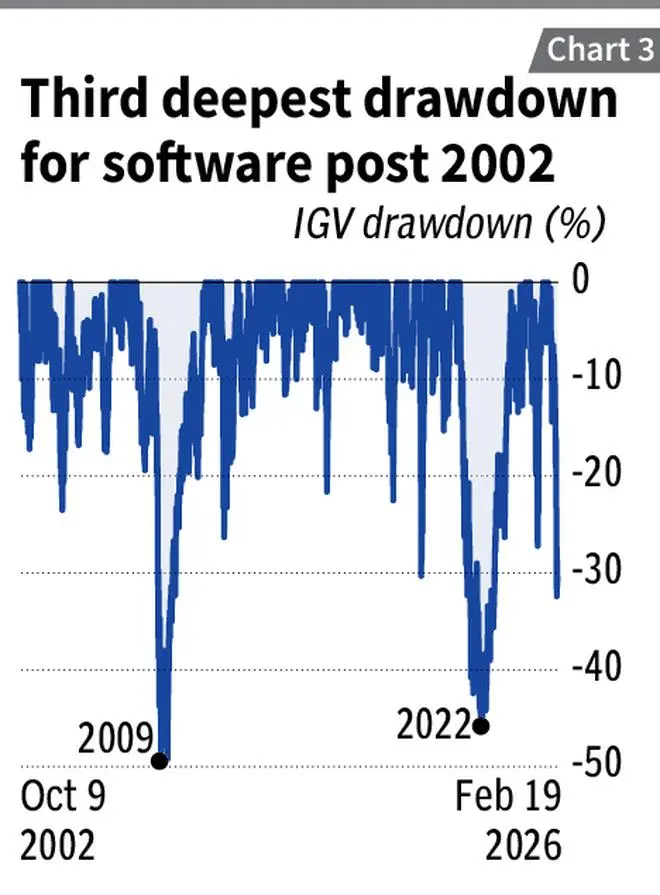
Analysing IGV’s own drawdown on a standalone basis (Chart 3), the current drawdown of over 30 per cent is next only to the 50 per cent drawdown in 2009 after the sub-prime crisis and the nearly 45 per cent drawdown in 2022, a time when Fed aggressively increased interest rates causing the Covid-driven digitisation boom to hit some roadblocks.
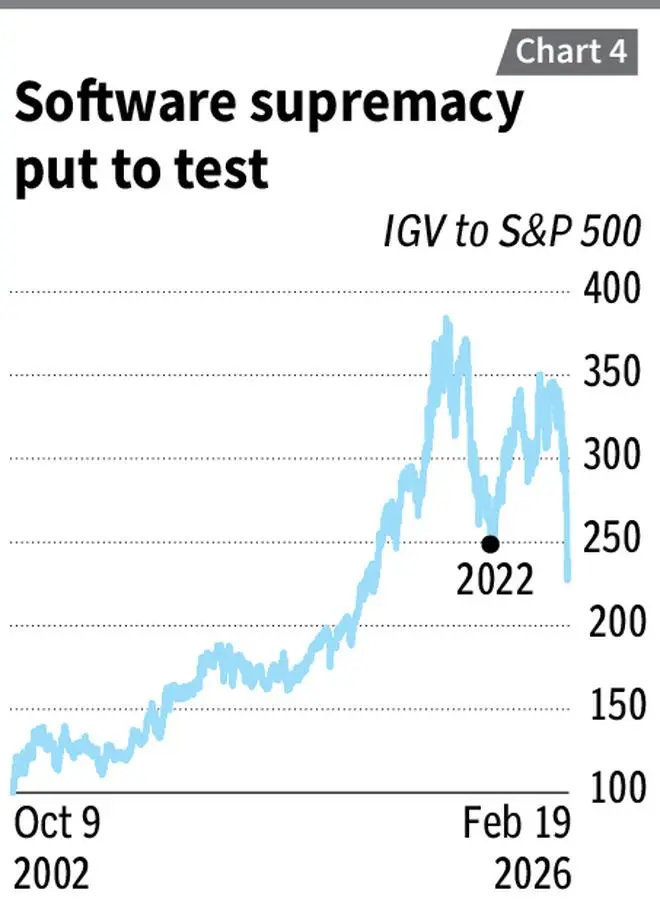
If the same ratio were to be constructed with S&P 500 as the base, the chart would look like the one in Chart 4. It can be observed that in the post-dotcom period, the ratio has been above 100 – implying the outperformance of the software portfolio relative to the broader market. However, the ratio is now at a level worse than the trough formed in 2022.
Making merry
If there is a sector that is making merry when the software stocks are trounced, it is the semiconductor sector. In the ensuing AI gold rush and the arms race for chips/ GPUs, chip designers (Nvidia, for instance), memory chip companies (Micron) and semiconductor foundries/ fabs (TSMC) and suppliers of chip-making equipment (ASML, Applied Material) are seen as the shovel sellers in the gold rush. The iShares Semiconductor ETF (SOXX) serves as a proxy of this sector. The portfolio of this ETF, inter alia, comprises firms such as Micron Technology, Nvidia, Applied Material, TSMC, Broadcom, AMD and ASML, which feature among the top 10 holdings today. The top 10 holdings constitute 57 per cent of the portfolio.
A ratio chart that compares the price of SOXX with that of Nasdaq Composite is presented in Chart 1. Unlike the software portfolio, which has almost always outperformed the Nasdaq Composite (ratio staying above 100), the semiconductor portfolio (inherently cyclical) started outperforming the index only in 2017, recovering from the troughs of 2012. The ratio is now at an all-time high in the post-dotcom period and resembles an exact mirror image of the IGV ratio chart, when seen over the last six months.
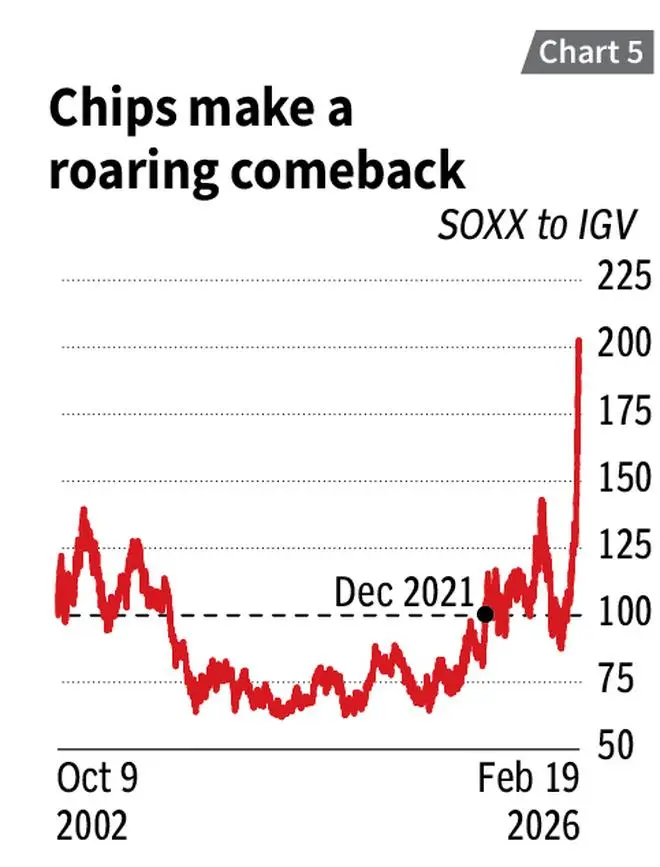
A ratio chart that studies the relative performance of SOXX against IGV is presented in Chart 5. After a long stint of relative underperformance post the sub-prime crisis till late-2021, the ratio has now skyrocketed over the last 10 months to 200.
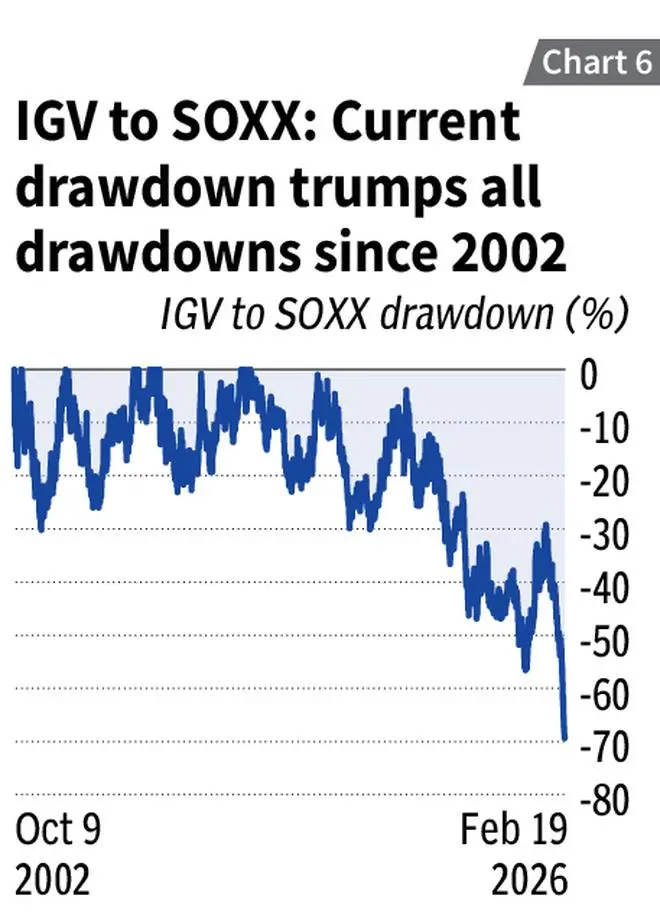
An analysis of drawdowns of the inverse of this ratio( that is, IGV to SOXX, shows how the current drawdown has snowballed over the past five-odd years to 70 per cent now – marking the worst in the post-dotcom period (Chart 6).
That said, should investors hop on to the semiconductor bandwagon? Aren’t software stocks value buys now? Valuations of all major chip stocks except Nvidia and AMD are well above their five-year average multiples. On the other hand, valuations of all software stocks are currently below their five-year averages. While under normal circumstances these are good barometers to consider, given the current exponential disruption, it is not as clear as day and night.
Indian context
In the Indian context, Chart 7 studies the relative performance of Nifty IT against Nifty 50 (using the ratio of Nifty IT index value to Nifty 50 index value). Here, the base is set in September 2001, when Nifty IT bottomed after the dotcom bust.
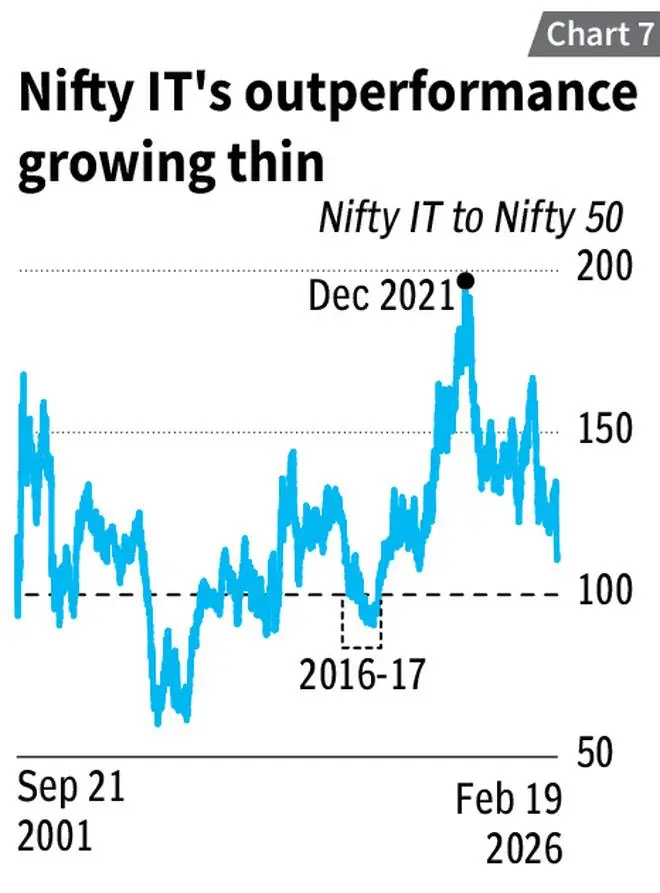
The ratio is now at 111, having fallen from the peak (about 200) of late 2021, but still above 2016-17 levels, when firms struggled in the advent of cloud/digitalisation disruption. Driven by lack of earnings growth and the advent of AI, valuations of stocks have indeed corrected, and stocks are now trading at multiples lower than five-year averages. Yet, what needs to be noted is that the stocks are still trading at valuations higher than their pre-Covid levels in December 2019 when their growth was better and there was no threat of disruption. Hence, on that count, the valuations are still not attractive. Further, some in the mid-cap space such as Tata Elxsi, Tata Technologies, KPIT Technologies and the recently-listed small-cap Fractal Analytics are trading at multiples that are amongst the highest in the software space globally (Chart 8).
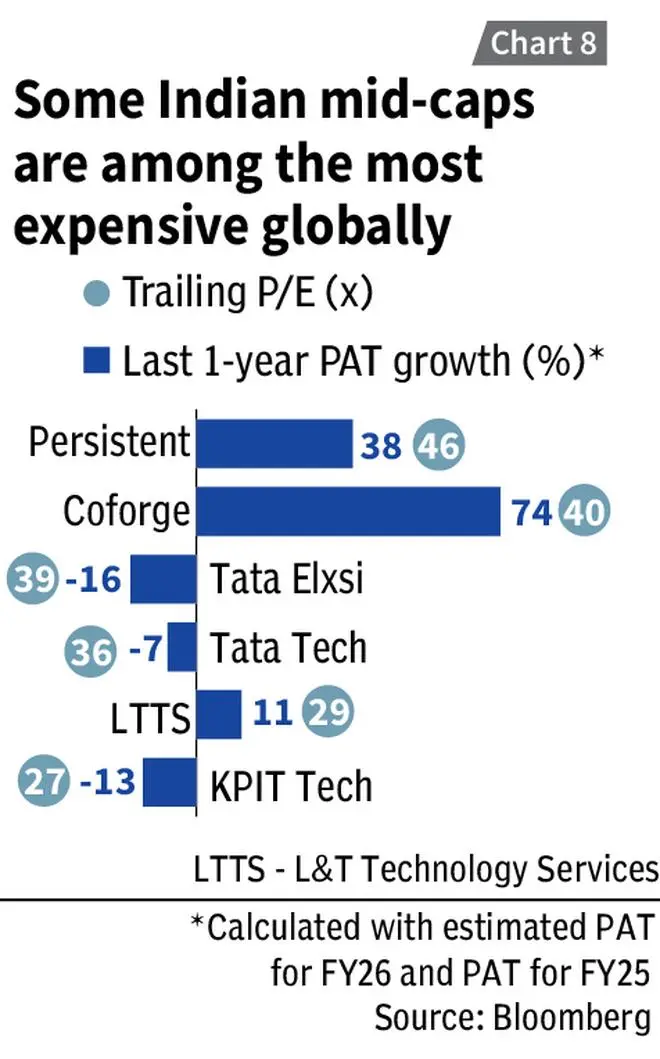
Their earnings growth rates of do not justify their valuation, especially when investors globally are clueless on the extent of disruption to IT business models. While the likes of Persistent and Coforge have delivered strong growth recently, sustainability of the same remains to be seen.
The AI game is evolving day-by-day and so will the uncertainty for a while. Caution over aggression would be a better investing approach in this context.
Published on February 21, 2026