

惯性聚合 高效追踪和阅读你感兴趣的博客、新闻、科技资讯
阅读原文 在惯性聚合中打开

推荐订阅源

Hacker News: Ask HN
Hacker News: Ask HN
Recent Commits to openclaw:main
cs.CV updates on arXiv.org
C
Check Point Blog
S
Security Affairs
Hacker News - Newest:
Hacker News - Newest: "LLM"
S
Secure Thoughts
Recorded Future
Recorded Future
cs.AI updates on arXiv.org
T
The Blog of Author Tim Ferriss
B
Blog
C
Cybersecurity and Infrastructure Security Agency CISA
Google DeepMind News
CTFtime.org: upcoming CTF events
A
Arctic Wolf
T
The Exploit Database - CXSecurity.com
Stack Overflow Blog
Stack Overflow Blog
T
Threat Research - Cisco Blogs
GbyAI
GbyAI
AWS News Blog
AWS News Blog
MongoDB | Blog
MongoDB | Blog
Y
Y Combinator Blog
Google Online Security Blog
T
Troy Hunt's Blog
I
InfoQ
L
LINUX DO - 热门话题
WordPress大学
WordPress大学
C
Cisco Blogs
G
GRAHAM CLULEY
The Register - Security
A
About on SuperTechFans
让小产品的独立变现更简单 - ezindie.com
Schneier on Security
Project Zero
Project Zero
H
Hackread – Cybersecurity News, Data Breaches, AI and More
P
Privacy & Cybersecurity Law Blog
Cloudbric
Cloudbric
H
Hacker News: Front Page
小众软件
小众软件
雷峰网
雷峰网
The Hacker News
The Hacker News
www.infosecurity-magazine.com
T
Tor Project blog
博客园 - 聂微东
N
Netflix TechBlog - Medium
V
Vulnerabilities – Threatpost
The GitHub Blog
The GitHub Blog
腾讯CDC
P
Palo Alto Networks Blog
Scott Helme
Scott Helme

博客园 - dataxiu.com

[原创.数据可视化系列之十三]idw反距离权重插值算法的javascript代码实现 [原创.数据可视化系列之十二]使用 nodejs通过async await建立同步数据抓取 [原创.数据可视化系列之八]使用等d3进行灰度图转伪彩色 [原创.数据可视化系列之七]阿里竞赛作品技术展示 [原创.数据可视化系列之六]使用openlyaers进行公网地图剪切 [原创.数据可视化系列之五]韩国"萨德"系统防御图 [原创.数据可视化系列之三]使用Ol3加载大量点数据 [原创.数据可视化系列之二]使用cesium三维地图展示美国全球军事基地分布 [原创.数据可视化系列之一]使用openlayers 3 显示聚合数据 管理类软件的界面模板。 使用SilverLight开发ARPG游戏(一) 买联想学生机器的遭遇:问联想1(连载) 联想09年春节学生机开卖了。 谈UrlRewriter在XP和2003上IIS设置的差异 使用SilverLight构建插件式应用程序(九) —聊天插件客户端的实现 .NET 访问JAVA的WebService使用SOAP头 使用SilverLight构建插件式应用程序(八) —聊天插件Duplex WCF的实现 使用SilverLight构建插件式应用程序(七) 使用SilverLight构建插件式应用程序(六)
[原创.数据可视化系列之四]跨平台,多格式的等值线和等值面的生成
dataxiu.com · 2016-06-03 · via 博客园 - dataxiu.com

   这些年做项目的时候,碰到等值面基本都是arcgis server来支撑的,通过构建GP服务,一般的都能满足做等值线和等值面的需求。可是突然有一天,我发现如果没有arcgis server 的话,我既然没法生成等值面等值线了。况且,还有许多别的要求:

  1. 没有arcgis server支持,arcgis server毕竟是很大一笔开销,个人基本无法负担;

  2. 跨平台,有的服务器是linux,有的是windows,看来,只能是java的类库了;

  3. 免费,生成等值线和等值面的程序不能有费用;

  4. 输出多种格式,既能输出图片格式,又能输出矢量格式,尤其是 kml之类的矢量数据;

     在气象家园http://bbs.06climate.com/找到一个很不错的解决方案,MeteoInfo,作者是一个很厉害的人,具体的不说了,大家可以去看他的网站和博客,下面我说说如何使用他的类库来进行等值面的生成。如果大家有很好的类似的库,欢迎推荐给我,谢谢。

1:引用他的项目中的lib目录中的jar包,生成窗口对象:

  1 MapView mapView = new MapView();
  2 mapView.setBackground(new Color(255, 255, 255, 0));
  3 mapView.setBounds(0, 0, 200, 200);
  4 VectorLayer clipLayer = MapDataManage.readMapFile_ShapeFile(“d:/chengdu.shp”); //剪切图层,就是生成等值面的形状范围,
    //使用shp最方便了,这儿有一个坑,就是你是用的shp可以通过他自带的软件加载显示才行,否则程序会异常,至于为啥有的shp不能加载,我也没搞清楚
    //反正这个坑让我趟过去了。

2:添加站点信息,用于插值

  1 StationData stationData = new StationData();
  2 //
  3 for(int i=0;i<10;i++)
  4 {
  5 stationData.addData("st"+i, 114+0.1*i, 35+0.1*i, i*10); //站点名称,经度,维度,值
  6 }

3:设定插值参数

  1 GridDataSetting gridDataSetting = new GridDataSetting();
  2 gridDataSetting.dataExtent = clipLayer.getExtent();
  3 stationData.projInfo = clipLayer.getProjInfo();
  4 gridDataSetting.xNum = contourconfig.getGridx();// 格点点数
  5 gridDataSetting.yNum = contourconfig.getGridy();// 格点点数
  6 
  7 InterpolationSetting interSet = new InterpolationSetting();
  8 
  9 interSet.setGridDataSetting(gridDataSetting);
 10 interSet.setInterpolationMethod(InterpolationMethods.IDW_Radius);
 11 interSet.setRadius(5);
 12 interSet.setMinPointNum(1);
 13 GridData gridData = stationData.interpolateData(interSet);
 14 
 15 LegendScheme legendScheme =LegendManage.createLegendSchemeFromGridData(gridData, LegendType.UniqueValue,ShapeTypes.Polygon);
4:插值生成图层:
  1 VectorLayer contourLayer = DrawMeteoData.createShadedLayer(gridData, legendScheme, "ContourLayer", "Data",
  2 					true);
  3 VectorLayer lastLayer = contourLayer.clip(clipLayer);
  4 mapView.addLayer(lastLayer);

5:导出数据,可以是kml或者png之类的图片格式

  1 mapView.exportToPicture(“d:/ddd.png”); //地图导出为图片
  2 //地图导出为kml
  3 lastLayer.saveAsKMLFile(“d:/ddd.kml”);

这是使用这个做出的效果图之一:
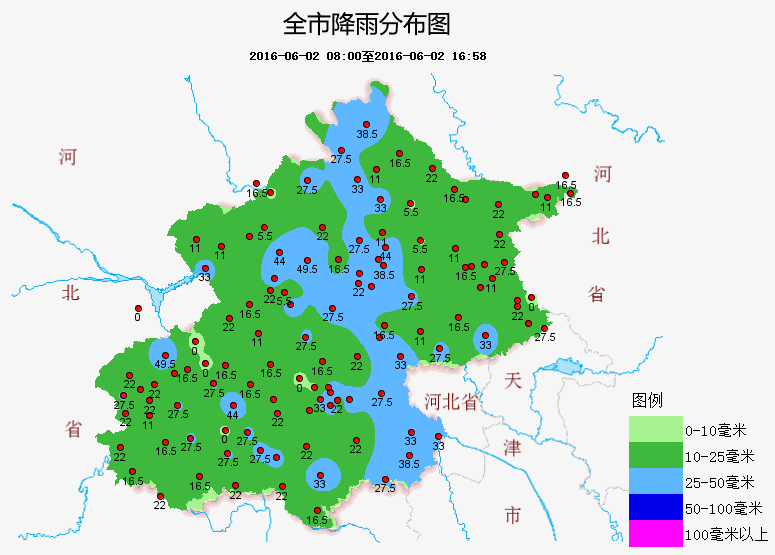
2016-06-02 1658

浏览数据秀(dataxiu.com)网站,了解更多数据可视化方法技术。