








<template>
  <div class="app">
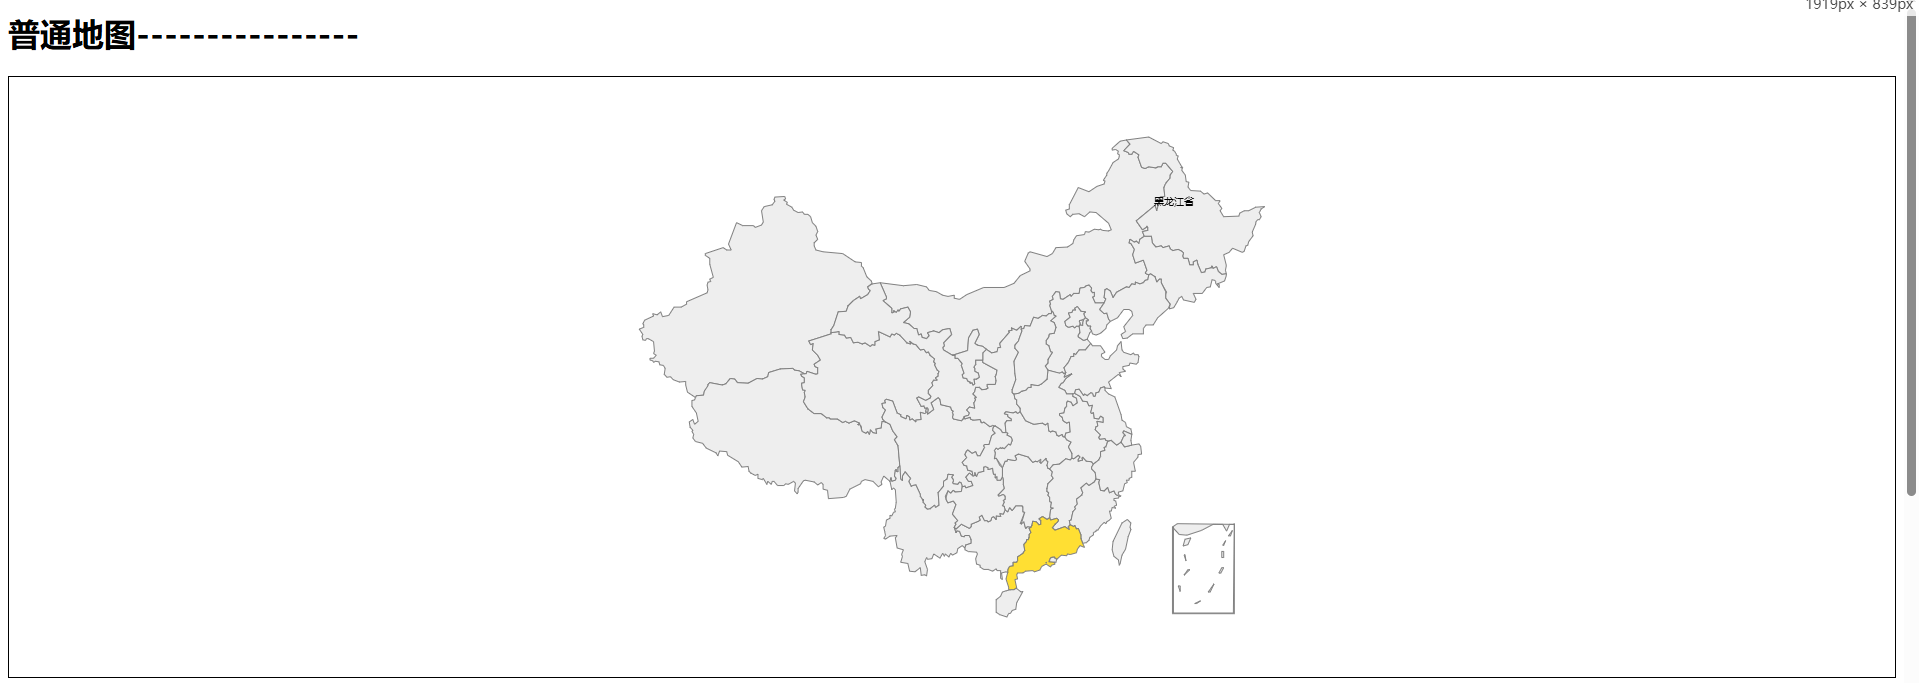
    <h1>普通地图----------------</h1>
    <div class="map-container" ref="map_ref"></div>
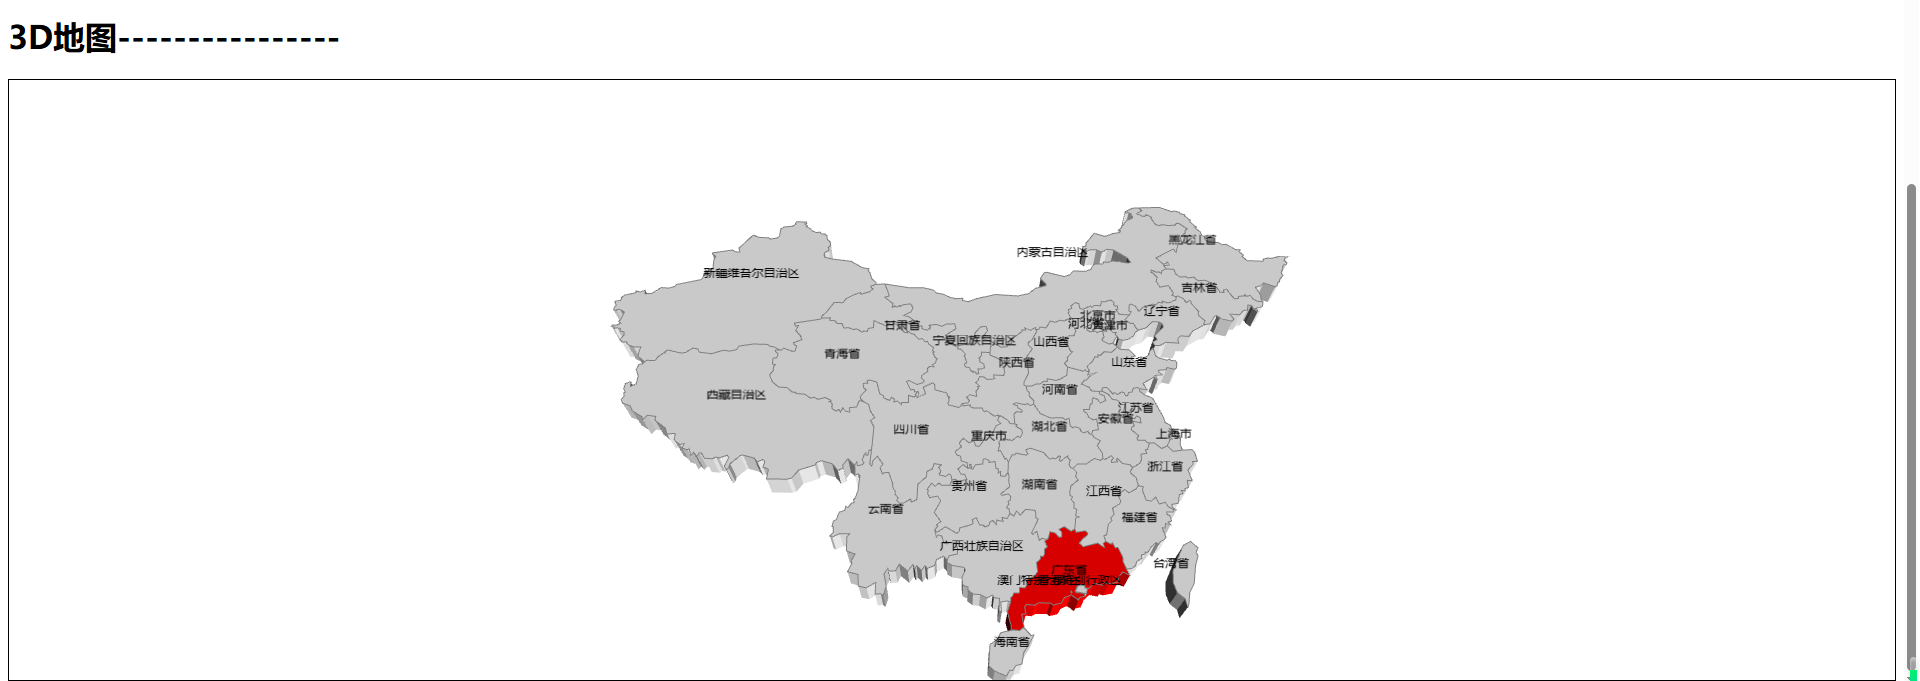
    <h1>3D地图----------------</h1>
    <div class="map-container" ref="map_ref_2"></div>
  </div>
</template>

<script>
import * as echarts from 'echarts'
import 'echarts-gl'
// 1. 引入china国家的json数据
// import * as geojson from 'world-geojson'
// const china_json = geojson.forCountry('china')
import china_json from './config/china.json'
echarts.registerMap('china', china_json)

export default {
  data() {
    return {
      chart_instance: null,
      chart_instance_2: null,
    }
  },
  mounted() {
    this.initMap()
    this.initMap2()
  },
  methods: {
    initMap() {
      const chart_instance = echarts.init(this.$refs.map_ref)
      var option = {
        series: [
          {
            type: 'map',
            map: 'china',
            label: {
              show: true,
              color: '#000', //地图初始化区域字体颜色
              fontSize: 10,
              formatter: function (params) {
                if (params.name == '黑龙江省') return params.name
                return ''
              },
            },
            itemStyle: {
              // 未选择区域的样式
              normal: {
                areaColor: '#eeeeee',
                color: 'white',
                borderColor: 'gray',
                borderWidth: 1,
              },
              emphasis: {
                // 选择区域的样式
                areaColor: '#ffdf33',
              },
            },
            data: [
              {
                name: '广东省', //这个对应的是json的数据
                selected: true, // 将该区域设置为默认高亮
              },
            ],
          },
        ],
      }
      chart_instance.setOption(option)
      this.chart_instance = chart_instance
    },
    initMap2() {
      const chart_instance = echarts.init(this.$refs.map_ref_2)
      var option = {
        geo3D: {
          map: 'china', //注册地图的名字
          roam: true, //开启鼠标缩放和平移漫游。默认不开启
          itemStyle: {
            color: '#eee', // 背景

            opacity: 1, //透明度
            borderWidth: 1, // 边框宽度
            borderColor: 'gray', // 边框颜色
            fontSize: 10, //
          },
          emphasis: {
            itemStyle: {
              color: '#ffdf33',
            },
          },
          label: {
            show: true,
          },
          viewControl: {
            distance: 100,
            alpha: 45, // 上下旋转的角度
            beta: 0, // 左右旋转的角度
          },
          regions: [
            {
              name: '广东省',
              itemStyle: {
                color: '#f00',
              },
            },
          ],
        },
      }
      chart_instance.setOption(option)
      this.chart_instance_2 = chart_instance
    },
  },
}
</script>

<style lang="less" scoped>
.map-container {
  height: 600px;
  border: 1px solid;
}
</style>
此内容由惯性聚合(RSS阅读器)自动聚合整理,仅供阅读参考。 原文来自 — 版权归原作者所有。