












背景
使用jmeter对系统进行压力测试,该业务流程请求大致调用:jmeter压力机 ——> A系统 ——> B系统 ——> A系统. A 系统作为基础平台,请求先到A系统,然后转到具体的B业务系统,B接口逻辑中需要调用A系统查询基础数据。
问题描述
当使用高并发访问系统时,整个系统卡住,A系统和B系统的所有接口都不能访问。
问题定位
1、通过grafana,查看A、B服务器资源(CPU、内存、带宽、磁盘等)均没有到达瓶颈,所以应该不是机器资源的问题,排除;
2、查看A、B系统JVM垃圾回收情况 jstat -gc pid 1000 50,查看50次垃圾回收情况,基本没啥变化,暂时排除fullgc;
3、查看A、B系统线程栈:jstack -l pid |grep java.lang.Thread.State | awk '{print $2$3$4$5}' | sort | uniq -c,发现有较多的runnable线程,使用jstack打印线程栈,看看都是什么线程?
"XNIO-1 task-32" #3995 prio=5 os_prio=0 tid=0x00007f52e8077000 nid=0x3ed4 runnable [0x00007f526b97a000]
   java.lang.Thread.State: RUNNABLE
    at java.net.SocketInputStream.socketRead0(Native Method)
    at java.net.SocketInputStream.socketRead(SocketInputStream.java:116)
    at java.net.SocketInputStream.read(SocketInputStream.java:171)
    at java.net.SocketInputStream.read(SocketInputStream.java:141)
    at okio.InputStreamSource.read(JvmOkio.kt:90)
    at okio.AsyncTimeout$source$1.read(AsyncTimeout.kt:129)
    at okio.RealBufferedSource.indexOf(RealBufferedSource.kt:427)
    at okio.RealBufferedSource.readUtf8LineStrict(RealBufferedSource.kt:320)
    at okhttp3.internal.http1.HeadersReader.readLine(HeadersReader.kt:29)
    at okhttp3.internal.http1.Http1ExchangeCodec.readResponseHeaders(Http1ExchangeCodec.kt:178)
    at okhttp3.internal.connection.Exchange.readResponseHeaders(Exchange.kt:106)
    at okhttp3.internal.http.CallServerInterceptor.intercept(CallServerInterceptor.kt:79)
    at okhttp3.internal.http.RealInterceptorChain.proceed(RealInterceptorChain.kt:109)
    at okhttp3.internal.connection.ConnectInterceptor.intercept(ConnectInterceptor.kt:34)
    at okhttp3.internal.http.RealInterceptorChain.proceed(RealInterceptorChain.kt:109)
    at okhttp3.internal.cache.CacheInterceptor.intercept(CacheInterceptor.kt:95)
    at okhttp3.internal.http.RealInterceptorChain.proceed(RealInterceptorChain.kt:109)
    at okhttp3.internal.http.BridgeInterceptor.intercept(BridgeInterceptor.kt:83)
    at okhttp3.internal.http.RealInterceptorChain.proceed(RealInterceptorChain.kt:109)
    at okhttp3.internal.http.RetryAndFollowUpInterceptor.intercept(RetryAndFollowUpInterceptor.kt:76)
    at okhttp3.internal.http.RealInterceptorChain.proceed(RealInterceptorChain.kt:109)
    at okhttp3.internal.connection.RealCall.getResponseWithInterceptorChain$okhttp(RealCall.kt:201)
    at okhttp3.internal.connection.RealCall.execute(RealCall.kt:154)
    at feign.okhttp.OkHttpClient.execute(OkHttpClient.java:180)
    at feign.SynchronousMethodHandler.executeAndDecode(SynchronousMethodHandler.java:121)
    at feign.SynchronousMethodHandler.invoke(SynchronousMethodHandler.java:91)
    at feign.ReflectiveFeign$FeignInvocationHandler.invoke(ReflectiveFeign.java:100)
    ......
    at io.undertow.servlet.handlers.ServletInitialHandler.dispatchRequest(ServletInitialHandler.java:255)
    at io.undertow.servlet.handlers.ServletInitialHandler.access$000(ServletInitialHandler.java:79)
    at io.undertow.servlet.handlers.ServletInitialHandler$1.handleRequest(ServletInitialHandler.java:100)
    at io.undertow.server.Connectors.executeRootHandler(Connectors.java:387)
    at io.undertow.server.HttpServerExchange$1.run(HttpServerExchange.java:852)
    at org.jboss.threads.ContextClassLoaderSavingRunnable.run(ContextClassLoaderSavingRunnable.java:35)
    at org.jboss.threads.EnhancedQueueExecutor.safeRun(EnhancedQueueExecutor.java:2019)
    at org.jboss.threads.EnhancedQueueExecutor$ThreadBody.doRunTask(EnhancedQueueExecutor.java:1558)
    at org.jboss.threads.EnhancedQueueExecutor$ThreadBody.run(EnhancedQueueExecutor.java:1423)
    at org.xnio.XnioWorker$WorkerThreadFactory$1$1.run(XnioWorker.java:1282)
    at java.lang.Thread.run(Thread.java:750)
问题分析
为什么出现这么多挂起的Socket连接线程?
1、网上查资料说未设置超时时间Read Timeout会导致Socket挂起,参考:JDK-8075484,检查A、B系统的nacos里的配置了设置超时时间。
(1)检查nacos里配置,发现有配置,7200000,2小时
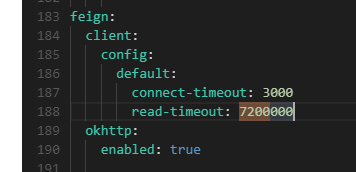
(2)配置了,但是有没有生效呢?spring会使用自动配置类来实例化这些配置,通过idea在jar包里一顿查找,最后找到了Feign相关的配置类:org.springframework.cloud.openfeign.FeignClientProperties

readTimeout在org.springframework.cloud.openfeign.FeignClientProperties属性config里,config是一个hashMap,想到可以使用arthas的vmtool来查看readTimeout的值
[arthas@32383]$ vmtool --action getInstances --className org.springframework.cloud.openfeign.FeignClientProperties -x 4
@FeignClientProperties[][
    @FeignClientProperties[
        defaultToProperties=@Boolean[true],
        defaultConfig=@String[default],
        config=@HashMap[
            @String[default]:@FeignClientConfiguration[
                loggerLevel=null,
                connectTimeout=@Integer[3000],
                readTimeout=@Integer[7200000],
                retryer=null,
                errorDecoder=null,
                requestInterceptors=null,
                defaultRequestHeaders=null,
                defaultQueryParameters=null,
                decode404=null,
                decoder=null,
                encoder=null,
                contract=null,
                exceptionPropagationPolicy=null,
                capabilities=null,
                queryMapEncoder=null,
                metrics=null,
                followRedirects=null,
            ],
        ],
        decodeSlash=@Boolean[true],
    ],
]
注意:-x 4 是展开第四层,FeignClientProperties是第一层,config是第二层,FeignClientConfiguration是第三层,readTimeout就是第四层。
2、排除了未设置readTimeout,还有什么其他原因呢?系统为什么卡住呢,是不是工作线程配置的太少,然后检查Springboot web容器里的工作线程数,这里我走了点弯路,我想当然的认为A、B系统里使用内置的Tomcat,然后检查了Spring boot 里Tomcat的工作线程配置,但是问题仍然未解决?然后就继续来看这个jatsck日志,发现栈的起始调用有大量的io.undertow日志,这是什么呢?经过上网一顿搜索,原来Springboot默认内置了三种web容器:tomcat、jetty、undertow,参考:undertow吊打tomcat,undertow处理高并发场景的性能 优于tomcat和tomcat,因此很多系统默认选择undertow作为web容器。通过pom或者启动日志可以确认。
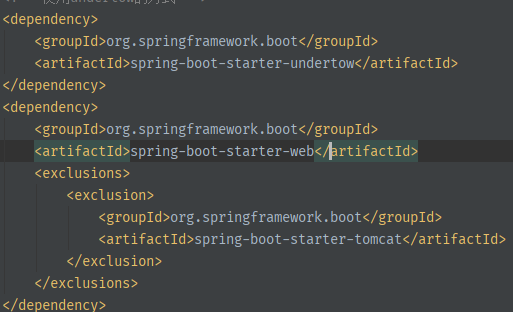
通过查看A、B系统pom配置,确认使用的都是undertow容器。
3、既然确认使用了undertow容器,那看看系统里配置undertow的工作线程是多少?检查nacos里配置

通过arthas thread命令查看A系统总线程数191,B系统总线程数183,也没有超过worker-threads,是不是配置没有生效呢?继续在idea里寻找undertow的自动配置类,一顿查找找到了:
org.springframework.boot.autoconfigure.web.ServerProperties,层级关系
ServerProperties
undertow
threads
io
worker

这里发现了问题:配置类的Io线程和工作线程的属性是:io和worker,不是io-threads,worker-threads,通过vmtool查看目前系统的工作线程数和Io线程数:
[arthas@5850]$ vmtool --action getInstances --className org.springframework.boot.autoconfigure.web.ServerProperties --express 'instances[0].undertow.threads'
@Threads[
    io=@Integer[4],
    worker=@Integer[32],
]
或者
[arthas@5850]$ vmtool --action getInstances --className org.springframework.boot.autoconfigure.web.ServerProperties -x 4
@ServerProperties[][
    @ServerProperties[
        port=@Integer[8083],
        address=null,
        ....
        undertow=@Undertow[
            ...
            threads=@Threads[
                io=@Integer[4],
                worker=@Integer[32],
            ],
            options=@Options[
                socket=@LinkedHashMap[isEmpty=true;size=0],
                server=@LinkedHashMap[isEmpty=true;size=0],
            ],
        ],
    ],
]
通过查看实例属性,工作线程数和Io线程数是默认值:io数等于核数,工作线程数=io数*8,所以目前系统里真正可用的工作线程数就是32。而nacos里配置的undertow的工作线程数由于变量不正确导致没有生效。
4、目前A、B系统里工作线程都是32,如何确认这32各工作线程都被使用了呢?还是通过jstack日志来确认。由于undertow产生的工作线程名称是名字的,一般是:XNIO-n task开始,n可以取1,2,3...;IO线程名称:XNIO-n I/O,n可以取1,2,3...。那我们直接去jstack里取统计一下:
[root@nodeA ~]# jstack -l 5850 |grep "XNIO-1 I/O" |wc -l
4
[root@nodeA ~]# jstack -l 5850 |grep "XNIO-1 task" |wc -l
32
通过日志来看,IO线程和工作线程确实占满了。
综上分析,当jmeter发起高并发请求时,A系统工作线程迅速打满32各工作线程来访问B系统,B系统当然也会启动32各工作线程来应对这些请求,但是B系统这32个线程需要向A系统再发起32个请求来查询基础数据,但是此时A系统没有额外的工作线程来响应B系统的请求,这样B系统向A系统发起的socket连接就会挂起,进而导致A系统调用B系统的32个线程也被挂起;就形成了目前系统所有接口无法访问的现象。那什么时候才会返回呢,看到上面配置的超时时间:7200000ms(2小时)后超时断开,请求才会返回。这里超时时间设置也不合理,2个小时太长了,黄花菜都凉了,应该限制在几秒以内,当然这需要优化接口的性能,这里先不修改超时时间配置,等优化代码后再调整。所以,调整undertow工作线程数配置
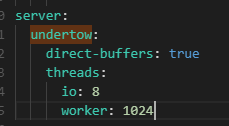
改完之后,通过arthas查看,A、B系统的工作线程数都增加了,再次通过jmeter压测,吞吐量增加了,系统也不再卡住了。
学习技术不是用来写HelloWorld和Demo的,而是要用来解决线上系统的真实问题的.
此内容由惯性聚合(RSS阅读器)自动聚合整理,仅供阅读参考。 原文来自 — 版权归原作者所有。