








把nginx日志修改成json格式,在nginx.conf中添加如下内容,重启nginx。
    log_format log_json '{"@timestamp":"$time_iso8601",'
                           '"http_host":"$http_host",'
                           '"clientip":"$remote_addr",'
                           '"request":"$request",'
                           '"status":"$status",'
                           '"size":"$body_bytes_sent",'
                           '"upstream_addr":"$upstream_addr",'
                           '"upstream_status":"$upstream_status",'
                           '"upstream_response_time":"$upstream_response_time",'
                           '"request_time":"$request_time",'
                           '"http_referer":"$http_referer",'
                           '"http_user_agent":"$http_user_agent",'
                           '"http_x_forwarded_for":"$http_x_forwarded_for"}';
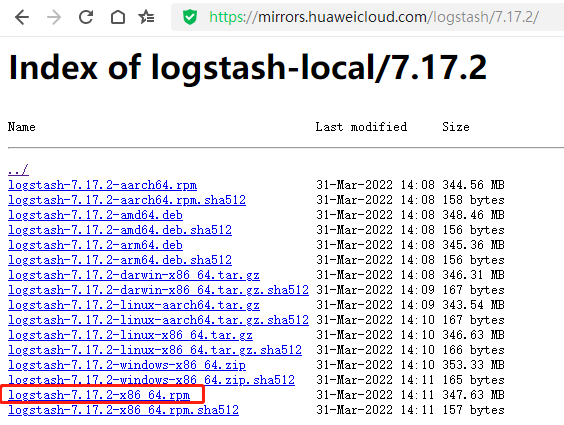
打开国内加速下载地址 https://mirrors.huaweicloud.com/logstash/ 安装你想要的版本,适合的操作系统。我的centos7直接下载rpm包后rpm -ivh logstash-7.17.2-x86_64.rpm
进入/etc/logstash/conf.d 添加nginx.conf配置,需要注意的是索引名字必须为logstash开头,在绘制地图图形的时候才可以正常使用。
input {
  file {
    path => "/www/wwwlogs/*access"
    start_position => "end"
    exclude => "*.gz"
    type => "access_log"
  }
  file {
    path => "/www/wwwlogs/*error"
    start_position => "end"
    exclude => "*.gz"
    type => "error_log"
  }

}

filter {
   json {
        source => "message"
   }
   grok {
        match => { "message" => "%{COMBINEDAPACHELOG}"}
   }
   geoip {
        source => "clientip"
        database =>"/usr/share/logstash/vendor/bundle/jruby/2.5.0/gems/logstash-filter-geoip-7.2.12-java/vendor/GeoLite2-City.mmdb"
        add_field => ["[geoip][coordinates]","%{[geoip][longitude]}"] # 获取经度
        add_field => ["[geoip][coordinates]","%{[geoip][latitude]}"] # 获取纬度
        fields => ["country_name","region_name","location"]
   }
   mutate {
        convert => ["[geoip][coordinates]","float"] # 修改经纬度为浮点数
   }
}

output {
  #stdout {
  #  codec => rubydebug
  #}
  if "access_log" in [type] {
     elasticsearch {
         hosts => ["10.128.0.116:9200"]
         index => "logstash-nginx-access-%{+YYYY.MM.dd}"
     }
  }
  if "error_log" in [type] {
     elasticsearch {
         hosts => ["10.128.0.116:9200"]
         index => "logstash-nginx-error-%{+YYYY.MM.dd}"
     }
  }
}
方法同上,自己看着弄吧。记得优化kibana启动内存,elasticsearch的jvm.options配置,免得太卡。
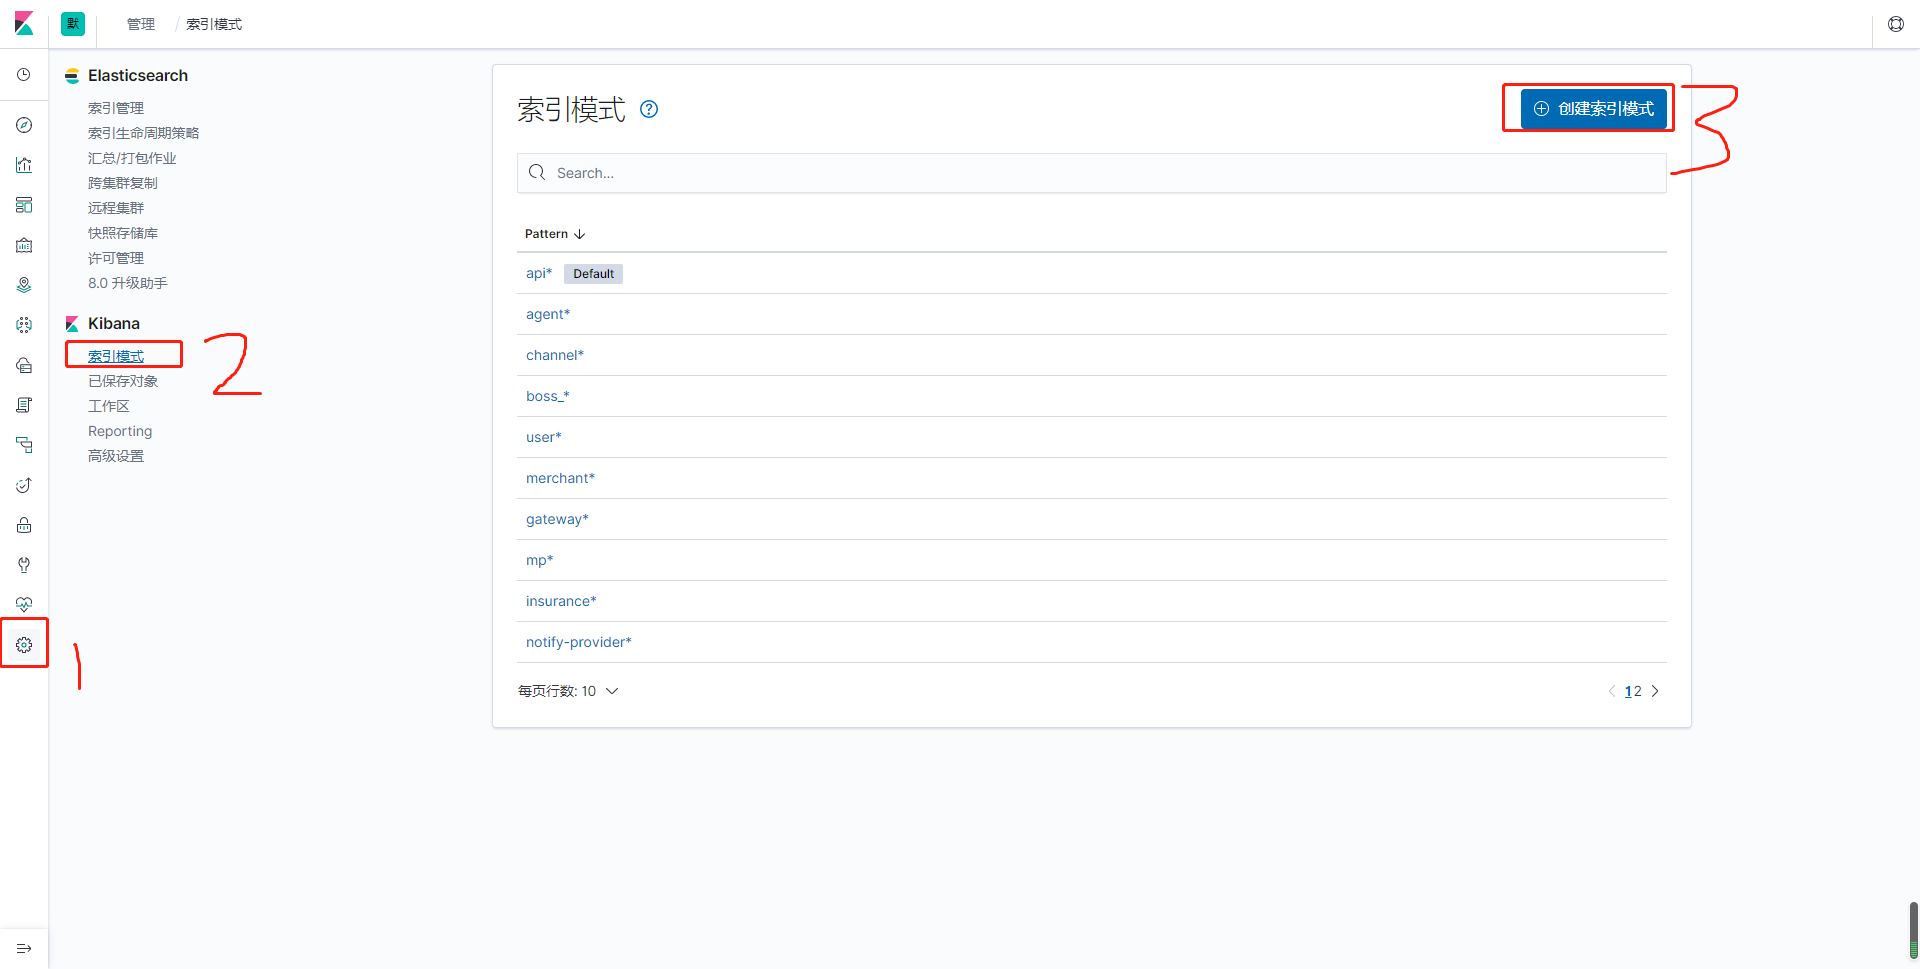
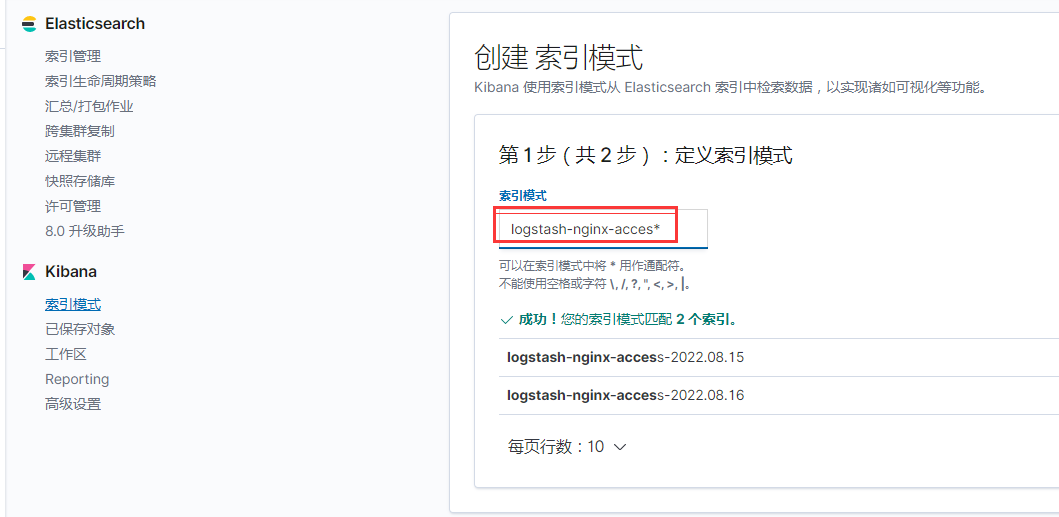
把索引名字命名为logstash-nginx-access*保存。
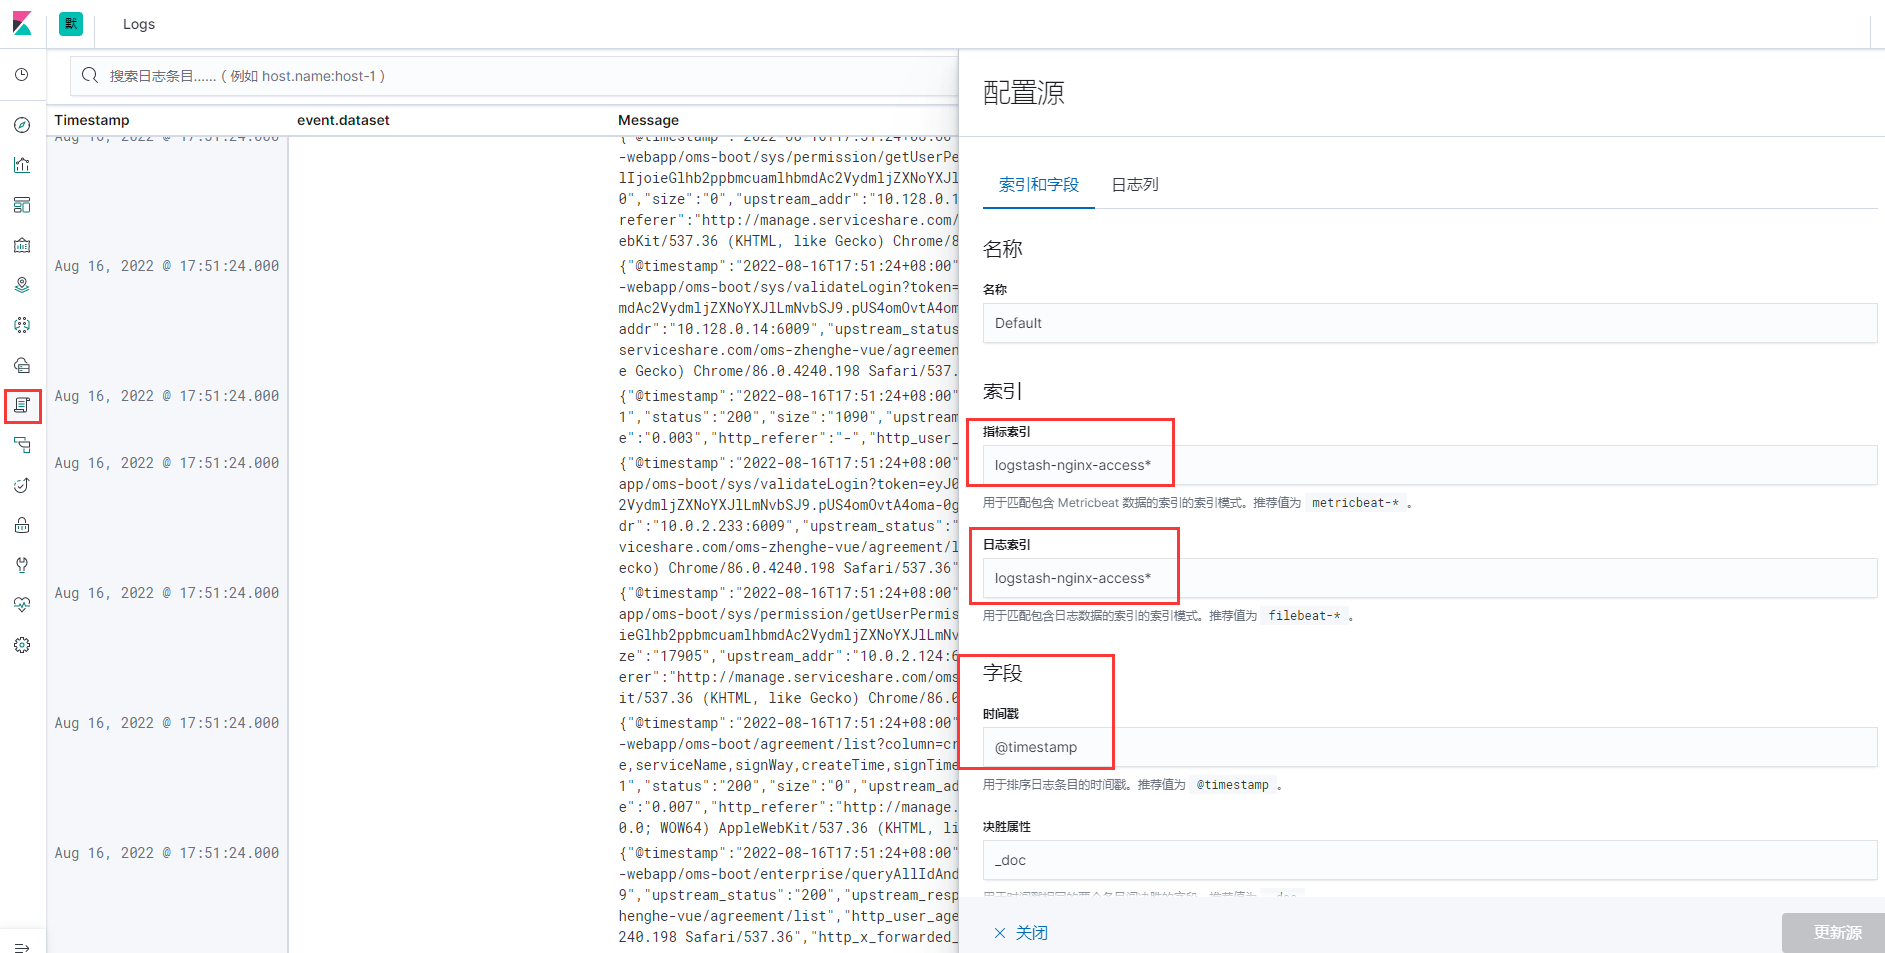
如图所示配置,更新源后。右上角可以设置实时读取日志流。此步骤不影响第七步骤内容,可以忽略。
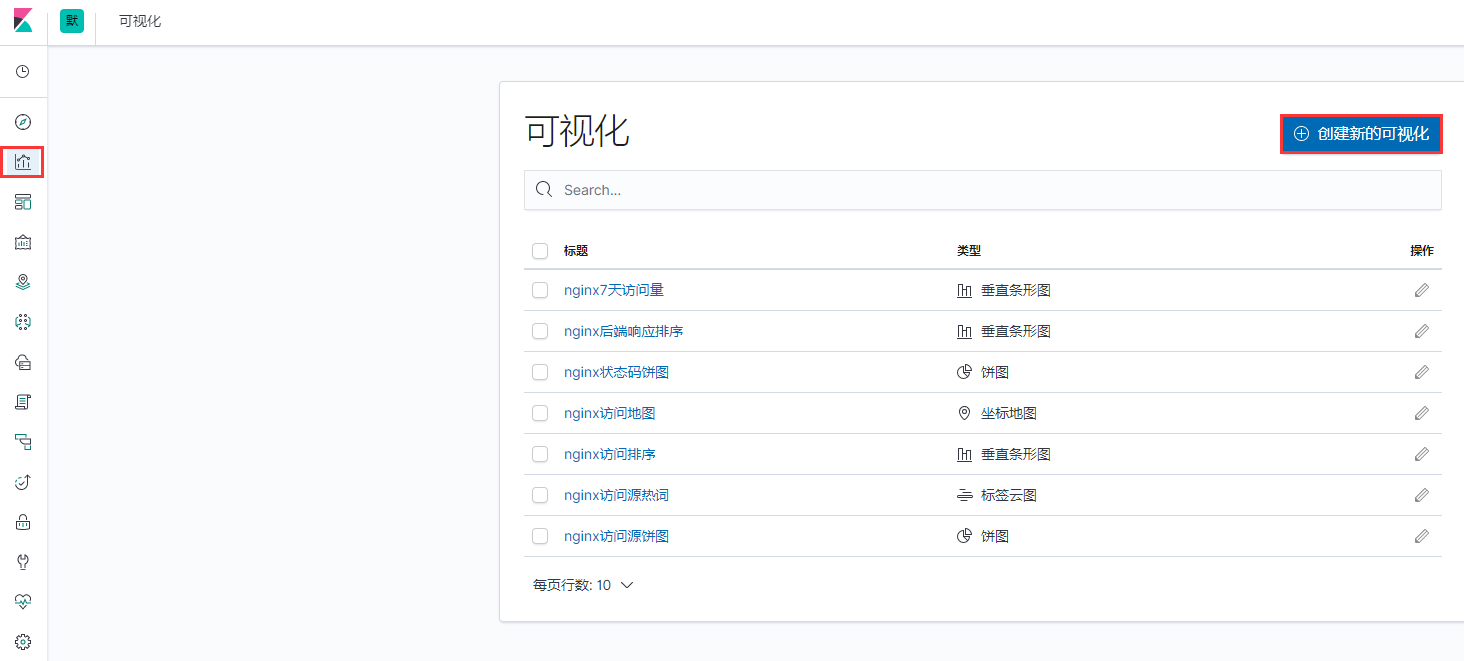
1.首选创建一个最高大上的地图可视化,选择坐标地图。
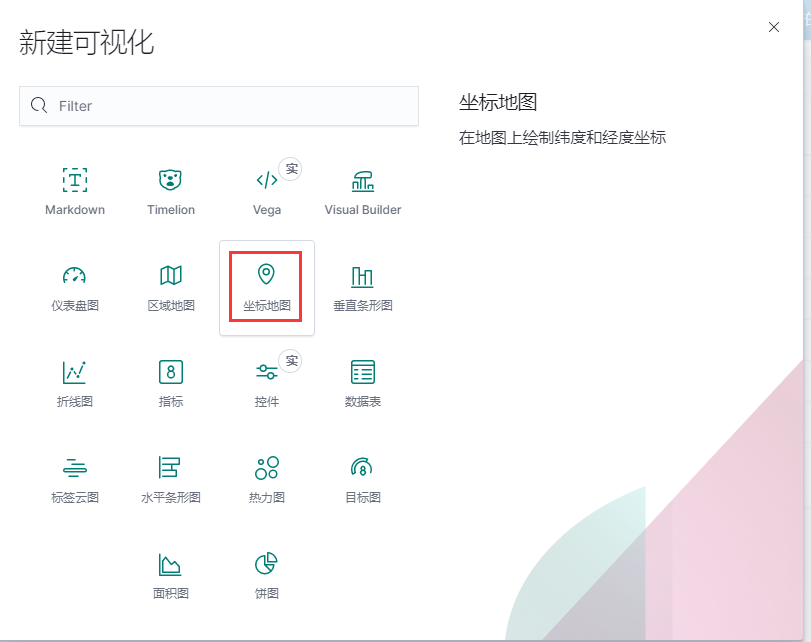
此图要求索引名字以logstash-开头,否则存储桶中字段报错。
按上图设置后,右上角保存。
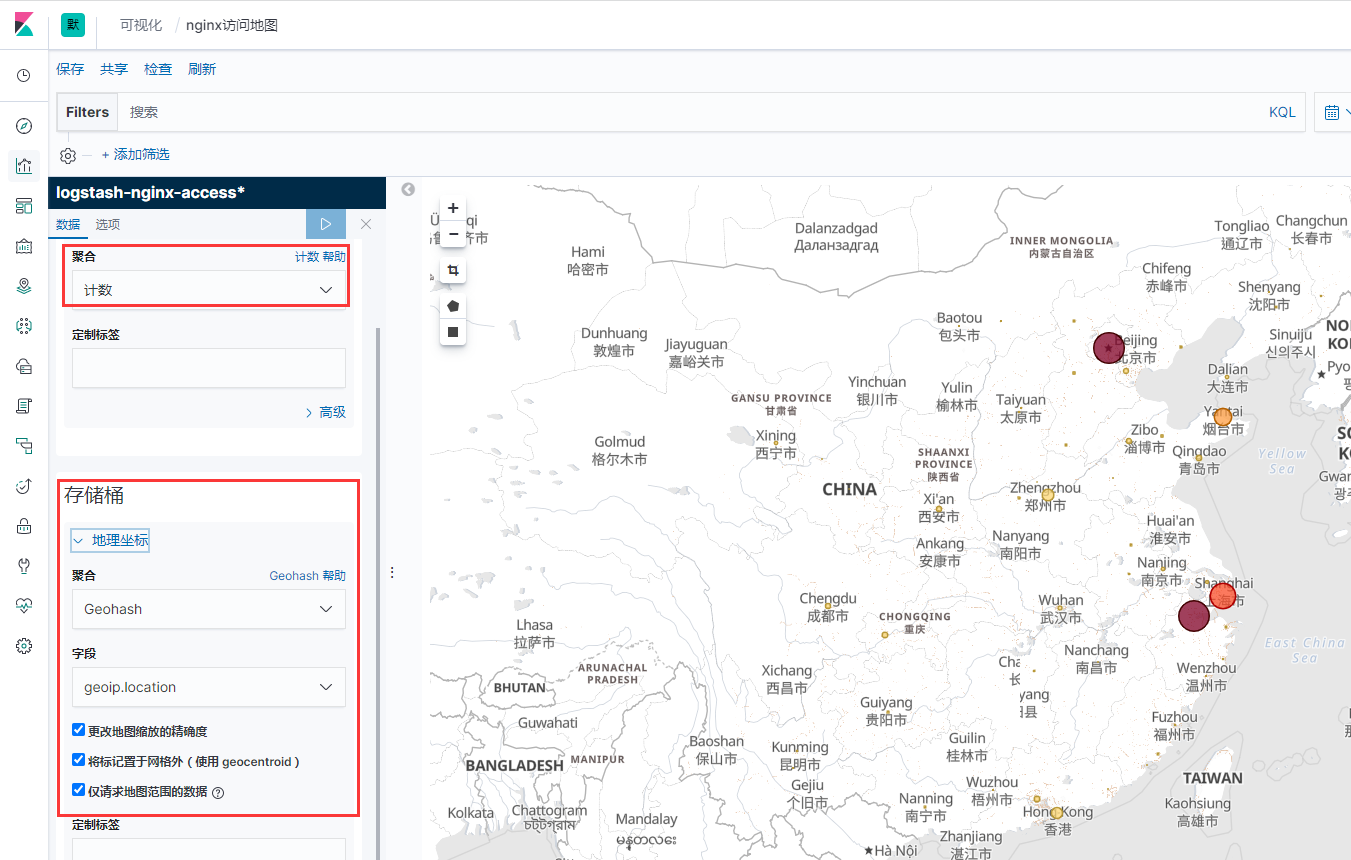
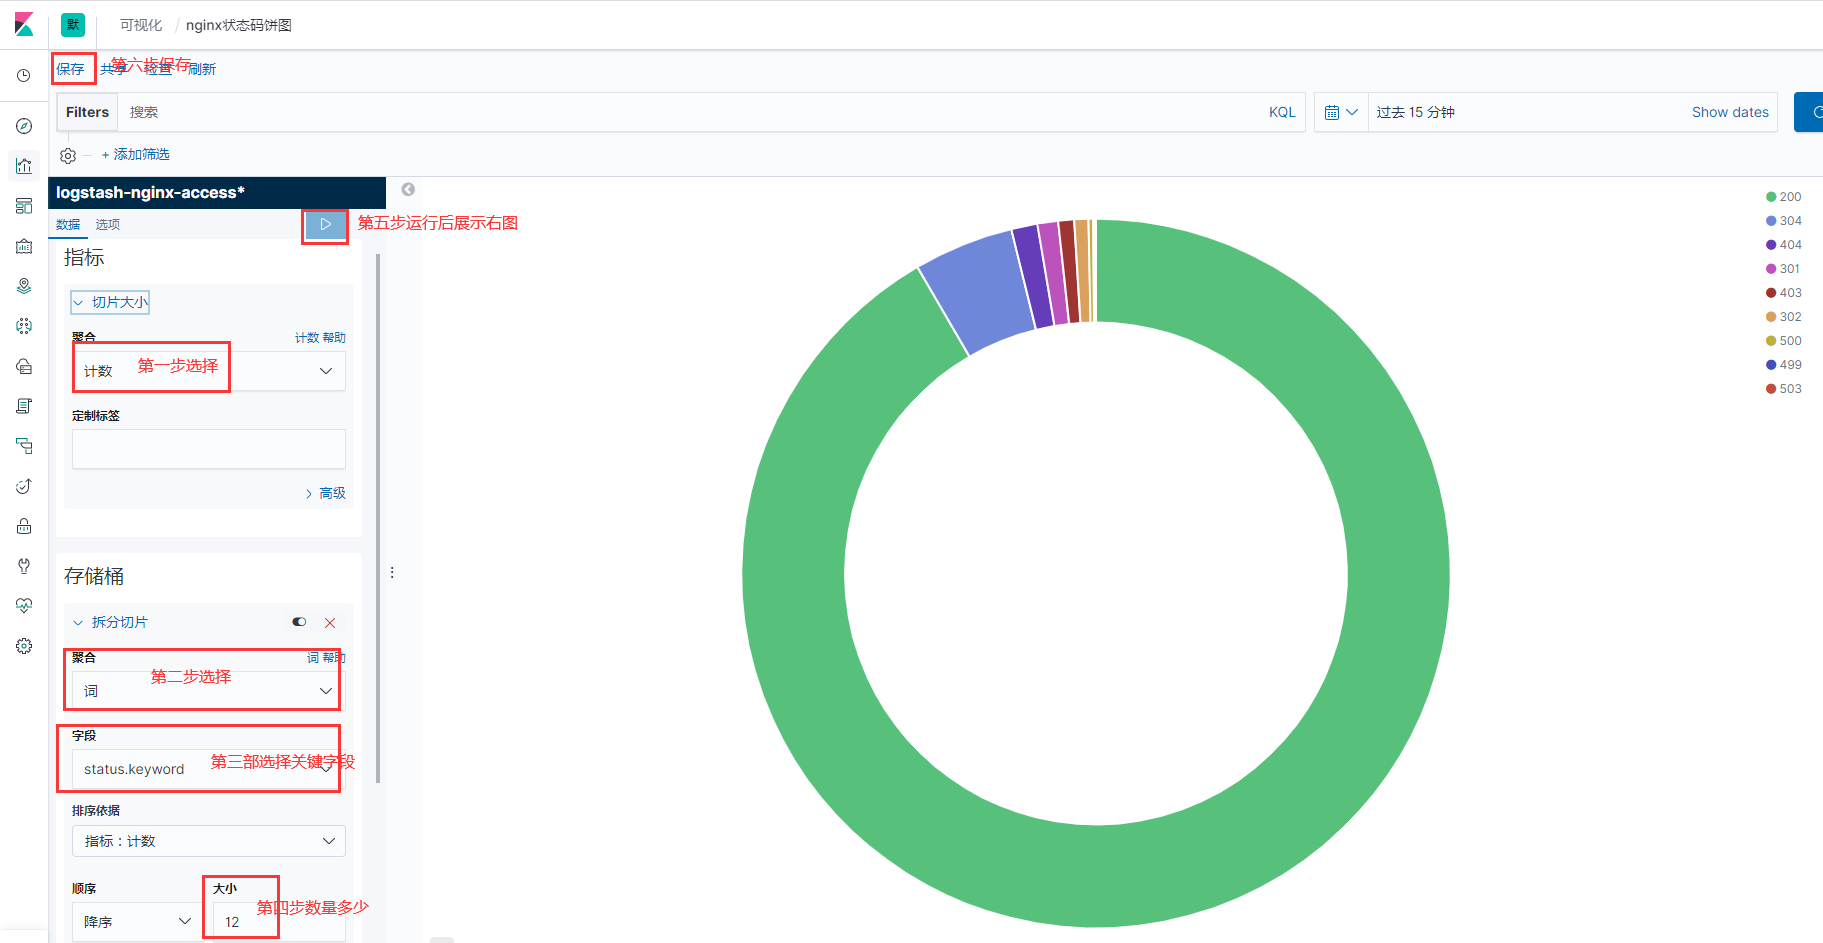
2.创建状态码饼状图
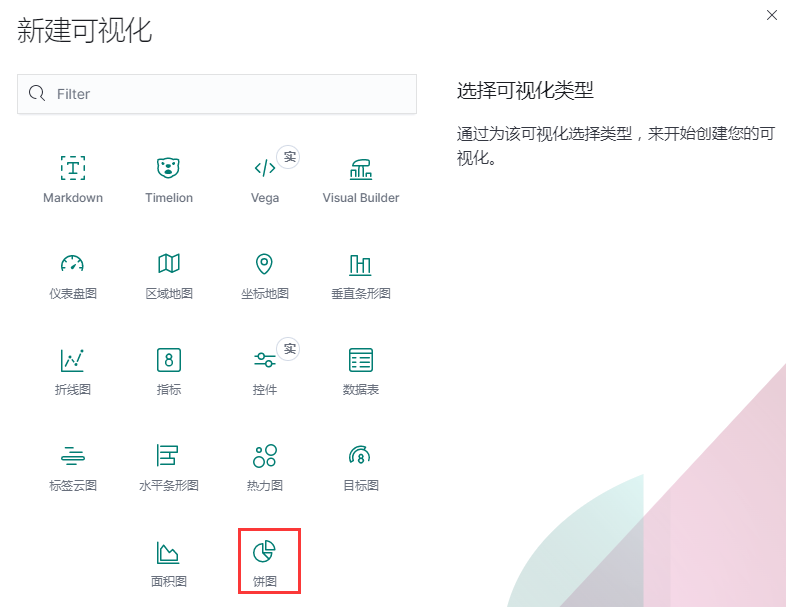
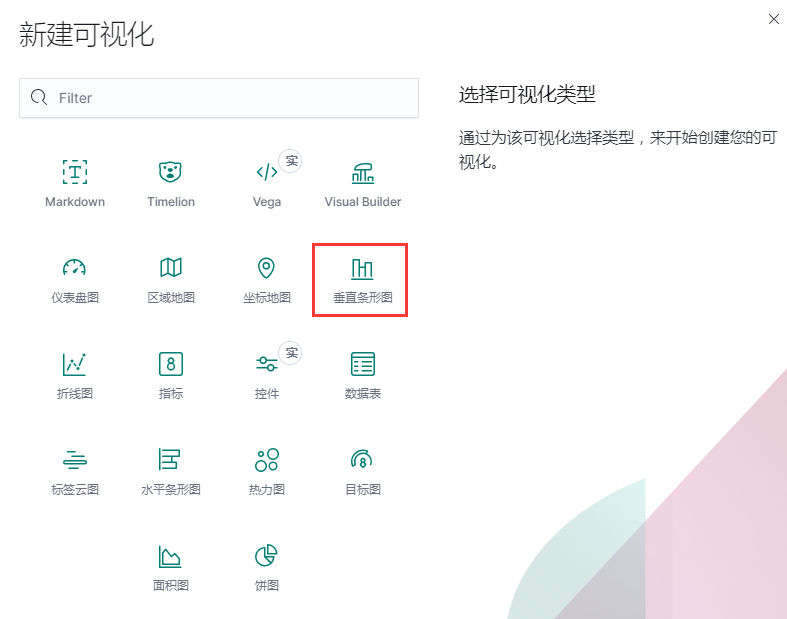
3.创建nginx访问排序。
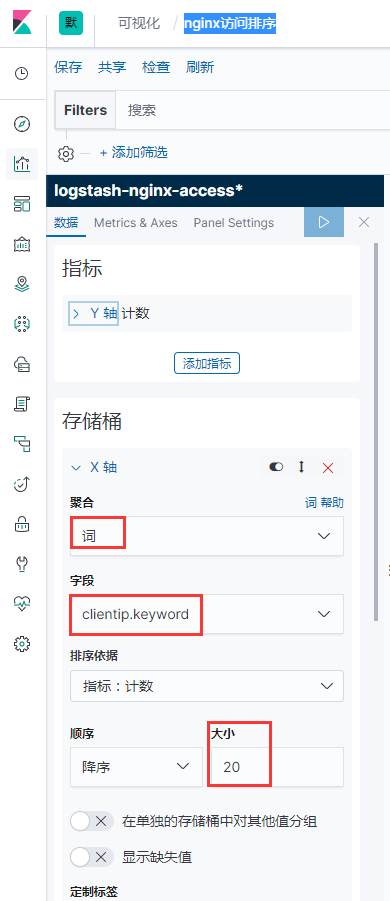
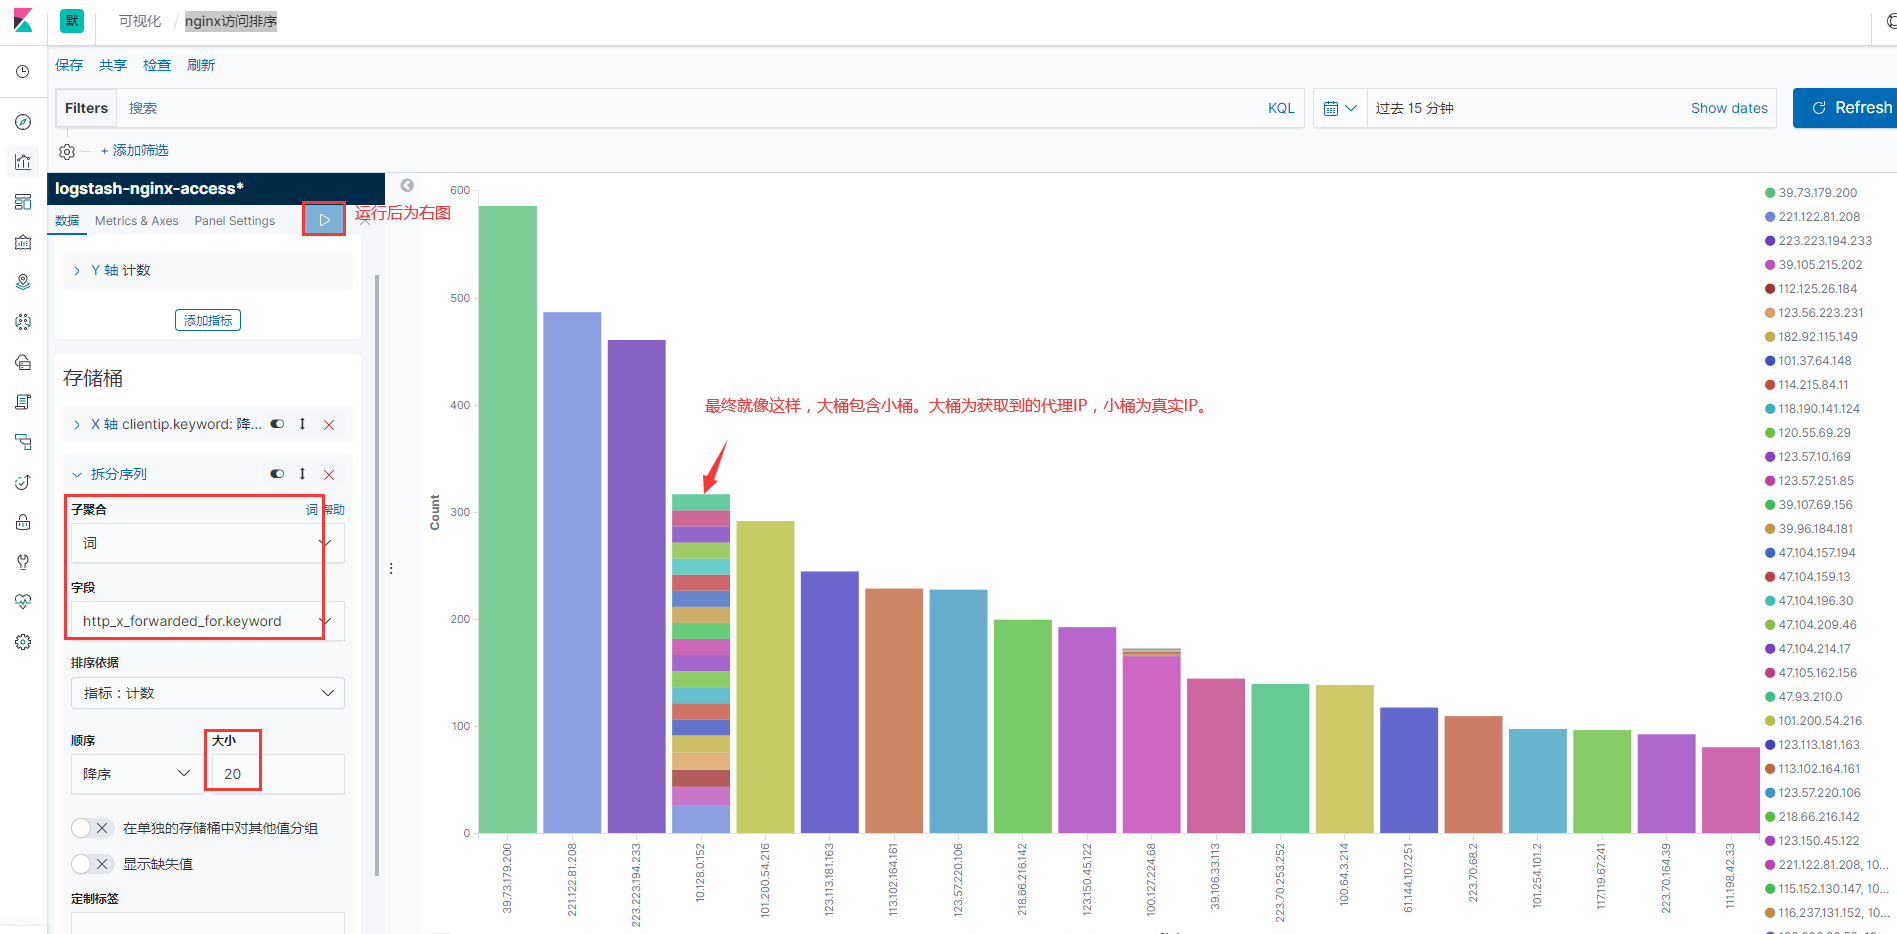
由于nginx中通常会获取到多个IP地址,获取到的代理IP理论上大于真实IP地址。所以这次要做两个桶,让他们形成包含关系,大桶装小桶。
Y轴仍然是计数,X轴为获取到代理IP关键词,X轴为大桶,统计前20个IP。
拆分序列为小桶
此内容由惯性聚合(RSS阅读器)自动聚合整理,仅供阅读参考。 原文来自 — 版权归原作者所有。