








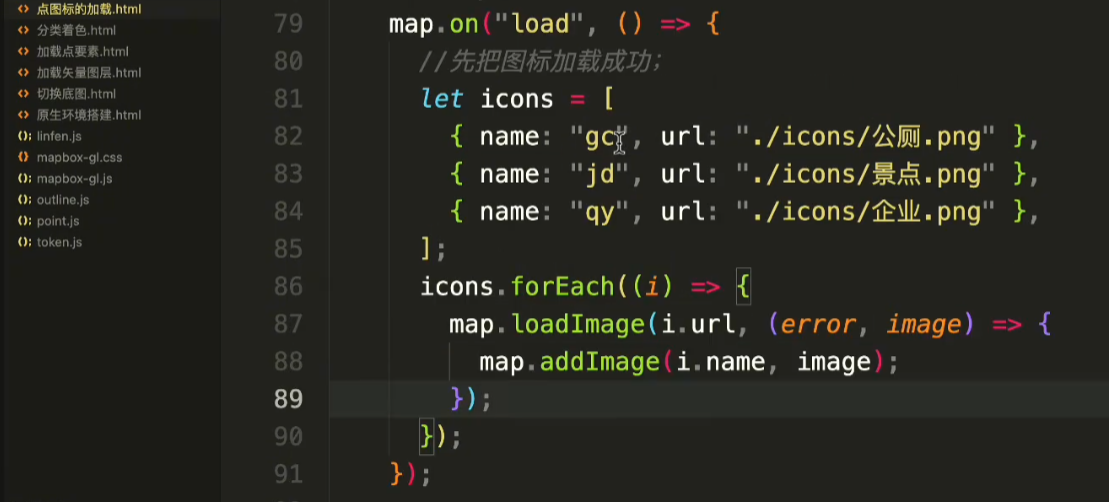
  1 <!DOCTYPE html>
  2 <html>
  3 <head>
  4 <meta charset="utf-8">
  5 <title>Create and style clusters</title>
  6 <meta name="viewport" content="initial-scale=1,maximum-scale=1,user-scalable=no">
  7 <link href="https://api.mapbox.com/mapbox-gl-js/v3.5.1/mapbox-gl.css" rel="stylesheet">
  8 <script src="https://api.mapbox.com/mapbox-gl-js/v3.5.1/mapbox-gl.js"></script>
  9 <style>
 10 body { margin: 0; padding: 0; }
 11 #map { position: absolute; top: 0; bottom: 0; width: 100%; }
 12 </style>
 13 </head>
 14 <body>
 15 <div id="map"></div>
 16
 17 <script>
 18     mapboxgl.accessToken = 'pk.eyJ1IjoiY3B0aHJzdW4iLCJhIjoiY2x4YjlvdjhrMGY5eTJrcHliaDRtd21heCJ9.1VEpXCZB8_yFFFdkwz9V-w';
 19     const map = new mapboxgl.Map({
 20         container: 'map',
 21         // Choose from Mapbox's core styles, or make your own style with Mapbox Studio
 22         style: 'mapbox://styles/mapbox/dark-v11',
 23         center: [-103.5917, 40.6699],
 24         zoom: 3
 25     });
 26
 27     map.on('load', () => {
 28         // Add a new source from our GeoJSON data and
 29         // set the 'cluster' option to true. GL-JS will
 30         // add the point_count property to your source data.
 31         map.addSource('earthquakes', {
 32             type: 'geojson',
 33             // Point to GeoJSON data. This example visualizes all M1.0+ earthquakes
 34             // from 12/22/15 to 1/21/16 as logged by USGS' Earthquake hazards program.
 35             data: 'https://docs.mapbox.com/mapbox-gl-js/assets/earthquakes.geojson',
 36             cluster: true,
 37             clusterMaxZoom: 14, // Max zoom to cluster points on
 38             clusterRadius: 50 // Radius of each cluster when clustering points (defaults to 50)
 39         });
 40
 41         map.addLayer({
 42             id: 'clusters',
 43             type: 'circle',
 44             source: 'earthquakes',
 45             filter: ['has', 'point_count'],
 46             paint: {
 47                 // Use step expressions (https://docs.mapbox.com/style-spec/reference/expressions/#step)
 48                 // with three steps to implement three types of circles:
 49                 //   * Blue, 20px circles when point count is less than 100
 50                 //   * Yellow, 30px circles when point count is between 100 and 750
 51                 //   * Pink, 40px circles when point count is greater than or equal to 750
 52                 'circle-color': [
 53                     'step',
 54                     ['get', 'point_count'],
 55                     '#51bbd6',
 56                     100,
 57                     '#f1f075',
 58                     750,
 59                     '#f28cb1'
 60                 ],
 61                 'circle-radius': [
 62                     'step',
 63                     ['get', 'point_count'],
 64                     20,
 65                     100,
 66                     30,
 67                     750,
 68                     40
 69                 ]
 70             }
 71         });
 72
 73         map.addLayer({
 74             id: 'cluster-count',
 75             type: 'symbol',
 76             source: 'earthquakes',
 77             filter: ['has', 'point_count'],
 78             layout: {
 79                 'text-field': ['get', 'point_count_abbreviated'],
 80                 'text-font': ['DIN Offc Pro Medium', 'Arial Unicode MS Bold'],
 81                 'text-size': 12
 82             }
 83         });
 84
 85         map.addLayer({
 86             id: 'unclustered-point',
 87             type: 'circle',
 88             source: 'earthquakes',
 89             filter: ['!', ['has', 'point_count']],
 90             paint: {
 91                 'circle-color': '#11b4da',
 92                 'circle-radius': 4,
 93                 'circle-stroke-width': 1,
 94                 'circle-stroke-color': '#fff'
 95             }
 96         });
 97
 98         // inspect a cluster on click
 99         map.on('click', 'clusters', (e) => {
100             const features = map.queryRenderedFeatures(e.point, {
101                 layers: ['clusters']
102             });
103             const clusterId = features[0].properties.cluster_id;
104             map.getSource('earthquakes').getClusterExpansionZoom(
105                 clusterId,
106                 (err, zoom) => {
107                     if (err) return;
108
109                     map.easeTo({
110                         center: features[0].geometry.coordinates,
111                         zoom: zoom
112                     });
113                 }
114             );
115         });
116
117         // When a click event occurs on a feature in
118         // the unclustered-point layer, open a popup at
119         // the location of the feature, with
120         // description HTML from its properties.
121         map.on('click', 'unclustered-point', (e) => {
122             const coordinates = e.features[0].geometry.coordinates.slice();
123             const mag = e.features[0].properties.mag;
124             const tsunami =
125                 e.features[0].properties.tsunami === 1 ? 'yes' : 'no';
126
127             // Ensure that if the map is zoomed out such that
128             // multiple copies of the feature are visible, the
129             // popup appears over the copy being pointed to.
130             if (['mercator', 'equirectangular'].includes(map.getProjection().name)) {
131                 while (Math.abs(e.lngLat.lng - coordinates[0]) > 180) {
132                     coordinates[0] += e.lngLat.lng > coordinates[0] ? 360 : -360;
133                 }
134             }
135
136             new mapboxgl.Popup()
137                 .setLngLat(coordinates)
138                 .setHTML(
139                     `magnitude: ${mag}<br>Was there a tsunami?: ${tsunami}`
140                 )
141                 .addTo(map);
142         });
143
144         map.on('mouseenter', 'clusters', () => {
145             map.getCanvas().style.cursor = 'pointer';
146         });
147         map.on('mouseleave', 'clusters', () => {
148             map.getCanvas().style.cursor = '';
149         });
150     });
151 </script>
152
153 </body>
154 </html>
  1 <!DOCTYPE html>
  2 <html>
  3 <head>
  4 <meta charset="utf-8">
  5 <title>Add custom icons with Markers</title>
  6 <meta name="viewport" content="initial-scale=1,maximum-scale=1,user-scalable=no">
  7 <link href="https://api.mapbox.com/mapbox-gl-js/v3.5.1/mapbox-gl.css" rel="stylesheet">
  8 <script src="https://api.mapbox.com/mapbox-gl-js/v3.5.1/mapbox-gl.js"></script>
  9 <style>
 10 body { margin: 0; padding: 0; }
 11 #map { position: absolute; top: 0; bottom: 0; width: 100%; }
 12 </style>
 13 </head>
 14 <body>
 15 <style>
 16     .marker {
 17         display: block;
 18         border: none;
 19         border-radius: 50%;
 20         cursor: pointer;
 21         padding: 0;
 22     }
 23 </style>
 24
 25 <div id="map"></div>
 26
 27 <script>
 28     mapboxgl.accessToken = 'pk.eyJ1IjoiY3B0aHJzdW4iLCJhIjoiY2x4YjlvdjhrMGY5eTJrcHliaDRtd21heCJ9.1VEpXCZB8_yFFFdkwz9V-w';
 29     const geojson = {
 30         'type': 'FeatureCollection',
 31         'features': [
 32             {
 33                 'type': 'Feature',
 34                 'properties': {
 35                     'message': 'Foo',
 36                     'imageId': 1011,
 37                     'iconSize': [60, 60]
 38                 },
 39                 'geometry': {
 40                     'type': 'Point',
 41                     'coordinates': [-66.324462, -16.024695]
 42                 }
 43             },
 44             {
 45                 'type': 'Feature',
 46                 'properties': {
 47                     'message': 'Bar',
 48                     'imageId': 870,
 49                     'iconSize': [50, 50]
 50                 },
 51                 'geometry': {
 52                     'type': 'Point',
 53                     'coordinates': [-61.21582, -15.971891]
 54                 }
 55             },
 56             {
 57                 'type': 'Feature',
 58                 'properties': {
 59                     'message': 'Baz',
 60                     'imageId': 837,
 61                     'iconSize': [40, 40]
 62                 },
 63                 'geometry': {
 64                     'type': 'Point',
 65                     'coordinates': [-63.292236, -18.281518]
 66                 }
 67             }
 68         ]
 69     };
 70
 71     const map = new mapboxgl.Map({
 72         container: 'map',
 73         // Choose from Mapbox's core styles, or make your own style with Mapbox Studio
 74         style: 'mapbox://styles/mapbox/streets-v12',
 75         center: [-65.017, -16.457],
 76         zoom: 5
 77     });
 78
 79     // Add markers to the map.
 80     for (const marker of geojson.features) {
 81         // Create a DOM element for each marker.
 82         const el = document.createElement('div');
 83         const width = marker.properties.iconSize[0];
 84         const height = marker.properties.iconSize[1];
 85         el.className = 'marker';
 86         el.style.backgroundImage = `url(https://picsum.photos/id/${marker.properties.imageId}/${width}/${height})`;
 87         el.style.width = `${width}px`;
 88         el.style.height = `${height}px`;
 89         el.style.backgroundSize = '100%';
 90
 91         el.addEventListener('click', () => {
 92             window.alert(marker.properties.message);
 93         });
 94
 95         // Add markers to the map.
 96         new mapboxgl.Marker(el)
 97             .setLngLat(marker.geometry.coordinates)
 98             .addTo(map);
 99     }
100 </script>
101
102 </body>
103 </html>
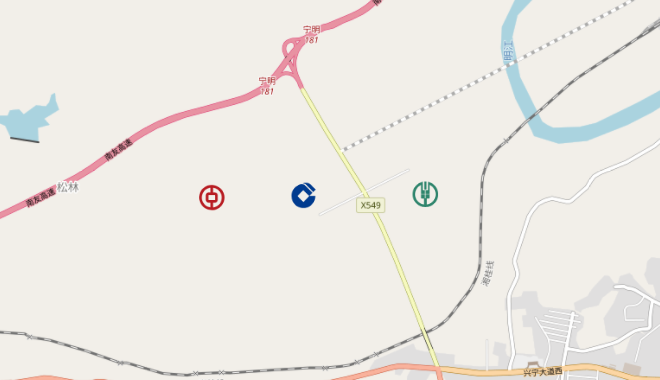
 1   map.on('load',() => {
 2       const canvas = document.createElement('canvas')
 3       const ctx = canvas.getContext('2d')
 4       const img = new Image()
 5       img.src = './lib/merge.png'
 6       img.onload =  async () => {
 7         canvas.width = img.width
 8         canvas.height = img.height
 9         ctx.drawImage(img, 0, 0)
10         fetch('./lib/merge.json').then(res => res.json()).then(res => {
11           for (const k in res) {
12             const { width, height, x, y } = res[k]
13             const data = ctx.getImageData(x, y, width, height).data
14             map.addImage(k, { width, height, data })
15           }
16           map.addSource('points', {
17             type: 'geojson',
18             data: {
19               type: 'FeatureCollection',
20               features: [
21                 {
22                   "type": "Feature",
23                   "properties": { icon: 'zgyh' },
24                   "geometry": { "type": "Point", "coordinates": [107.0132554, 22.1441921] }
25                 },
26                 {
27                   "type": "Feature",
28                   "properties": { icon: 'jsyh' },
29                   "geometry": { "type": "Point", "coordinates": [107.0223554, 22.1443921] }
30                 },
31                 {
32                   "type": "Feature",
33                   "properties": { icon: 'nyyh' },
34                   "geometry": { "type": "Point", "coordinates": [107.0344554, 22.1444921] }
35                 }
36               ]
37             }
38
39           });
40           map.addLayer({
41             'id': 'points-h',
42             'type': 'symbol',
43             'source': 'points',
44             'layout': {
45               'icon-allow-overlap': true,
46               'icon-image': ['get', 'icon'],
47               'icon-size': [
48                 "interpolate",
49                 [
50                   "exponential",
51                   1.5
52                 ],
53                 [
54                   "zoom"
55                 ],
56                 5, 0.5,
57                 10, 0.8
58               ]
59             },
60           });
61         })
62       }
63     })
此内容由惯性聚合(RSS阅读器)自动聚合整理,仅供阅读参考。 原文来自 — 版权归原作者所有。